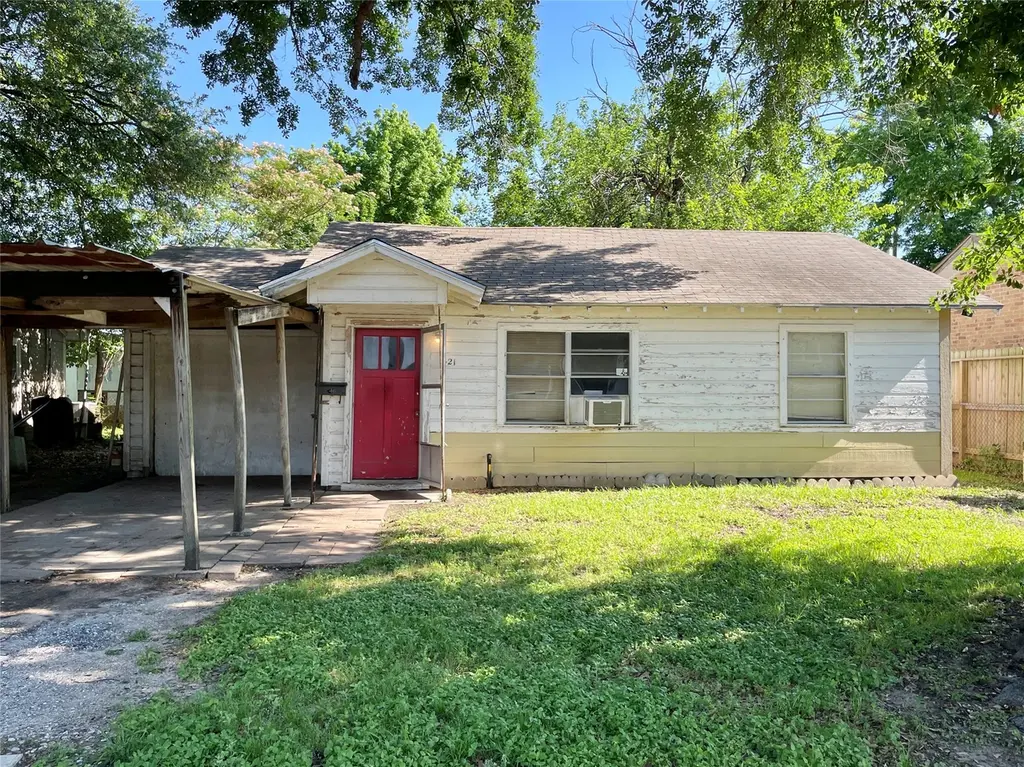
421 Benbrook Dr · Houston, TX
Flood risk 1/10 · Minimal
- FEMA flood zone
- X (unshaded)
- Chance of flooding over 30 yrs
- 0.0%
- Est. flood insurance / yr
- $507 – $1,088
Fire risk 1/10 · Minimal
- Est. fire insurance / yr
- $1,222 – $2,270
Heat risk 9/10 · Severe
- Hot days now (above 109°F)
- 7 days/yr
- Hot days in 30 yrs
- 22 days/yr
Wind risk 9/10 · Severe
- Chance of severe wind over 30 yrs
- 99.0%
Air-quality risk 3/10 · Minor
- Unhealthy air days now
- 3 days/yr
- Unhealthy air days in 30 yrs
- 4 days/yr
Risk factors via First Street. Map © Google.
Why this score? — see what drove the C+ grade
The composite is a weighted blend of 9 inputs, each scored 0–100. Each bar is that input's sub-score; the figure is the points it added to the 100-point composite (weight × sub-score).
- Cash flow +22.3/30.0
- ARV discount +15.0/15.0
- DSCR +7.2/10.0
- 1% rule +5.7/10.0
- Livability +3.7/5.0
- Schools +2.7/10.0
- Rent growth +2.5/5.0
- Condition / age +2.5/5.0
- Appreciation +0.0/10.0
$125,000
🖨 Deal sheet 📄 Offer letter ✓ Due diligence
Listing remarks MLS
Here's an opportunity in the heart of Houston, Texas. Situated on a nice lot shaded by beautiful, mature trees, this property offers a chance for investors, house flippers, or buyers looking to get their start. The existing home is 728 SF and includes 2 bedrooms and 1 bathroom. The house is in need of renovations, providing a chance for the buyer to customize and restore to its previous charm. Enjoy the shade and character that large established trees provide while being conveniently located near all that Houston has to offer. Whether you’re searching for a project or a lot to build on this property could be right for you.
Key facts
- 6,830 sq ft lot
- Garage
- Built 1950
Property features AI
Exterior
- Parking: Attached carport; Driveway; Garage; Total parking for 3 vehicles; One covered parking space
- Utilities: Electricity connected; Public water; Public sewer
- Home design: Single-story; Faces south; Resale property
- Construction: Wood siding exterior; Shingle roof; Combination and slab foundation; Built (year per public records)
- Exterior features: Covered front porch; Storage structure; See remarks
Interior
- Kitchen: Kitchen (main level)
- Bedrooms: Two main-level bedrooms
- Flooring: Linoleum; Wood
- Bathrooms: One full bathroom (main level)
- Heating & cooling: Wall/window air conditioning units; Heating: see remarks
- Interior features: Aluminum window frames; See remarks
- Laundry & utility: Laundry located in garage
Neighborhood map
What this means for you Summary
Snapshot
- This is a 2-bed/1.0-bath single-family listed at $125k.
Deal economics
- At list price, monthly cash flow is $207 ($2k/yr) — positive.
- The deal already cash-flows at list — no discount required.
- Meets the 1% rule at list price ($1k rent vs $125k).
- Cap rate 8.3% vs local median 3.2% in Houston — top-decile yield for the area; either an underpriced asset or a hidden risk that comps aren't pricing in. Stress-test before assuming the spread holds.
Location & tenants
- Location reads 74/100 on livability (#184 in TX, #4,771 nationally) — a middle-class / working-renter tenant base. Strengths: amenities A+, cost of living A+, housing A+; Watch: schools D, crime F.
- Houston ISD (urban): math 27% / reading 35% proficiency, ranked #593 of 826 in TX (top 72%) — families likely to look elsewhere, expect single-tenant / working-renter base with shorter leases; 71% free/reduced lunch — lower-income household profile, screen leases tightly.
- Market conditions: 83 active listings in the ZIP; 9 comparable units currently listed for rent nearby; rentals at typical pace (median 24d on market — plan ~3-4 weeks tenant-placement turnaround); 44% of comp listings sitting > 30 days — soft ceiling on asking rent; lower-income renter base — watch delinquency; 29,883 units permitted in Harris County in 2024 (8,621 in 5+ unit buildings).
- This rent runs 38% of the median local income ($43k/yr) — at the standard rent-burdened threshold; future hikes will face affordability resistance.
Forward outlook
- Local home prices are declining (-3.0%/yr); year-one equity from $864 of loan paydown is wiped out by about $4k of value loss. Plan a longer hold.
- Harris County population projected at +47% by 2050 — long-run rental-demand tailwind backs the buy-and-hold thesis.
Negotiation context
- Only 14 days on market — expect competitive offers; lowballing is unlikely to land.
- 2 sale attempts with the ask held roughly flat each time — persistent listings suggest the price (not the market) is what's stuck; bring a comps-based counter.
Risks & watch-outs
- Watch-outs: built in 1950 — expect roof / HVAC / electrical / plumbing capex.
- Climate carrying-cost: severe wind risk, 99% chance of damaging wind over 30y; extreme-heat days projected 7→22/yr by 2055 (HVAC capex compounding) — expect insurance premiums to compound above CPI over the hold.
Questions for the listing agent
- Built in 1950 — when were the roof, HVAC, electrical panel, plumbing, and water heater last replaced?
- Is there a deadline driving the sale (1031 exchange, divorce, estate, relocation)? That informs how much negotiation room exists.
- Schools are D-rated, which usually means shorter tenancies and higher turnover. Who's the typical renter profile here, and what's been the actual vacancy rate?
- Crime grade is F in this area — have there been break-ins, vandalism, or insurance claims at this property in the last 3 years? What carrier currently insures it and at what premium?
- What's the average days-on-market for RENTAL listings here right now (not sales)? A rising rental-DOM trend means longer vacancies and softer asking-rent achievability than the comps imply.
- What's the recent tenant-quality profile in this submarket — average credit score on applications, eviction rate, late-payment / NSF rate, and stable-employment percentage? A property-management company in the area should have these aggregated.
- How much new for-sale + rental construction is in the pipeline within 1–3 miles? Heavy new supply typically softens prices + rents 12–24 months out; constrained supply supports both.
Investment metrics
- 1% rule
- 1.07% ✓
- Cap rate
- 8.28%
- Cash-on-cash
- 7.09%
- DSCR
- 1.32
- GRM
- 7.8
CMA / ARV
- ARV (on-the-fly)
- $173,264
- Comps found
- 5
Show comp detail 5 sales within ~0.75 mi
| Address | Dist | Beds/Ba | Sqft | Sold | Price | $/sf | Match |
|---|---|---|---|---|---|---|---|
| 421 Benbrook Dr | 0.00mi | 2/1.0 | 728 (0%) | 0mo | $125,000 | $172 | 100 |
| 301 E Roselane St | 0.41mi | 2/1.0 | 728 (0%) | 22mo | $167,500 | $230 | 62 |
| 11921 Meadowgreen St | 0.61mi | 2/2.0 | 736 (+1%) | 20mo | $260,000 | $353 | 49 |
| 620 Rittenhouse St | 0.51mi | 2/1.0 | 798 (+10%) | 17mo | $189,900 | $238 | 46 |
| 7512 Van Ness St | 0.75mi | 2/1.0 | 832 (+14%) | 2mo | $275,000 | $331 | 40 |
Match score weights: distance 35% · size 25% · config 20% · recency 20%. Top-matched comps best support the ARV.
Projected returns pro-forma
-3.0% appreciation · 3.0% rent growth · sell at horizon
- IRR
- -5.4%
- Equity multiple
- 0.80×
- Total profit
- $-7,085
- Equity at exit
- $18,638
- IRR
- 4.2%
- Equity multiple
- 1.31×
- Total profit
- $10,814
- Equity at exit
- $10,808
Cash invested: $35,000 (down + closing). Projections, not guarantees.
Landlord ↔ Tenant lean methodology
- Overall (STATE)
- 87 Strongly Landlord-Friendly
- State Texas
- 87 Strongly Landlord-Friendly · R+5
- County
- — inherits STATE
- City
- — inherits STATE
ZIP-level market 77076
- Home prices YoY
- -21.5%
- Active inventory
- 83
- Price-to-rent
- 7.8×
Monthly cashflow live
- Estimated rent
- $1,331 high interval (Pro) →
- Mortgage (P&I)
- −$656
- Tax from tax record
- −$138 /mo · $1,650/yr
- Insurance
- −$52
- HOA
- −$0
- Vacancy / Maint / Mgmt
- −$280
- Net cashflow
- $207
Break-even live
UW: 25.0% down · 7.5% · 30yr · 1.5% tax · 5.0% vac · 8.0% maint · 8.0% mgmt
Financing live
Cash to close
- Down payment
- $31,250
- Closing costs
- $3,750
- Reserves months
- —
- Total cash needed
- —
Loan-product check · same deal, 3 products live
Conventional
25% down · 7.5% · 30yr
- Down + closing
- —
- Monthly P&I
- —
- Monthly cashflow
- —
- DSCR
- —
- Eligible?
- —
Personal DTI + credit; lowest rate.
DSCR
20% down · 8.5% · 30yr
- Down + closing
- —
- Monthly P&I
- —
- Monthly cashflow
- —
- DSCR
- —
- Eligible?
- —
No personal income docs; deal must DSCR.
Hard money
10% down · 12.0% · 12mo
- Down + closing
- —
- Monthly P&I
- —
- Monthly cashflow
- —
- DSCR
- —
- Eligible?
- —
Short-term bridge; refi at stabilization.
Rent comps 9 comps
| Address | Beds | Baths | Sqft | Rent | $/sqft | DOM | Units | Dist |
|---|---|---|---|---|---|---|---|---|
| 600 E Little York Rd Houston, TX | 1.0–3.0 | 1.0–2.0 | 847 | $1,108 | $1.31 | 14d | 17 | 0.71mi |
| 510 E Little York Rd Houston, TX | 1.0 | 1.0 | 681 | $1,149 | $1.69 | 43d | 1 | 0.99mi |
| 510 E Little York Rd Houston, TX | 1.0 | 1.0 | 681 | $1,149 | $1.69 | 24d | 1 | 0.99mi |
| 1917 Kowis St Unit 5 Houston, TX | 2.0 | 1.0 | 500 | $850 | $1.70 | 43d | 1 | 1.24mi |
| 300 Dipping Ln Houston, TX | 1.0 | 1.0 | 681 | $1,149 | $1.69 | 18d | 1 | 1.28mi |
| 313 Sunnyside St Houston, TX | 1.0–3.0 | 1.0–2.0 | 922 | $1,071 | $1.16 | 43d | 16 | 1.34mi |
| 313 Sunnyside St Houston, TX | 1.0–2.0 | 1.0–1.5 | 880 | $1,301 | $1.48 | 1d | 24 | 1.34mi |
| 6301 Alfano St Houston, TX | 1.0 | 1.0 | 635 | $895 | $1.41 | 43d | 1 | 1.34mi |
| 9400 Bauman Rd Houston, TX | 1.0–2.0 | 1.0 | 800 | $1,207 | $1.51 | 22d | 6 | 1.49mi |
Listing history 7 events
-
2026-06-02status $125,000 Pending 14 DOM
-
2026-06-01days on market $125,000 Active 14 DOM
Show marketing remark (636 chars)
Here's an opportunity in the heart of Houston, Texas. Situated on a nice lot shaded by beautiful, mature trees, this property offers a chance for investors, house flippers, or buyers looking to get their start. The existing home is 728 SF and includes 2 bedrooms and 1 bathroom. The house is in need of renovations, providing a chance for the buyer to customize and restore to its previous charm. Enjoy the shade and character that large established trees provide while being conveniently located near all that Houston has to offer. Whether you’re searching for a project or a lot to build on this property could be right for you.
-
2026-05-31days on market $125,000 Active 13 DOM
-
2026-05-18$125,000 Active 693-char remark
-
2026-05-15$125,000 Active 636-char remark
Show marketing remark (636 chars)
Here's an opportunity in the heart of Houston, Texas. Situated on a nice lot shaded by beautiful, mature trees, this property offers a chance for investors, house flippers, or buyers looking to get their start. The existing home is 728 SF and includes 2 bedrooms and 1 bathroom. The house is in need of renovations, providing a chance for the buyer to customize and restore to its previous charm. Enjoy the shade and character that large established trees provide while being conveniently located near all that Houston has to offer. Whether you’re searching for a project or a lot to build on this property could be right for you.
-
2016-05-17soldstatus
-
1988-01-02soldstatus
ⓘ Source: listings_history table (triggers on properties + properties_extension) + one-shot
backfill from property_details.listing_events for pre-trigger history.
Tax reassessment forecast TX · Resets to sale price
- Current annual tax
- $1,650 · $138/mo
- Projected year-2 tax
- $2,288 · $191/mo
- Expected delta
- +$637/yr (+$53/mo · 38.6%)
ⓘ Screening estimate from a state-policy table — verify with the county assessor before closing.
Climate risk First Street
- Flood 1/10 Low FEMA zone X (unshaded) · 0% chance over 30 yrs
- Wildfire 1/10 Low
- Heat 9/10 Extreme 7 d/yr ≥109°F today · 22 d/yr by 30 yrs out
- Wind 9/10 Extreme 99% chance of damaging wind over 30 yrs
- Air quality 3/10 Moderate 3 unhealthy d/yr today · 4 by 30 yrs out
Nearby sold comps map
Loading sold comps map…
Walkable amenities ~0.75 mi
Loading nearby amenities…
Taxation est. · year 1
- Rental income
- $15,976
- − Mortgage interest
- −$7,002
- − Property taxes
- −$1,650
- − Insurance
- −$625
- − Repairs & maintenance
- −$1,278
- − Management
- −$1,278
- − Depreciation
- −$3,636
- Taxable income
- $507
- Est. tax owed @ 24.0%
- −$122
- After-tax cash flow
- $2,358/yr
For passive investors: Depreciation is non-cash, so a rental often shows a tax loss while cash-flowing — sheltering income. Rental losses are passive: they offset passive income freely, and up to $25,000/yr can offset ordinary (W-2) income if you actively participate and your MAGI is under $100k (phasing out to $0 by $150k); unused losses carry forward. On sale, claimed depreciation is recaptured at up to 25%, and gains may owe capital-gains tax (a 1031 exchange can defer both). Figures are a year-1 estimate at your 24.0% rate — not tax advice; consult a CPA.
Schools (NCES district)
- District
- Houston ISD
- NCES district ID
- 4823640
- Math proficiency
- 27% ▼ -18.00%
- Reading proficiency
- 35% ▼ -6.00%
- Median HH income
- $46,054
- Composite
- 26.63/100
- National rank
- #7173
- State rank
- #593 of 826 in TX
Livability — Houston
- Score
- 74/100
- State rank
- #184
- US rank
- #4771
Category grades
Schools grade is shown separately in the Schools card above.
Census & demographics
- Census place
- Houston, TX
- County
- Harris County · 4,702,590 people
- City population
- 3,226,434
- Metro
- Houston-The Woodlands-Sugar Land, TX
- Population (ZIP)
- 31,222
- Household income
- $42,522
- Rent vs Own
- Severe rent burden
- 1781.0
Population outlook (Harris County) Hauer SSP2
- Today (2025)
- 5,571,493 people
- By 2030
- 6,089,821 · +9.3%
- By 2040
- 7,142,806 · +28.2%
- By 2050
- 8,185,864 · +46.9%
- By 2075
- 10,574,329 · +89.8%
- By 2100
- 12,109,958 · +117.4%
Race, ethnicity, and origin ACS 2023
- Neighborhood character
- Predominantly Hispanic (86%)
- Race & ethnicity
- Hispanic / Latino 86% Two or more races 29% Black 7% White 6%
- Hispanic origin (detail)
- Mexican 61%
- Common ancestry
- Romanian 1%
- Foreign-born
- 35% · Canada
- Languages at home
- 25% English-only · Spanish 74%
Political lean MEDSL · Harris
- 2024 margin
- Lean D (+5.5) · D 52.0% · R 46.4% · Other 1.6%
- 2008→2024 swing
- +3.9pp toward D · 2008: 1.6pp · 2024: 5.5pp
- All cycles
- 2024: D+5.5 2020: D+13.3 2016: D+12.4 2012: D+0.1 2008: D+1.6
Not yet ingested
- Civics
- —
Market trends
- HPI YoY
- ▼ -79.76%
- Current HPI
- 291.7578
- Rent YoY
- —
- Metro
- Houston-The Woodlands-Sugar Land, TX
- State GDP YoY
- ▲ 3.95%
- F500 in state
- 110
Industry mix (Fortune 500 HQ in TX)
| Industry | F500 HQs | Revenue |
|---|---|---|
| Energy | 16 | $1,198B |
|
||
| Technology | 5 | $198B |
|
||
| Engineering / Construction | 4 | $72B |
|
||
| Energy Services | 3 | $60B |
|
||
| Utilities | 3 | $41B |
|
||
| Healthcare | 2 | $330B |
|
||
Price history
+0.0% since first listed8 events — show timeline
- 2026-06-12 Sold (MLS) — Unlock MLS
- 2026-06-12 Sold (MLS) — HARMLS
- 2026-06-01 Pending — HARMLS
- 2026-06-01 Pending — Unlock MLS
- 2026-05-18 Listed $125,000 Unlock MLS
- 2026-05-15 Listed $125,000 HARMLS
- 2016-05-17 Sold (Public Records) — Public Records
- 1988-01-02 Sold (Public Records) — Public Records
Property tax history
+4.7%/yrLatest (2025): $1,650 · +11.7% YoY. Source: county tax records.
Cash-flow waterfall
monthlySold comps — $/sqft
last 12 mo · ≤1 miLoading sold comps…