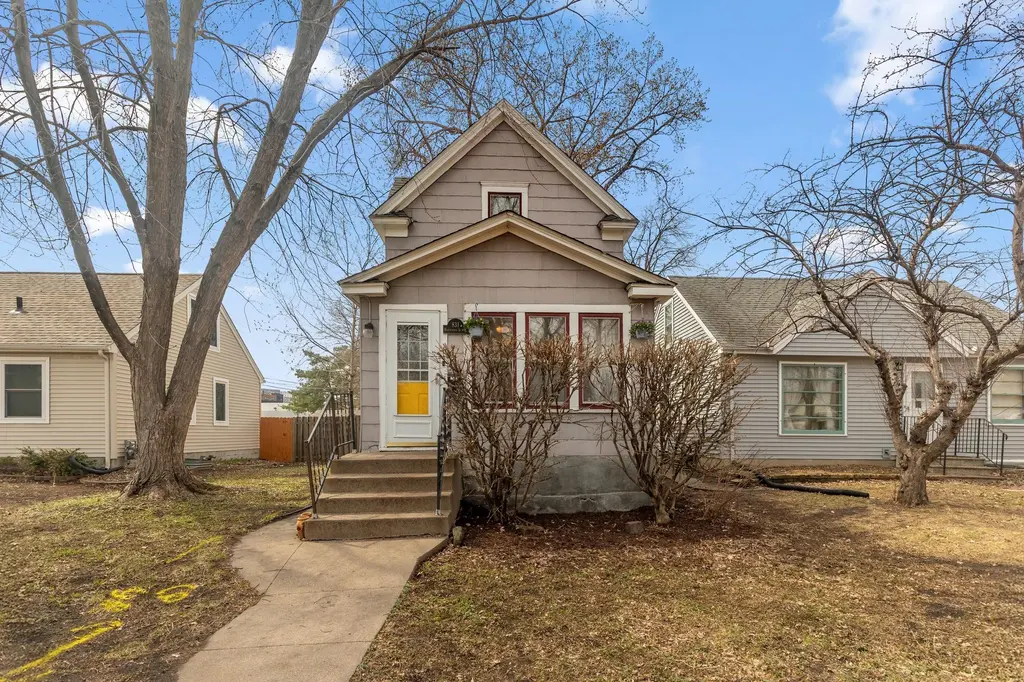
831 19th Ave SE · Minneapolis, MN
Flood risk 6/10 · Moderate
- FEMA flood zone
- X (unshaded)
- Chance of flooding over 30 yrs
- 0.67%
- Est. flood insurance / yr
- $473 – $860
Fire risk 1/10 · Minimal
- Est. fire insurance / yr
- $888 – $1,650
Heat risk 2/10 · Minimal
- Hot days now (above 100°F)
- 7 days/yr
- Hot days in 30 yrs
- 14 days/yr
Wind risk 2/10 · Minimal
- Chance of severe wind over 30 yrs
- —
Air-quality risk 2/10 · Minimal
- Unhealthy air days now
- 1 days/yr
- Unhealthy air days in 30 yrs
- 1 days/yr
Risk factors via First Street. Map © Google.
Why this score? — see what drove the D grade
The composite is a weighted blend of 9 inputs, each scored 0–100. Each bar is that input's sub-score; the figure is the points it added to the 100-point composite (weight × sub-score).
- ARV discount +12.5/15.0
- Cash flow +10.7/30.0
- Livability +3.9/5.0
- Rent growth +3.7/5.0
- Schools +3.5/10.0
- 1% rule +3.2/10.0
- DSCR +3.1/10.0
- Condition / age +2.5/5.0
- Appreciation +0.0/10.0
$255,000
🖨 Deal sheet 📄 Offer letter ✓ Due diligence
Listing remarks MLS
Walk to campus. U of M gem. New High Efficiency Furnace, A/C & Hot Water Heater. Well maintained, with hardwoods, Large, spacious rooms w/ potential for 3rd BR. in BSMT, privacy fence, Front porch, Almost 100% of time was owner occupied. Love it!
Key facts
- 5,227 sq ft lot
- Built 1910
- Listed 24 days
Property features AI
Exterior
- Parking: Gravel parking
- Utilities: City water connected; City sewer connected; Natural gas; Electric service with circuit breakers and 100 amp service
- Home design: Residential property; One and one-half stories; Foundation listed as other
- Construction: Asphalt roof (over 8 years old); Block basement foundation
- Exterior features: Enclosed rear porch and additional porch; Chain link and wood full fencing; Public transit within 6 blocks; Heavy tree coverage; City street frontage with paved streets, sidewalks and street lights; Publicly maintained road
Interior
- Kitchen: Range; Dishwasher; Refrigerator
- Bedrooms: 3 bedrooms (two upper-level bedrooms, one bedroom listed without level specified)
- Bathrooms: Main floor full bathroom
- Heating & cooling: Forced air heating; Central air conditioning
- Interior features: Informal dining room; Partially finished basement with egress window(s); Storage shed
- Laundry & utility: Washer; Dryer (laundry located in basement)
Neighborhood map
What this means for you Summary
Snapshot
- This is a 3-bed/1.0-bath single-family listed at $255k.
Deal economics
- At list price, monthly cash flow is $-123 ($-1k/yr) — negative.
- To cash-flow at today's rent, offer at most $233k (8.5% below list).
- To meet the 1% rule (rent ≥ 1% of price), the offer needs to be $209k (18.1% below list).
- Recommended offer: $209k (18.1% below list) — sets the bar for 1% rule.
- Cap rate 5.7% vs local median 3.1% in Minneapolis — top-decile yield for the area; either an underpriced asset or a hidden risk that comps aren't pricing in. Stress-test before assuming the spread holds.
Location & tenants
- Location reads 78/100 on livability (#110 in MN, #2,525 nationally) — a middle-class / working-renter tenant base. Strengths: amenities A+, commute A+, housing A+; Watch: cost of living C-, crime F.
- Minneapolis Public School District (urban): math 35% / reading 46% proficiency, ranked #217 of 301 in MN (top 72%) — families likely to look elsewhere, expect single-tenant / working-renter base with shorter leases.
- Market conditions: Rents rising fast (+5.0%/yr); 87 active listings in the ZIP; 40 comparable units currently listed for rent nearby; rentals at typical pace (median 21d on market — plan ~3-4 weeks tenant-placement turnaround); 4,651 units permitted in Hennepin County in 2024 (2,443 in 5+ unit buildings).
- At $2,087/mo this rent would consume 48% of the median local household income ($52k/yr) (locally 3687% of renters already pay >50% of income on rent) — very limited rent-growth headroom before tenants either downsize or default.
Forward outlook
- Local home prices are declining (-3.0%/yr); year-one equity from $2k of loan paydown is wiped out by about $8k of value loss. Plan a longer hold.
- Hennepin County population projected at +30% by 2050 — long-run rental-demand tailwind backs the buy-and-hold thesis.
Negotiation context
- It's been on market 24 days — a 2% lower offer ($251k) is reasonable based on typical stale-listing flexibility.
- 3 sale attempts since 31y ago with the ask held roughly flat each time — persistent listings suggest the price (not the market) is what's stuck; bring a comps-based counter.
- Current owner paid $190k; 34% above their basis — modest negotiation headroom, anchor on the comps not their cost.
Risks & watch-outs
- Watch-outs: built in 1910 — expect roof / HVAC / electrical / plumbing capex.
- Climate carrying-cost: major flood risk — expect insurance premiums to compound above CPI over the hold.
Questions for the listing agent
- What do current leases actually rent for vs. the listed asking? Can we see a recent rent roll and the last 12 months of T-12 income?
- Built in 1910 — when were the roof, HVAC, electrical panel, plumbing, and water heater last replaced?
- Is there a deadline driving the sale (1031 exchange, divorce, estate, relocation)? That informs how much negotiation room exists.
- Crime grade is F in this area — have there been break-ins, vandalism, or insurance claims at this property in the last 3 years? What carrier currently insures it and at what premium?
- The area grade is low — what's the realistic commute time and amenity access for the typical tenant pool here? Any planned neighborhood developments (good or bad) we should know about?
- What's the average days-on-market for RENTAL listings here right now (not sales)? A rising rental-DOM trend means longer vacancies and softer asking-rent achievability than the comps imply.
- What's the recent tenant-quality profile in this submarket — average credit score on applications, eviction rate, late-payment / NSF rate, and stable-employment percentage? A property-management company in the area should have these aggregated.
- How much new for-sale + rental construction is in the pipeline within 1–3 miles? Heavy new supply typically softens prices + rents 12–24 months out; constrained supply supports both.
Investment metrics
- 1% rule
- 0.82% ✗
- Cap rate
- 5.71%
- Cash-on-cash
- -2.07%
- DSCR
- 0.91
- GRM
- 10.2
CMA / ARV
- ARV (median comp)
- $286,784
- List price
- $255,000
- Delta
- -11.08%
- Verdict
- UNDERPRICED
- Comps
- 2 within 1.0 mi
Projected returns pro-forma
-3.0% appreciation · 4.98% rent growth · sell at horizon
- IRR
- -17.5%
- Equity multiple
- 0.37×
- Total profit
- $-44,879
- Equity at exit
- $38,021
- IRR
- -6.2%
- Equity multiple
- 0.57×
- Total profit
- $-30,899
- Equity at exit
- $22,048
Cash invested: $71,400 (down + closing). Projections, not guarantees.
Landlord ↔ Tenant lean methodology
- Overall (CITY)
- 34 Tenant-Leaning
- State Minnesota
- 46 Balanced · D+2
- County
- — inherits STATE
- City Minneapolis
- 34 Tenant-Leaning · D+50
ZIP-level market 55414
- Rents YoY
- 5.0%
- Active inventory
- 87
- Price-to-rent
- 10.2×
Monthly cashflow live
- Estimated rent
- $2,087 high interval (Pro) →
- Mortgage (P&I)
- −$1,337
- Tax from tax record
- −$328 /mo · $3,941/yr
- Insurance
- −$106
- HOA
- −$0
- Vacancy / Maint / Mgmt
- −$438
- Net cashflow
- $-123
Break-even live
UW: 25.0% down · 7.5% · 30yr · 1.5% tax · 5.0% vac · 8.0% maint · 8.0% mgmt
Financing live
Cash to close
- Down payment
- $63,750
- Closing costs
- $7,650
- Reserves months
- —
- Total cash needed
- —
Loan-product check · same deal, 3 products live
Conventional
25% down · 7.5% · 30yr
- Down + closing
- —
- Monthly P&I
- —
- Monthly cashflow
- —
- DSCR
- —
- Eligible?
- —
Personal DTI + credit; lowest rate.
DSCR
20% down · 8.5% · 30yr
- Down + closing
- —
- Monthly P&I
- —
- Monthly cashflow
- —
- DSCR
- —
- Eligible?
- —
No personal income docs; deal must DSCR.
Hard money
10% down · 12.0% · 12mo
- Down + closing
- —
- Monthly P&I
- —
- Monthly cashflow
- —
- DSCR
- —
- Eligible?
- —
Short-term bridge; refi at stabilization.
Rent comps 40 comps
| Address | Beds | Baths | Sqft | Rent | $/sqft | DOM | Units | Dist |
|---|---|---|---|---|---|---|---|---|
| 924 17th Ave SE Minneapolis, MN | 2.0–4.0 | 1.0–2.0 | 1100 | $2,000 | $1.82 | 43d | 1 | 0.11mi |
| 1410 Rollins Ave SE Minneapolis, MN | 2.0–3.0 | 1.0 | 1200 | $2,400 | $2.00 | 43d | 1 | 0.26mi |
| 1801 Talmage Ave SE Minneapolis, MN | 4.0–5.0 | 2.0 | 1800 | $2,695 | $1.50 | 1d | 2 | 0.33mi |
| 808 13th Ave SE Apt 3 Minneapolis, MN | 2.0 | 1.0 | 950 | $1,450 | $1.53 | 24d | 1 | 0.37mi |
| 1034 14th Ave SE Minneapolis, MN | 2.0 | 1.0 | 945 | $1,750 | $1.85 | 24d | 1 | 0.39mi |
| 1220 Brook Ave SE Minneapolis, MN | 3.0 | 1.0–3.0 | 807 | $2,362 | $2.93 | 3d | 32 | 0.40mi |
| 815 13th Ave SE Minneapolis, MN | 1.0–4.0 | 1.0–2.0 | 1171 | $2,017 | $1.72 | 43d | 46 | 0.40mi |
| 1014 24th Ave SE Unit 2 Minneapolis, MN | 2.0 | 1.0 | 1000 | $1,525 | $1.52 | 3d | 1 | 0.43mi |
| 919 26th Ave SE Minneapolis, MN | 4.0 | 2.0 | 1534 | $2,750 | $1.79 | 10d | 1 | 0.48mi |
| 1117 SE 8th St Unit 001 Minneapolis, MN | 4.0 | 2.0 | 1800 | $2,200 | $1.22 | 3d | 1 | 0.49mi |
| 425 13th Ave SE Minneapolis, MN | 1.0–4.0 | 1.0–2.0 | 827 | $1,900 | $2.30 | 2d | 36 | 0.57mi |
| 612 11th Ave SE Minneapolis, MN | 4.0 | 2.0 | 1577 | $2,800 | $1.78 | 20d | 1 | 0.58mi |
| 1215 4th St SE Unit 1 Minneapolis, MN | 3.0 | 1.0 | 1050 | $1,600 | $1.52 | 43d | 1 | 0.62mi |
| 721 10th Ave SE Unit B Minneapolis, MN | 3.0 | 1.0 | 1100 | $1,850 | $1.68 | 24d | 1 | 0.63mi |
| 902 SE 9th Ave Unit 902 Minneapolis, MN | 3.0 | 1.0 | 1100 | $1,800 | $1.64 | 43d | 1 | 0.66mi |
| 815 SE 9th St Minneapolis, MN | 1.0–4.0 | 1.0–4.0 | 1149 | $2,532 | $2.20 | 2d | 13 | 0.75mi |
| 1000 University Ave SE Minneapolis, MN | 2.0–4.0 | 1.0–2.0 | 1136 | $2,465 | $2.17 | 24d | 9 | 0.82mi |
| 619 SE 8th St Minneapolis, MN | 2.0 | 2.0 | 1043 | $1,800 | $1.73 | 14d | 1 | 0.87mi |
| 711 4th St SE Minneapolis, MN | 4.0 | 1.0–2.0 | 1667 | $2,625 | $1.57 | 43d | 51 | 0.89mi |
| 621 6th St SE Unit 2 Minneapolis, MN | 2.0 | 1.0 | 1100 | $2,000 | $1.82 | 43d | 1 | 0.90mi |
| 621 6th St SE Unit 1 Minneapolis, MN | 2.0 | 1.0 | 1100 | $2,000 | $1.82 | 43d | 1 | 0.90mi |
| 414 7th Ave SE Minneapolis, MN | 2.0 | 1.0 | 1056 | $1,400 | $1.33 | 14d | 24 | 0.93mi |
| 627 Pierce St NE Unit 2 Minneapolis, MN | 3.0 | 1.0 | 900 | $1,795 | $1.99 | 43d | 1 | 1.04mi |
| 515 5th Ave SE Minneapolis, MN | 3.0 | 1.0 | 1200 | $1,995 | $1.66 | 43d | 1 | 1.06mi |
| 410 6th St SE Minneapolis, MN | 1.0–2.0 | 1.0 | 850 | $1,600 | $1.88 | 14d | 1 | 1.09mi |
| 485 Malcolm Ave SE Minneapolis, MN | 2.0 | 1.0–2.0 | 637 | $2,455 | $3.85 | 2d | 22 | 1.10mi |
| 626 NE Taylor St Unit 1 Minneapolis, MN | 3.0 | 1.0 | 1250 | $1,875 | $1.50 | 43d | 1 | 1.15mi |
| 1423 12th Ave NE Unit 2 Minneapolis, MN | 2.0 | 1.0 | 1000 | $1,950 | $1.95 | 43d | 1 | 1.22mi |
| 1800 Washington Ave S Minneapolis, MN | 2.0 | 1.0–2.0 | 674 | $2,310 | $3.43 | 2d | 23 | 1.29mi |
| 732 Polk St NE Minneapolis, MN | 2.0 | 1.0 | 900 | $1,599 | $1.78 | 43d | 1 | 1.30mi |
| 1622 Carl St Saint Paul, MN | 1.0–2.0 | 1.0 | 828 | $1,270 | $1.53 | 43d | 4 | 1.30mi |
| 744 Polk St NE Minneapolis, MN | 1.0–2.0 | 1.0 | 800 | $1,599 | $2.00 | 4d | 2 | 1.31mi |
| 200 University Ave SE Minneapolis, MN | 3.0 | 1.0–3.0 | 1554 | $8,035 | $5.17 | 1d | 25 | 1.34mi |
| 20 6th St NE Minneapolis, MN | 2.0 | 1.0–2.0 | 858 | $2,936 | $3.42 | 1d | 9 | 1.36mi |
| 644 Van Buren St NE Unit 3 Minneapolis, MN | 2.0 | 1.0 | 1000 | $1,450 | $1.45 | 43d | 1 | 1.37mi |
| 1120 S 2nd St #213 Minneapolis, MN | 2.0 | 2.0 | 1532 | $3,895 | $2.54 | 14d | 1 | 1.38mi |
| 1811 Carl St Saint Paul, MN | 2.0 | 1.0 | 1450 | $2,150 | $1.48 | 17d | 1 | 1.41mi |
| 2520 S 8th St Minneapolis, MN | 2.0 | 1.0–2.0 | 721 | $2,457 | $3.41 | 1d | 9 | 1.42mi |
| 2520 S 8th St Minneapolis, MN | 2.0 | 1.0–2.0 | 721 | $2,445 | $3.39 | 17d | 11 | 1.42mi |
| 2015 Riverside Ave Minneapolis, MN | 1.0–2.0 | 1.0 | 886 | $1,720 | $1.94 | 1d | 9 | 1.44mi |
Listing history 12 events
-
2026-05-06$255,000 Active 948-char remark
-
2026-05-04historical $255,000 948-char remark
-
2007-09-20soldstatus $190,000
-
2007-08-24soldstatus $190,000 253-char remark
Show marketing remark (253 chars)
Walk to campus. U of M gem. New High Efficiency Furnace, A/C & Hot Water Heater. Well maintained, with hardwoods, Large, spacious rooms w/ potential for 3rd BR. in BSMT, privacy fence, Front porch, Almost 100% of time was owner occupied. Love it!
-
2007-07-29historical 253-char remark
Show marketing remark (253 chars)
Walk to campus. U of M gem. New High Efficiency Furnace, A/C & Hot Water Heater. Well maintained, with hardwoods, Large, spacious rooms w/ potential for 3rd BR. in BSMT, privacy fence, Front porch, Almost 100% of time was owner occupied. Love it!
-
2007-03-05$199,900 253-char remark
Show marketing remark (253 chars)
Walk to campus. U of M gem. New High Efficiency Furnace, A/C & Hot Water Heater. Well maintained, with hardwoods, Large, spacious rooms w/ potential for 3rd BR. in BSMT, privacy fence, Front porch, Almost 100% of time was owner occupied. Love it!
-
1999-06-15soldstatus $89,900
-
1996-08-16soldstatus $72,000
-
1996-01-19soldstatus $31,500
-
1996-01-19soldstatus $31,500
-
1995-12-17historical
-
1995-12-12$29,900
ⓘ Source: listings_history table (triggers on properties + properties_extension) + one-shot
backfill from property_details.listing_events for pre-trigger history.
Tax reassessment forecast MN · Partial reset (capped growth)
- Current annual tax
- $3,941 · $328/mo
- Projected year-2 tax
- $3,941 · $328/mo
- Expected delta
- $0/yr ($0/mo · 0.0%)
ⓘ Screening estimate from a state-policy table — verify with the county assessor before closing.
Climate risk First Street
- Flood 6/10 Major FEMA zone X (unshaded) · 67% chance over 30 yrs
- Wildfire 1/10 Low
- Heat 2/10 Low 7 d/yr ≥100°F today · 14 d/yr by 30 yrs out
- Wind 2/10 Low
- Air quality 2/10 Low 1 unhealthy d/yr today · 1 by 30 yrs out
Nearby sold comps map
Loading sold comps map…
Walkable amenities ~0.75 mi
Loading nearby amenities…
Taxation est. · year 1
- Rental income
- $25,047
- − Mortgage interest
- −$14,284
- − Property taxes
- −$3,941
- − Insurance
- −$1,275
- − Repairs & maintenance
- −$2,004
- − Management
- −$2,004
- − Depreciation
- −$7,418
- Taxable loss
- −$5,879
- Est. tax savings @ 24.0%
- +$1,411
- After-tax cash flow
- $-65/yr
For passive investors: Depreciation is non-cash, so a rental often shows a tax loss while cash-flowing — sheltering income. Rental losses are passive: they offset passive income freely, and up to $25,000/yr can offset ordinary (W-2) income if you actively participate and your MAGI is under $100k (phasing out to $0 by $150k); unused losses carry forward. On sale, claimed depreciation is recaptured at up to 25%, and gains may owe capital-gains tax (a 1031 exchange can defer both). Figures are a year-1 estimate at your 24.0% rate — not tax advice; consult a CPA.
Schools (NCES district)
- District
- Minneapolis Public School District
- NCES district ID
- 2721240
- Math proficiency
- 35% ▼ -7.00%
- Reading proficiency
- 46% ▼ -1.00%
- Median HH income
- $50,521
- Composite
- 34.92/100
- National rank
- #5067
- State rank
- #217 of 301 in MN
Livability — Minneapolis
- Score
- 78/100
- State rank
- #110
- US rank
- #2525
Category grades
Schools grade is shown separately in the Schools card above.
Census & demographics
- Census place
- Minneapolis, MN
- County
- Hennepin County · 1,150,272 people
- City population
- 417,555
- Metro
- Minneapolis-St. Paul-Bloomington, MN-WI
- Population (ZIP)
- 35,007
- Household income
- $51,966
- Rent vs Own
- Severe rent burden
- 3687.0
Population outlook (Hennepin County) Hauer SSP2
- Today (2025)
- 1,405,227 people
- By 2030
- 1,492,650 · +6.2%
- By 2040
- 1,660,157 · +18.1%
- By 2050
- 1,823,498 · +29.8%
- By 2075
- 2,221,283 · +58.1%
- By 2100
- 2,509,976 · +78.6%
Race, ethnicity, and origin ACS 2023
- Neighborhood character
- Predominantly White (66%)
- Race & ethnicity
- White 66% Asian 12% Two or more races 9% Black 8% Hispanic / Latino 8%
- Hispanic origin (detail)
- Mexican 4%
- Common ancestry
- Portuguese 8% Romanian 4% Lithuanian 2%
- Foreign-born
- 16% · China, Canada, South Korea
- Languages at home
- 79% English-only · Chinese 5% Spanish 3% Other Asian/Pacific 3%
Political lean MEDSL · Hennepin
- 2024 margin
- Solid D (+42.6) · D 70.2% · R 27.5% · Other 2.3%
- 2008→2024 swing
- +14.0pp toward D · 2008: 28.6pp · 2024: 42.6pp
- All cycles
- 2024: D+42.6 2020: D+43.2 2016: D+35.3 2012: D+27.1 2008: D+28.6
Not yet ingested
- Civics
- —
Market trends
- HPI YoY
- ▼ -130.69%
- Current HPI
- 202.7105
- Rent YoY
- ▲ 4.98%
- Metro
- Minneapolis-St. Paul-Bloomington, MN-WI
- State GDP YoY
- ▲ 2.41%
- F500 in state
- 34
Industry mix (Fortune 500 HQ in MN)
| Industry | F500 HQs | Revenue |
|---|---|---|
| Healthcare | 2 | $407B |
|
||
| Retail | 2 | $150B |
|
||
| Consumer Goods | 2 | $32B |
|
||
| Industrial Machinery | 2 | $6B |
|
||
| Agriculture | 1 | $40B |
|
||
| Healthcare / Medical Devices | 1 | $32B |
|
||
Price history
+752.8% since first listed14 events — show timeline
- 2026-05-29 Pending — NORTHSTARMLS as Distributed by MLS Grid
- 2026-05-26 Contingent — NORTHSTARMLS as Distributed by MLS Grid
- 2026-05-06 Listed $255,000 NORTHSTARMLS as Distributed by MLS Grid
- 2026-05-04 Coming Soon $255,000 NORTHSTARMLS as Distributed by MLS Grid
- 2007-09-20 Sold (Public Records) $190,000 Public Records
- 2007-08-24 Sold (MLS) $190,000 NORTHSTARMLS as Distributed by MLS Grid
- 2007-07-29 Listing Removed — NORTHSTARMLS as Distributed by MLS Grid
- 2007-03-05 Listed $199,900 NORTHSTARMLS as Distributed by MLS Grid
- 1999-06-15 Sold (Public Records) $89,900 Public Records
- 1996-08-16 Sold (Public Records) $72,000 Public Records
- 1996-01-19 Sold (Public Records) $31,500 Public Records
- 1996-01-19 Sold (MLS) $31,500 NORTHSTARMLS as Distributed by MLS Grid
- 1995-12-17 Listing Removed — NORTHSTARMLS as Distributed by MLS Grid
- 1995-12-12 Listed $29,900 NORTHSTARMLS as Distributed by MLS Grid
Property tax history
+3.0%/yrLatest (2025): $3,941 · +5.9% YoY. Source: county tax records.
Cash-flow waterfall
monthlySold comps — $/sqft
last 12 mo · ≤1 miLoading sold comps…