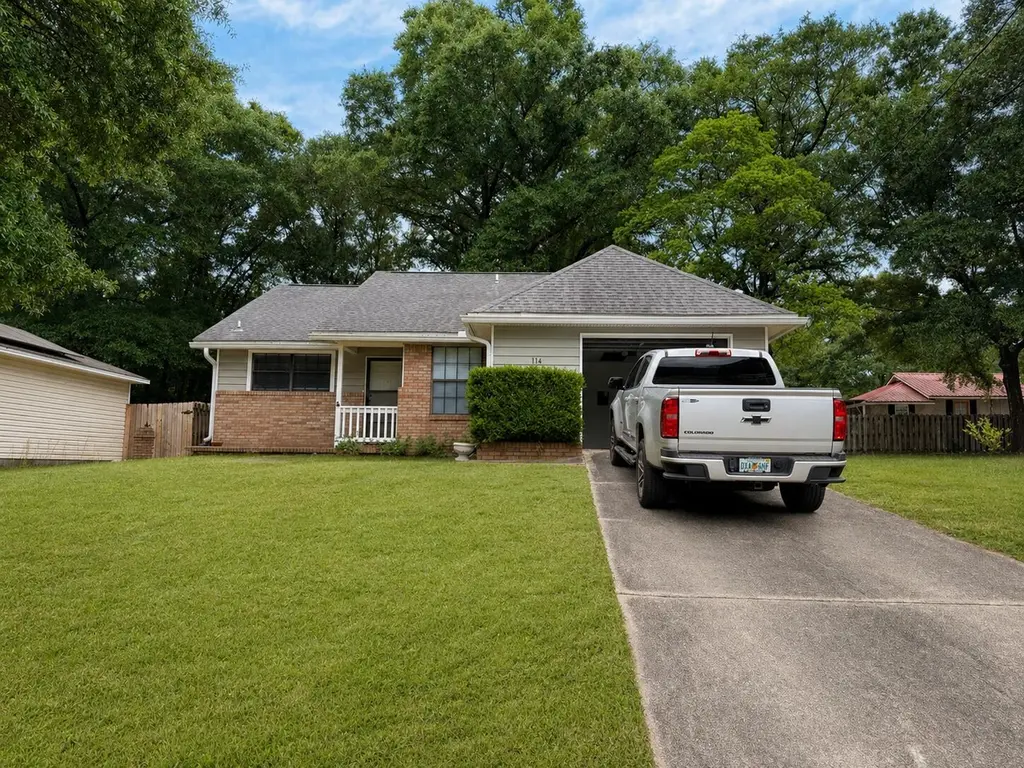
114 Fairoaks Dr · Crestview, FL
Flood risk 1/10 · Minimal
- FEMA flood zone
- X (unshaded)
- Chance of flooding over 30 yrs
- 0.0%
- Est. flood insurance / yr
- $507 – $1,088
Fire risk 4/10 · Minor
- Est. fire insurance / yr
- $947 – $1,759
Heat risk 8/10 · Major
- Hot days now (above 107°F)
- 7 days/yr
- Hot days in 30 yrs
- 20 days/yr
Wind risk 9/10 · Severe
- Chance of severe wind over 30 yrs
- 99.0%
Air-quality risk 2/10 · Minimal
- Unhealthy air days now
- 1 days/yr
- Unhealthy air days in 30 yrs
- 1 days/yr
Risk factors via First Street. Map © Google.
Why this score? — see what drove the D grade
The composite is a weighted blend of 9 inputs, each scored 0–100. Each bar is that input's sub-score; the figure is the points it added to the 100-point composite (weight × sub-score).
- Cash flow +13.2/30.0
- ARV discount +6.6/15.0
- Schools +5.2/10.0
- DSCR +4.0/10.0
- Livability +3.8/5.0
- Rent growth +2.5/5.0
- Condition / age +2.5/5.0
- 1% rule +2.4/10.0
- Appreciation +0.0/10.0
$214,800
🖨 Deal sheet (PDF) 📄 Offer letter ✓ Due diligence
Listing remarks
Well-maintained 3-bedroom, 2-bath residence with numerous recent updates contributing to overall condition and functionality. Major system improvements include a heat pump replacement, drain line servicing, and a new water heater installed in 2025. Interior enhancements feature updated flooring throughout, recently installed appliances, and updated bathrooms, supporting modern utility and overall appeal. Bathrooms and laundry room have been upgraded with herringbone tile, reflecting quality craftsmanship and design detail. Exterior improvements include added siding, contributing to durability and curb appeal. The home also includes a fireplace, providing an additional functional and aesthe
Key facts
- 4,791 sq ft lot
- Garage
- Built 1986
Property features AI
Finance
- HOA & community: Subdivision: FAIR OAKS
Exterior
- Parking: Attached garage
- Utilities: Electric service; Public sewer
- Home design: Traditional-style home; Single-story
- Construction: Built in 1986
- Exterior features: Rain gutters; Lot dimensions approximately 46 x 107 x 44 x 95; Lot about 0.11 acre; Zoned for single-family residential
Interior
- Kitchen: Kitchen located on the first floor
- Bedrooms: 3 bedrooms (all on the first floor)
- Flooring: Tile flooring; Vinyl flooring
- Bathrooms: 2 full bathrooms
- Heating & cooling: Ceiling fans; High-efficiency AC
- Interior features: Double pane windows
Neighborhood map
What this means for you Summary
Snapshot
- This is a 3-bed/2.0-bath single-family listed at $215k.
Deal economics
- At list price, monthly cash flow is $-2 ($-27/yr) — negative.
- To cash-flow at today's rent, offer at most $214k (0.2% below list).
- To meet the 1% rule (rent ≥ 1% of price), the offer needs to be $159k (26.2% below list).
- Recommended offer: $159k (26.2% below list) — sets the bar for 1% rule.
- Cap rate 6.3% vs local median 4.4% in Crestview — top-decile yield for the area; either an underpriced asset or a hidden risk that comps aren't pricing in. Stress-test before assuming the spread holds.
Location & tenants
- Location reads 75/100 on livability (#252 in FL, #3,858 nationally) — a middle-class / working-renter tenant base. Strengths: cost of living A+, housing A+, health & safety A+; Watch: employment D, amenities F, commute F.
- Okaloosa (other): math 60% / reading 60% proficiency, ranked #12 of 73 in FL (top 16%) — acceptable for families but not a draw, mixed tenant base, ~2y average lease.
- Zoned schools: Riverside Elementary School (math 57% / reading 58%, grade C+, #764 of 2,144 statewide, top 36%, 947 students, 58% FRL); Crestview High School (math 49% / reading 54%, grade D+, #167 of 667 statewide, top 25%, 2,315 students, 42% FRL).
- Market conditions: Rents flat; 526 active listings in the ZIP; 30 comparable units currently listed for rent nearby; rentals lingering (median 45d on market — plan ~5-8 weeks vacancy on turnover, expect pricing pressure); 67% of comp listings sitting > 30 days — soft ceiling on asking rent; 1,268 units permitted in Okaloosa County in 2024 (175 in 5+ unit buildings).
Forward outlook
- Local home prices are declining (-3.0%/yr); year-one equity from $1k of loan paydown is wiped out by about $6k of value loss. Plan a longer hold.
- Okaloosa County population projected at +37% by 2050 — long-run rental-demand tailwind backs the buy-and-hold thesis.
Negotiation context
- Only 1 days on market — expect competitive offers; lowballing is unlikely to land.
- Current owner paid $120k; list at $215k implies a 79% gain — meaningful room to come down on a strong offer.
Risks & watch-outs
- Climate carrying-cost: severe wind risk, 99% chance of damaging wind over 30y; extreme-heat days projected 7→20/yr by 2055 (HVAC capex compounding) — expect insurance premiums to compound above CPI over the hold.
Questions for the listing agent
- What do current leases actually rent for vs. the listed asking? Can we see a recent rent roll and the last 12 months of T-12 income?
- Is there a deadline driving the sale (1031 exchange, divorce, estate, relocation)? That informs how much negotiation room exists.
- Schools are B-rated — typically a magnet for longer-tenancy family renters. What's the average tenant stay here, and is there a school-zone premium baked into asking?
- The area grade is low — what's the realistic commute time and amenity access for the typical tenant pool here? Any planned neighborhood developments (good or bad) we should know about?
- What's the average days-on-market for RENTAL listings here right now (not sales)? A rising rental-DOM trend means longer vacancies and softer asking-rent achievability than the comps imply.
- What's the recent tenant-quality profile in this submarket — average credit score on applications, eviction rate, late-payment / NSF rate, and stable-employment percentage? A property-management company in the area should have these aggregated.
- How much new for-sale + rental construction is in the pipeline within 1–3 miles? Heavy new supply typically softens prices + rents 12–24 months out; constrained supply supports both.
Investment metrics
- 1% rule
- 0.74% ✗
- Cap rate
- 6.28%
- Cash-on-cash
- -0.05%
- DSCR
- 1.00
- GRM
- 11.3
CMA / ARV
- ARV (on-the-fly)
- $210,563
- Comps found
- 12
Show comp detail 12 sales within ~0.75 mi
| Address | Dist | Beds/Ba | Sqft | Sold | Price | $/sf | Match |
|---|---|---|---|---|---|---|---|
| 114 Fairoaks Dr | 0.00mi | 3/2.0 | 1,091 (0%) | 0mo | $214,800 | $197 | 100 |
| 503 Tall Pines St | 0.12mi | 3/2.0 | 1,070 (-2%) | 3mo | $150,000 | $140 | 89 |
| 695 E Bowers Ave | 0.09mi | 3/2.0 | 1,150 (+5%) | 7mo | $250,000 | $217 | 81 |
| 212 Aza Pl | 0.49mi | 3/1.5 | 1,100 (+1%) | 4mo | $206,000 | $187 | 70 |
| 873 S Brett St | 0.43mi | 3/2.0 | 1,150 (+5%) | 3mo | $259,000 | $225 | 69 |
| 552 Reed Ave | 0.37mi | 3/1.0 | 960 (-12%) | 1mo | $79,900 | $83 | 58 |
| 703 Brock Ave | 0.68mi | 3/1.0 | 1,121 (+3%) | 4mo | $145,000 | $129 | 56 |
| 502 Lee Ave | 0.54mi | 3/2.0 | 1,187 (+9%) | 8mo | $229,000 | $193 | 53 |
| 591 Brock Ave | 0.64mi | 3/2.0 | 1,187 (+9%) | 5mo | $199,999 | $168 | 51 |
| 593 Brock Ave | 0.64mi | 3/2.0 | 1,187 (+9%) | 5mo | $199,900 | $168 | 51 |
| 520 E Williams Ave | 0.75mi | 3/2.0 | 1,024 (-6%) | 8mo | $199,900 | $195 | 48 |
| 521 Brock East Ave | 0.64mi | 3/2.0 | 1,219 (+12%) | 7mo | $249,900 | $205 | 45 |
Match score weights: distance 35% · size 25% · config 20% · recency 20%. Top-matched comps best support the ARV.
Projected returns pro-forma
-3.0% appreciation · 0.12% rent growth · sell at horizon
- IRR
- -19.2%
- Equity multiple
- 0.34×
- Total profit
- $-39,537
- Equity at exit
- $32,027
- IRR
- -18.0%
- Equity multiple
- 0.13×
- Total profit
- $-52,397
- Equity at exit
- $18,572
Cash invested: $60,144 (down + closing). Projections, not guarantees.
Landlord ↔ Tenant lean methodology
- Overall (STATE)
- 87 Strongly Landlord-Friendly
- State Florida
- 87 Strongly Landlord-Friendly · R+3
- County
- — inherits STATE
- City
- — inherits STATE
ZIP-level market 32539
- Home prices YoY
- -17.8%
- Rents YoY
- 0.1%
- Active inventory
- 526
- Price-to-rent
- 11.3×
Monthly cashflow live
- Estimated rent
- $1,586 high interval (Pro) →
- Mortgage (P&I)
- −$1,126
- Tax from tax record
- −$39 /mo · $474/yr
- Insurance
- −$90
- HOA
- −$0
- Vacancy / Maint / Mgmt
- −$333
- Net cashflow
- $-2
Break-even live
Sensitivity live
| Price | -10% $119 | -5% $59 | +0% $-2 | +5% $-63 | +10% $-124 |
|---|---|---|---|---|---|
| Rent | -10% $-128 | -5% $-65 | +0% $-2 | +5% $60 | +10% $123 |
| Rate | -1.0pp $106 | -0.5pp $52 | base $-2 | +0.5pp $-58 | +1.0pp $-115 |
UW: 25.0% down · 7.5% · 30yr · 1.5% tax · 5.0% vac · 8.0% maint · 8.0% mgmt
Financing live
Cash to close
- Down payment
- $53,700
- Closing costs
- $6,444
- Reserves months
- —
- Total cash needed
- —
Loan-product check · same deal, 3 products live
Conventional
25% down · 7.5% · 30yr
- Down + closing
- —
- Monthly P&I
- —
- Monthly cashflow
- —
- DSCR
- —
- Eligible?
- —
Personal DTI + credit; lowest rate.
DSCR
20% down · 8.5% · 30yr
- Down + closing
- —
- Monthly P&I
- —
- Monthly cashflow
- —
- DSCR
- —
- Eligible?
- —
No personal income docs; deal must DSCR.
Hard money
10% down · 12.0% · 12mo
- Down + closing
- —
- Monthly P&I
- —
- Monthly cashflow
- —
- DSCR
- —
- Eligible?
- —
Short-term bridge; refi at stabilization.
Rent comps 30 comps
| Address | Beds | Baths | Sqft | Rent | $/sqft | DOM | Units | Dist |
|---|---|---|---|---|---|---|---|---|
| 812 Carlton St Crestview, FL | 3.0 | 2.5 | 1393 | $1,495 | $1.07 | 22d | 1 | 0.33mi |
| 812 E Edney Ave Crestview, FL | 2.0 | 2.0 | 1024 | $1,400 | $1.37 | 22d | 1 | 0.66mi |
| 812 E Edney Ave Crestview, FL | 2.0 | 2.0 | 1024 | $1,400 | $1.37 | 45d | 1 | 0.66mi |
| 107 Hampton Dr Crestview, FL | 2.0 | 1.5 | 972 | $1,300 | $1.34 | 22d | 1 | 0.68mi |
| 122 Hampton Dr Unit 1 Crestview, FL | 2.0 | 2.0 | 1080 | $1,195 | $1.11 | 45d | 1 | 0.69mi |
| 122 Hampton Dr Crestview, FL | 2.0 | 1.5 | 1080 | $1,195 | $1.11 | 45d | 1 | 0.69mi |
| 124 Hampton Dr Crestview, FL | 2.0 | 1.5 | 952 | $1,195 | $1.26 | 22d | 1 | 0.69mi |
| 124 Hampton Dr Unit 1 Crestview, FL | 2.0 | 1.5 | 952 | $1,195 | $1.26 | 45d | 1 | 0.69mi |
| 408 Church St Crestview, FL | 2.0 | 2.0 | 1086 | $1,200 | $1.10 | 45d | 1 | 0.74mi |
| 401 S Booker St Crestview, FL | 3.0 | 1.5 | 1040 | $1,225 | $1.18 | 45d | 1 | 0.80mi |
| 503 W Griffith Ave Crestview, FL | 3.0 | 1.0 | 962 | $1,395 | $1.45 | 45d | 1 | 0.83mi |
| 398 N Spring St Crestview, FL | 2.0 | 1.0 | 1200 | $1,300 | $1.08 | 45d | 1 | 0.85mi |
| 326 Dixie St Crestview, FL | 3.0 | 1.0 | 1386 | $1,400 | $1.01 | 45d | 1 | 0.98mi |
| 502 Hyde Park Dr Crestview, FL | 3.0 | 2.0 | 1302 | $1,795 | $1.38 | 15d | 1 | 1.02mi |
| 816 W Walnut Ave Crestview, FL | 3.0 | 2.0 | 1297 | $1,595 | $1.23 | 45d | 1 | 1.04mi |
| 815 Valley Rd Crestview, FL | 3.0 | 2.5 | 1373 | $1,550 | $1.13 | 45d | 1 | 1.05mi |
| 475 Aplin Rd Crestview, FL | 1.0–2.0 | 1.0–2.0 | 764 | $999 | $1.31 | 45d | 5 | 1.07mi |
| 204 Johnson Ct Crestview, FL | 3.0 | 2.5 | 1496 | $1,450 | $0.97 | 45d | 1 | 1.08mi |
| 202 Johnson Ct Crestview, FL | 3.0 | 2.5 | 1496 | $1,450 | $0.97 | 45d | 1 | 1.08mi |
| 223 Johnson Ct #223 Crestview, FL | 3.0 | 2.5 | 1496 | $1,450 | $0.97 | 45d | 1 | 1.09mi |
| 498 North Ave E Unit A Crestview, FL | 2.0 | 2.0 | 1081 | $1,450 | $1.34 | 45d | 1 | 1.14mi |
| 14 Flora Cv Crestview, FL | 3.0 | 2.0 | 1357 | $1,750 | $1.29 | 22d | 1 | 1.14mi |
| 720 Arbor Lake Dr Crestview, FL | 2.0 | 2.5 | 1100 | $1,375 | $1.25 | 22d | 1 | 1.30mi |
| 720 Arbor Lake Dr Crestview, FL | 2.0 | 2.5 | 1100 | $1,400 | $1.27 | 45d | 1 | 1.30mi |
| 2942 Sholtz Ave Crestview, FL | 3.0 | 2.0 | 1266 | $1,600 | $1.26 | 45d | 1 | 1.32mi |
| 830 Arbor Lake Dr Crestview, FL | 2.0 | 2.5 | 1200 | $1,400 | $1.17 | 15d | 1 | 1.33mi |
| 178 Cabana Way Crestview, FL | 4.0 | 2.0 | 1284 | $1,800 | $1.40 | 45d | 1 | 1.38mi |
| 132 Cabana Way Crestview, FL | 3.0 | 2.0 | 1408 | $1,750 | $1.24 | 15d | 1 | 1.43mi |
| 168 Cabana Way Crestview, FL | 3.0 | 2.0 | 1100 | $1,700 | $1.55 | 22d | 1 | 1.44mi |
| 3016 Aplin Rd Crestview, FL | 3.0 | 2.0 | 1280 | $1,400 | $1.09 | 45d | 1 | 1.44mi |
Listing history 3 events
-
2026-04-29status Pending
-
2026-04-28$214,800 Active
-
2005-09-23soldstatus $120,000
ⓘ Source: listings_history table (triggers on properties + properties_extension) + one-shot
backfill from property_details.listing_events for pre-trigger history.
Tax reassessment forecast FL · Resets to sale price
- Current annual tax
- $474 · $39/mo
- Projected year-2 tax
- $1,783 · $149/mo
- Expected delta
- +$1,309/yr (+$109/mo · 276.4%)
ⓘ Screening estimate from a state-policy table — verify with the county assessor before closing.
Climate risk First Street
- Flood 1/10 Low FEMA zone X (unshaded) · 0% chance over 30 yrs
- Wildfire 4/10 Moderate
- Heat 8/10 Severe 7 d/yr ≥107°F today · 20 d/yr by 30 yrs out
- Wind 9/10 Extreme 99% chance of damaging wind over 30 yrs
- Air quality 2/10 Low 1 unhealthy d/yr today · 1 by 30 yrs out
Nearby sold comps map
Loading sold comps map…
Walkable amenities ~0.75 mi
Loading nearby amenities…
Taxation est. · year 1
- Rental income
- $19,035
- − Mortgage interest
- −$12,032
- − Property taxes
- −$474
- − Insurance
- −$1,074
- − Repairs & maintenance
- −$1,523
- − Management
- −$1,523
- − Depreciation
- −$6,249
- Taxable loss
- −$3,839
- Est. tax savings @ 24.0%
- +$921
- After-tax cash flow
- $894/yr
For passive investors: Depreciation is non-cash, so a rental often shows a tax loss while cash-flowing — sheltering income. Rental losses are passive: they offset passive income freely, and up to $25,000/yr can offset ordinary (W-2) income if you actively participate and your MAGI is under $100k (phasing out to $0 by $150k); unused losses carry forward. On sale, claimed depreciation is recaptured at up to 25%, and gains may owe capital-gains tax (a 1031 exchange can defer both). Figures are a year-1 estimate at your 24.0% rate — not tax advice; consult a CPA.
Schools (NCES district)
- District
- Okaloosa
- NCES district ID
- 1201380
- Math proficiency
- 60% ▼ -12.00%
- Reading proficiency
- 60% ▼ -4.00%
- Median HH income
- $55,601
- Composite
- 51.62/100
- National rank
- #1705
- State rank
- #12 of 73 in FL
Livability — Crestview
- Score
- 75/100
- State rank
- #252
- US rank
- #3858
Category grades
Schools grade is shown separately in the Schools card above.
Census & demographics
- Census place
- Crestview, FL
- County
- Okaloosa County · 194,352 people
- City population
- 58,889
- Metro
- Crestview-Fort Walton Beach-Destin, FL
- Population (ZIP)
- 33,290
- Household income
- $74,369
- Rent vs Own
- Severe rent burden
- 371.0
Population outlook (Okaloosa County) Hauer SSP2
- Today (2025)
- 235,133 people
- By 2030
- 253,483 · +7.8%
- By 2040
- 289,537 · +23.1%
- By 2050
- 322,954 · +37.3%
- By 2075
- 399,624 · +70.0%
- By 2100
- 425,311 · +80.9%
Race, ethnicity, and origin ACS 2023
- Neighborhood character
- Predominantly White (73%)
- Race & ethnicity
- White 73% Black 12% Two or more races 8% Hispanic / Latino 7% Asian 1%
- Hispanic origin (detail)
- Mexican 3% Puerto Rican 2%
- Common ancestry
- Lithuanian 4% Iranian 2% Romanian 2%
- Foreign-born
- 3% · Canada
- Languages at home
- 94% English-only · Spanish 3% Russian/Polish/Slavic 1% Other Asian/Pacific 1%
Political lean MEDSL · Okaloosa
- 2024 margin
- Solid R (+42.4) · D 28.2% · R 70.7% · Other 1.1%
- 2008→2024 swing
- +2.5pp toward D · 2008: -44.9pp · 2024: -42.4pp
- All cycles
- 2024: R+42.4 2020: R+39.1 2016: R+47.8 2012: R+49.4 2008: R+44.9
Not yet ingested
- Civics
- —
Market trends
- HPI YoY
- ▼ -56.52%
- Current HPI
- 261.1557
- Rent YoY
- ▲ 0.12%
- Metro
- Crestview-Fort Walton Beach-Destin, FL
- State GDP YoY
- ▲ 3.28%
- F500 in state
- 36
Industry mix (Fortune 500 HQ in FL)
| Industry | F500 HQs | Revenue |
|---|---|---|
| Industrial Technology | 2 | $29B |
|
||
| Insurance | 2 | $17B |
|
||
| Retail | 1 | $60B |
|
||
| Technology Distribution | 1 | $58B |
|
||
| Homebuilding | 1 | $35B |
|
||
| Technology Manufacturing | 1 | $35B |
|
||
Price history
+79.0% since first listed3 events — show timeline
- 2026-04-29 Pending — ECAR
- 2026-04-28 Listed $214,800 ECAR
- 2005-09-23 Sold (Public Records) $120,000 Public Records
Property tax history
-1.2%/yrLatest (2025): $474 · +1.5% YoY. Source: county tax records.
Cash-flow waterfall
monthlySold comps — $/sqft
last 12 mo · ≤1 miLoading sold comps…