100 Walnuttown Rd · Walnuttown, PA
Flood risk 10/10 · Severe
- FEMA flood zone
- X (unshaded)
- Chance of flooding over 30 yrs
- 0.99%
- Est. flood insurance / yr
- $473 – $860
Fire risk 4/10 · Minor
- Est. fire insurance / yr
- $511 – $949
Heat risk 4/10 · Minor
- Hot days now (above 99°F)
- 6 days/yr
- Hot days in 30 yrs
- 13 days/yr
Wind risk 4/10 · Minor
- Chance of severe wind over 30 yrs
- 15.0%
Air-quality risk 2/10 · Minimal
- Unhealthy air days now
- 1 days/yr
- Unhealthy air days in 30 yrs
- 2 days/yr
Risk factors via First Street. Map © Google.
Why this score? — see what drove the C+ grade
The composite is a weighted blend of 9 inputs, each scored 0–100. Each bar is that input's sub-score; the figure is the points it added to the 100-point composite (weight × sub-score).
- Cash flow +26.8/30.0
- DSCR +9.2/10.0
- ARV discount +7.5/15.0
- 1% rule +7.2/10.0
- Schools +4.2/10.0
- Livability +3.3/5.0
- Rent growth +2.5/5.0
- Condition / age +1.0/5.0
- Appreciation +0.0/10.0
$155,000
🖨 Deal sheet (PDF) 📄 Offer letter ✓ Due diligence
Listing remarks
Claim your own private slice of the Fleetwood School District. This property offers great potential for the right buyer—bring your vision and add some sweat equity to transform it into a standout home. The opportunity is here for those ready to make it their own.
Key facts
- 1.45 acre lot
- Garage
- Built 1760
Property features AI
Finance
- Financial info: Fee simple ownership; Property listed as needing major rehabilitation
Exterior
- Parking: Front-entry detached garage (1 garage space); Driveway with approximately 5 parking spaces; Total of about 6 garage/parking spaces
- Utilities: On-site septic system; Well water
- Home design: Detached property; Frame construction
- Construction: Frame construction with brick/mortar foundation; Above-grade and below-grade structures
- Exterior features: Detached structure; Not in a federal flood zone; Tidal water not present
Interior
- Bedrooms: Three bedrooms on the main level
- Bathrooms: One full bathroom (main level)
- Heating & cooling: Hot water heating; Oil heating fuel; Electric hot water
- Interior features: One fireplace; Unfinished basement
Neighborhood map
What this means for you Summary
Snapshot
- This is a 3-bed/1.0-bath single-family listed at $155k. Condition is rated poor.
Deal economics
- At list price, monthly cash flow is $368 ($4k/yr) — positive.
- The deal already cash-flows at list — no discount required.
- Meets the 1% rule at list price ($2k rent vs $155k).
- Recommended offer: $153k (1.5% below list) — sets the bar for market timing.
Location & tenants
- Location reads 66/100 on livability (#1,040 in PA) — a middle-class / working-renter tenant base. Strengths: cost of living A+, housing A+, health & safety B; Watch: amenities F, commute F.
- Oley Valley SD (rural): math 37% / reading 58% proficiency, ranked #186 of 539 in PA (top 34%) — families likely to look elsewhere, expect single-tenant / working-renter base with shorter leases; only 19% free/reduced lunch — higher-income household profile.
- Zoned schools: Oley Valley El Sch (math 35% / reading 58%, grade D-, #793 of 1,518 statewide, top 52%, 612 students, 36% FRL); Oley Valley Ms (math 29% / reading 59%, grade D, #202 of 512 statewide, top 40%, 357 students, 34% FRL); Oley Valley Shs (math 72% / reading 24%, grade D, #153 of 437 statewide, top 37%, 504 students, 27% FRL).
- Market conditions: 68 active listings in the ZIP; 258 units permitted in Berks County in 2024 (27 in 5+ unit buildings).
Forward outlook
- Local home prices are declining (-3.0%/yr); year-one equity from $1k of loan paydown is wiped out by about $5k of value loss. Plan a longer hold.
- Berks County population projected at +3% by 2050 — modest demand growth; plan on rents tracking national, not racing it.
Negotiation context
- It's been on market 15 days — a 2% lower offer ($153k) is reasonable based on typical stale-listing flexibility.
- 4 sale attempts; this cycle's ask has dropped $40k (21%) from the opening price — seller is motivated, your offer sets the floor, not the list.
Risks & watch-outs
- Watch-outs: flood insurance adds $56/mo; built in 1760 — expect roof / HVAC / electrical / plumbing capex.
- Climate carrying-cost: severe flood risk — expect insurance premiums to compound above CPI over the hold.
Questions for the listing agent
- Have any recent inspections been done? Can we get a copy of the seller's disclosures and any deferred-maintenance estimates?
- Built in 1760 — when were the roof, HVAC, electrical panel, plumbing, and water heater last replaced?
- What's the actual annual flood-insurance premium (NFIP or private), and is the property in a SFHA with mandatory coverage?
- Is there a deadline driving the sale (1031 exchange, divorce, estate, relocation)? That informs how much negotiation room exists.
- Schools are F-rated, which usually means shorter tenancies and higher turnover. Who's the typical renter profile here, and what's been the actual vacancy rate?
- What's the average days-on-market for RENTAL listings here right now (not sales)? A rising rental-DOM trend means longer vacancies and softer asking-rent achievability than the comps imply.
- What's the recent tenant-quality profile in this submarket — average credit score on applications, eviction rate, late-payment / NSF rate, and stable-employment percentage? A property-management company in the area should have these aggregated.
- How much new for-sale + rental construction is in the pipeline within 1–3 miles? Heavy new supply typically softens prices + rents 12–24 months out; constrained supply supports both.
Investment metrics
- 1% rule
- 1.22% ✓
- Cap rate
- 9.57%
- Cash-on-cash
- 11.71%
- DSCR
- 1.52
- GRM
- 6.8
CMA / ARV
- ARV (median comp)
- $336,086
- List price
- $155,000
- Delta
- -53.88%
- Verdict
- UNDERPRICED
- Comps
- 19 within 1.0 mi
Show comp detail 3 sales within ~0.75 mi
| Address | Dist | Beds/Ba | Sqft | Sold | Price | $/sf | Match |
|---|---|---|---|---|---|---|---|
| 895 Pleasant Hill Rd | 0.54mi | 3/1.0 | 2,157 (+7%) | 2mo | $180,000 | $83 | 63 |
| 690 Barlet Rd | 0.50mi | 3/1.0 | 1,892 (-6%) | 12mo | $600,000 | $317 | 56 |
| 27 Timothy Dr | 0.64mi | 3/1.0 | 1,729 (-14%) | 16mo | $275,000 | $159 | 32 |
Match score weights: distance 35% · size 25% · config 20% · recency 20%. Top-matched comps best support the ARV.
Projected returns pro-forma
-3.0% appreciation · 3.0% rent growth · sell at horizon
- IRR
- -1.0%
- Equity multiple
- 0.96×
- Total profit
- $-1,611
- Equity at exit
- $23,111
- IRR
- 8.7%
- Equity multiple
- 1.67×
- Total profit
- $29,038
- Equity at exit
- $13,402
Cash invested: $43,400 (down + closing). Projections, not guarantees.
Landlord ↔ Tenant lean methodology
- Overall (STATE)
- 62 Landlord-Friendly
- State Pennsylvania
- 62 Landlord-Friendly · EVEN
- County
- — inherits STATE
- City
- — inherits STATE
ZIP-level market 19522
- Home prices YoY
- -19.9%
- Active inventory
- 68
- Price-to-rent
- 6.8×
Monthly cashflow live
- Estimated rent
- $1,892 medium interval (Pro) →
- Mortgage (P&I)
- −$813
- Tax est. 1.5%
- −$194 /mo · $2,325/yr
- Insurance
- −$65
- Flood insurance flood zone
- −$56 /mo · $666/yr
- HOA
- −$0
- Vacancy / Maint / Mgmt
- −$397
- Net cashflow
- $368
Break-even live
Sensitivity live
| Price | -10% $475 | -5% $422 | +0% $368 | +5% $315 | +10% $261 |
|---|---|---|---|---|---|
| Rent | -10% $219 | -5% $293 | +0% $368 | +5% $443 | +10% $518 |
| Rate | -1.0pp $446 | -0.5pp $407 | base $368 | +0.5pp $328 | +1.0pp $287 |
UW: 25.0% down · 7.5% · 30yr · 1.5% tax · 5.0% vac · 8.0% maint · 8.0% mgmt
Financing live
Cash to close
- Down payment
- $38,750
- Closing costs
- $4,650
- Reserves months
- —
- Total cash needed
- —
Loan-product check · same deal, 3 products live
Conventional
25% down · 7.5% · 30yr
- Down + closing
- —
- Monthly P&I
- —
- Monthly cashflow
- —
- DSCR
- —
- Eligible?
- —
Personal DTI + credit; lowest rate.
DSCR
20% down · 8.5% · 30yr
- Down + closing
- —
- Monthly P&I
- —
- Monthly cashflow
- —
- DSCR
- —
- Eligible?
- —
No personal income docs; deal must DSCR.
Hard money
10% down · 12.0% · 12mo
- Down + closing
- —
- Monthly P&I
- —
- Monthly cashflow
- —
- DSCR
- —
- Eligible?
- —
Short-term bridge; refi at stabilization.
Listing history 8 events
-
2026-05-30statusdays on market $155,000 Pending 15 DOM
-
2026-05-12historical
-
2026-05-03$195,500 Active
-
2025-11-04historical
-
2025-10-29price $135,000
-
2025-10-11status Active
-
2025-10-10historical
-
2025-09-30$149,900 Active
ⓘ Source: listings_history table (triggers on properties + properties_extension) + one-shot
backfill from property_details.listing_events for pre-trigger history.
Climate risk First Street
- Flood 10/10 Extreme FEMA zone X (unshaded) · 99% chance over 30 yrs
- Wildfire 4/10 Moderate
- Heat 4/10 Moderate 6 d/yr ≥99°F today · 13 d/yr by 30 yrs out
- Wind 4/10 Moderate 15% chance of damaging wind over 30 yrs
- Air quality 2/10 Low 1 unhealthy d/yr today · 2 by 30 yrs out
Nearby sold comps map
Loading sold comps map…
Walkable amenities ~0.75 mi
Loading nearby amenities…
Taxation est. · year 1
- Rental income
- $22,706
- − Mortgage interest
- −$8,682
- − Property taxes
- −$2,325
- − Insurance
- −$1,442
- − Repairs & maintenance
- −$1,816
- − Management
- −$1,816
- − Depreciation
- −$4,509
- Taxable income
- $2,115
- Est. tax owed @ 24.0%
- −$508
- After-tax cash flow
- $3,909/yr
For passive investors: Depreciation is non-cash, so a rental often shows a tax loss while cash-flowing — sheltering income. Rental losses are passive: they offset passive income freely, and up to $25,000/yr can offset ordinary (W-2) income if you actively participate and your MAGI is under $100k (phasing out to $0 by $150k); unused losses carry forward. On sale, claimed depreciation is recaptured at up to 25%, and gains may owe capital-gains tax (a 1031 exchange can defer both). Figures are a year-1 estimate at your 24.0% rate — not tax advice; consult a CPA.
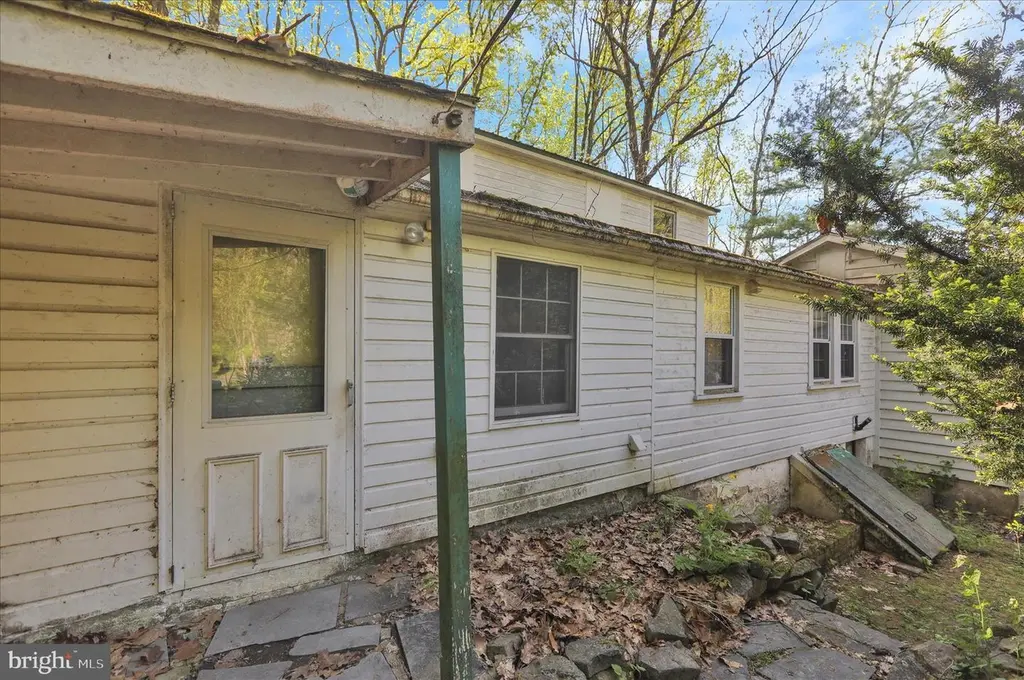
Condition & rehab AI · 1 photo
This property requires extensive renovation and exterior repairs to become move-in ready. Significant improvements in exterior and interior will greatly enhance its value.
Repairs flagged
- Major siding — Severe weathering and damage
- Major roof — Exposed rafters and missing shingles
- Major porch — Structural issues
- Major landscaping — Overgrown vegetation and debris
Value-add opportunities
- Both exterior renovation — Improves curb appeal and functionality
- Both HVAC upgrade — Enhances comfort and energy efficiency
- Both painting — Fresh paint improves aesthetics and value
- Both windows — New windows improve energy efficiency and view
Renovation cost estimate screening
| Repair item | Severity | Est. cost |
|---|---|---|
| siding · Severe weathering and damage | Major | $15,000–50,000 |
| roof · Exposed rafters and missing shingles | Major | $15,000–50,000 |
| porch · Structural issues | Major | $15,000–50,000 |
| landscaping · Overgrown vegetation and debris | Major | $15,000–50,000 |
| Total estimated repair cost · 4 items | $60,000–200,000 |
Value-add ROI direction
- Both exterior renovation — Improves curb appeal and functionality ↑
- Both HVAC upgrade — Enhances comfort and energy efficiency ↑
- Both painting — Fresh paint improves aesthetics and value ↑
- Both windows — New windows improve energy efficiency and view ↑
ⓘ Cost ranges are severity-bucket heuristics (US national rule-of-thumb). Get contractor quotes + a written scope before underwriting a rehab budget.
Schools (NCES district)
- District
- Oley Valley SD
- NCES district ID
- 4218150
- Math proficiency
- 37% ▼ -18.00%
- Reading proficiency
- 58% ▼ -10.00%
- Median HH income
- $68,937
- Composite
- 42.44/100
- National rank
- #3225
- State rank
- #186 of 539 in PA
Livability — Walnuttown
- Score
- 66/100
- State rank
- #1040
- US rank
- #11595
Category grades
Schools grade is shown separately in the Schools card above.
Census & demographics
- Population (ZIP)
- 13,926
Population outlook (Berks County) Hauer SSP2
- Today (2025)
- 425,767 people
- By 2030
- 428,814 · +0.7%
- By 2040
- 433,463 · +1.8%
- By 2050
- 439,426 · +3.2%
- By 2075
- 478,647 · +12.4%
- By 2100
- 518,507 · +21.8%
Race, ethnicity, and origin ACS 2023
- Neighborhood character
- Predominantly White (91%)
- Race & ethnicity
- White 91% Hispanic / Latino 7% Two or more races 4% Black 1%
- Hispanic origin (detail)
- Mexican 3% Puerto Rican 1% Dominican 1%
- Common ancestry
- Polish 5% Romanian 5% Slovak 2%
- Foreign-born
- 4% · Canada
- Languages at home
- 93% English-only · Spanish 3% German/W. Germanic 3% Russian/Polish/Slavic 1%
Political lean MEDSL · Berks
- 2024 margin
- R (+12.2) · D 43.4% · R 55.6%
- 2008→2024 swing
- -21.4pp toward R · 2008: 9.2pp · 2024: -12.2pp
- All cycles
- 2024: R+12.2 2020: R+8.2 2016: R+10.2 2012: R+0.6 2008: D+9.2
Not yet ingested
- Civics
- —
Market trends
- HPI YoY
- ▼ -67.19%
- Current HPI
- 270.0276
- Rent YoY
- —
- Metro
- —
- State GDP YoY
- ▲ 1.68%
- F500 in state
- 34
Industry mix (Fortune 500 HQ in PA)
| Industry | F500 HQs | Revenue |
|---|---|---|
| Healthcare | 2 | $309B |
|
||
| Insurance | 2 | $27B |
|
||
| Telecommunications / Media | 1 | $124B |
|
||
| Industrial Distribution | 1 | $22B |
|
||
| Financial Services | 1 | $20B |
|
||
| Chemicals / Materials | 1 | $18B |
|
||
Price history
+3.4% since first listed11 events — show timeline
- 2026-05-29 Pending — BRIGHT MLS
- 2026-05-28 Listing Removed — BRIGHT MLS
- 2026-05-22 Price Changed $155,000 BRIGHT MLS
- 2026-05-22 Relisted — BRIGHT MLS
- 2026-05-12 Listing Removed — BRIGHT MLS
- 2026-05-03 Listed $195,500 BRIGHT MLS
- 2025-11-04 Listing Removed — BRIGHT MLS
- 2025-10-29 Price Changed $135,000 BRIGHT MLS
- 2025-10-11 Relisted — BRIGHT MLS
- 2025-10-10 Listing Removed — BRIGHT MLS
- 2025-09-30 Listed $149,900 BRIGHT MLS
Cash-flow waterfall
monthlySold comps — $/sqft
last 12 mo · ≤1 miLoading sold comps…