 🌊 Lakefront
316 Court House Ln · Burrillville, RI
Flood risk 1/10 · Minimal
- FEMA flood zone
- X (unshaded)
- Chance of flooding over 30 yrs
- 0.0%
- Est. flood insurance / yr
- $473 – $860
Fire risk 3/10 · Minor
- Est. fire insurance / yr
- $835 – $1,551
Heat risk 4/10 · Minor
- Hot days now (above 94°F)
- 7 days/yr
- Hot days in 30 yrs
- 15 days/yr
Wind risk 6/10 · Moderate
- Chance of severe wind over 30 yrs
- 64.0%
Air-quality risk 2/10 · Minimal
- Unhealthy air days now
- 2 days/yr
- Unhealthy air days in 30 yrs
- 2 days/yr
Risk factors via First Street. Map © Google.
Why this score? — see what drove the F grade
The composite is a weighted blend of 9 inputs, each scored 0–100. Each bar is that input's sub-score; the figure is the points it added to the 100-point composite (weight × sub-score).
- ARV discount +10.2/15.0
- Appreciation +10.0/10.0
- Rent growth +2.5/5.0
- Livability +2.5/5.0
- Condition / age +2.5/5.0
- Cash flow +2.1/30.0
- Schools +2.1/10.0
- 1% rule +0.0/10.0
- DSCR +0.0/10.0
$550,000
🖨 Deal sheet 📄 Offer letter ✓ Due diligence
Listing remarks MLS
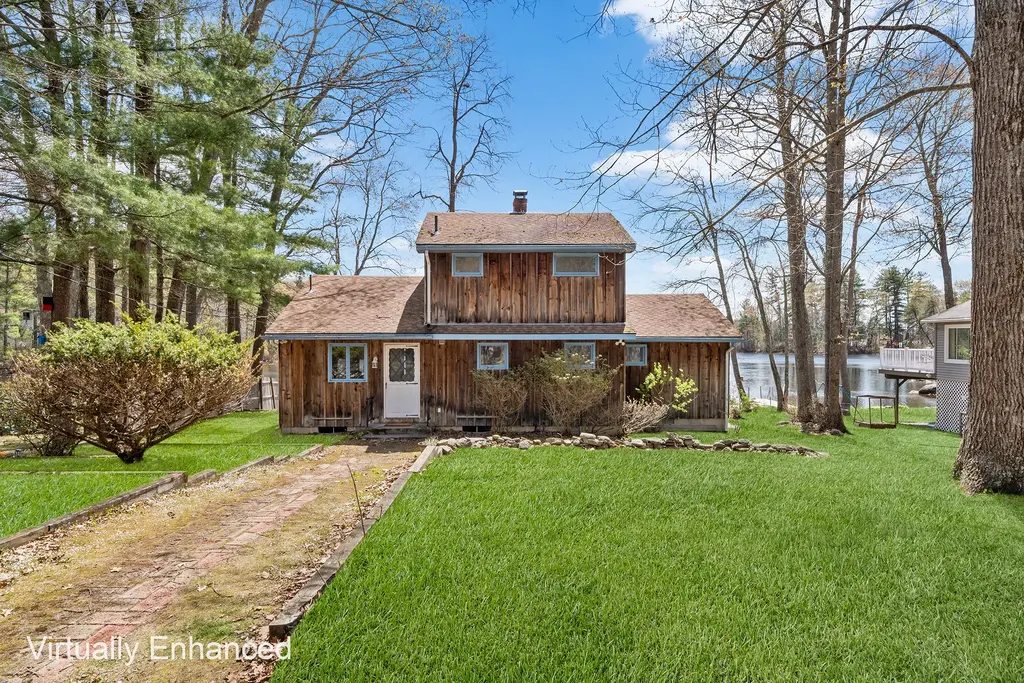
Waterfront home for sale by owner. Located on Echo Lake ( Pascoag reservoir) this home was built in 1978 and features 3 bedrooms 1 full bath and a 1/2 bath with 1,600 sq feet of living space. Home has beautiful working wood stove located in the living room. The kitchen has beautiful customs cabinets. The house sits on a 14,000 sq foot lot with plenty of space for parking or future upgrades such as additions or a garage. This home also has a huge dock with space to pack a boat and jet skis. For any questions or to schedule a showing please text me at +14016778411 or send an email to [email protected]. Thank you for your interest
Key facts
- Custom kitchen
- Private deck
- Lakeside living
Tags
Property features AI
Finance
- HOA & community: Near schools, restaurants, and shopping
Exterior
- Parking: No garage; Space for about 10 vehicles
- Utilities: 100 amp electric service; Private well water; Septic tank sewer
- Home design: Two-story single-family home; Wood siding; Concrete perimeter foundation
- Construction: Wood siding construction; Concrete perimeter foundation
- Exterior features: Breezeway; Deck; Patio; Screened porch; Waterfront lot
Interior
- Kitchen: Kitchen on the first floor
- Bedrooms: Primary and secondary bedrooms on the first floor; additional bedroom and den on the second floor
- Flooring: Carpet; Hardwood
- Bathrooms: One full bathroom; One half bathroom
- Heating & cooling: Oil-fired hot water baseboard heating
- Interior features: Interior steps; Tub with shower; Wood-burning stove
- Laundry & utility: Tankless water heater
Neighborhood map
What this means for you Summary
Snapshot
- This is a 3-bed/1.5-bath single-family listed at $550k.
Deal economics
- At list price, monthly cash flow is $-2k ($-24k/yr) — negative.
- To cash-flow at today's rent, offer at most $195k (64.6% below list).
- To meet the 1% rule (rent ≥ 1% of price), the offer needs to be $209k (62.1% below list).
- Recommended offer: $195k (64.6% below list) — sets the bar for cash-flow.
Location & tenants
- Location reads: area grade F — affects rentability + tenant quality, not the cash-flow math above.
- Burrillville (suburban): math 14% / reading 29% proficiency, ranked #27 of 39 in RI (top 69%) — low school quality limits family demand, transient renter base, plan for 1-2y turnover.
- Market conditions: 47 active listings in the ZIP; 776 units permitted in Providence County in 2024 (229 in 5+ unit buildings).
Forward outlook
- In year one you build about $59k of equity ($4k loan paydown + $55k appreciation (10.0% local appreciation)).
- Providence County population projected at +5% by 2050 — modest demand growth; plan on rents tracking national, not racing it.
- By year 2, paydown + projected appreciation supports a ~$95k cash-out refi (75% LTV) — recoverable capital for the next deal without selling this one.
Negotiation context
- It's been on market 42 days — a 3% lower offer ($534k) is reasonable based on typical stale-listing flexibility.
- 3 sale attempts since 30y ago with the ask held roughly flat each time — persistent listings suggest the price (not the market) is what's stuck; bring a comps-based counter.
Risks & watch-outs
- Watch-outs: built in 1940 — expect roof / HVAC / electrical / plumbing capex.
- Climate carrying-cost: major wind risk, 64% chance of damaging wind over 30y — expect insurance premiums to compound above CPI over the hold.
Questions for the listing agent
- What do current leases actually rent for vs. the listed asking? Can we see a recent rent roll and the last 12 months of T-12 income?
- It's been on market 42 days. Have you received any prior offers? Is the seller open to a 65% concession, seller financing, or rate buy-down credit?
- Built in 1940 — when were the roof, HVAC, electrical panel, plumbing, and water heater last replaced?
- Is there a deadline driving the sale (1031 exchange, divorce, estate, relocation)? That informs how much negotiation room exists.
- The area grade is low — what's the realistic commute time and amenity access for the typical tenant pool here? Any planned neighborhood developments (good or bad) we should know about?
- This sits on a lake — are riparian / water-frontage rights deeded with the parcel? Any dock permits, shoreline easements, or HOA water-use restrictions?
- What's the documented flood / surge / shoreline-erosion history here (FEMA AND non-FEMA — e.g., storm surge, creek backup, septic-field saturation)?
- Any water-quality or seasonal algae-bloom issues that affect tenant satisfaction or short-term-rental demand?
- What's the average days-on-market for RENTAL listings here right now (not sales)? A rising rental-DOM trend means longer vacancies and softer asking-rent achievability than the comps imply.
- What's the recent tenant-quality profile in this submarket — average credit score on applications, eviction rate, late-payment / NSF rate, and stable-employment percentage? A property-management company in the area should have these aggregated.
- How much new for-sale + rental construction is in the pipeline within 1–3 miles? Heavy new supply typically softens prices + rents 12–24 months out; constrained supply supports both.
Investment metrics
- 1% rule
- 0.38% ✗
- Cap rate
- 1.91%
- Cash-on-cash
- -15.66%
- DSCR
- 0.30
- GRM
- 22.0
CMA / ARV
- ARV (median comp)
- $584,547
- List price
- $550,000
- Delta
- -5.91%
- Verdict
- FAIR
- Comps
- 20 within 1.0 mi
Show comp detail 2 sales within ~0.75 mi
| Address | Dist | Beds/Ba | Sqft | Sold | Price | $/sf | Match |
|---|---|---|---|---|---|---|---|
| 274 Courthouse Ln | 0.09mi | 3/1.0 | 1,458 (-10%) | 11mo | $430,000 | $295 | 67 |
| 121 Lake Shore Dr | 0.62mi | 3/2.0 | 1,501 (-8%) | 21mo | $397,500 | $265 | 39 |
Match score weights: distance 35% · size 25% · config 20% · recency 20%. Top-matched comps best support the ARV.
Projected returns pro-forma
10.0% appreciation · 3.0% rent growth · sell at horizon
- IRR
- 13.4%
- Equity multiple
- 2.11×
- Total profit
- $171,485
- Equity at exit
- $495,484
- IRR
- 13.6%
- Equity multiple
- 4.93×
- Total profit
- $605,542
- Equity at exit
- $1,068,529
Cash invested: $154,000 (down + closing). Projections, not guarantees.
Landlord ↔ Tenant lean methodology
- Overall (STATE)
- 31 Tenant-Leaning
- State Rhode Island
- 31 Tenant-Leaning · D+8
- County
- — inherits STATE
- City
- — inherits STATE
ZIP-level market 02859
- Home prices YoY
- 4.8%
- Active inventory
- 47
- Price-to-rent
- 22.0×
Monthly cashflow live
- Estimated rent
- $2,086 medium interval (Pro) →
- Mortgage (P&I)
- −$2,884
- Tax from tax record
- −$544 /mo · $6,530/yr
- Insurance
- −$229
- HOA
- −$0
- Vacancy / Maint / Mgmt
- −$438
- Net cashflow
- $-2,010
Break-even live
UW: 25.0% down · 7.5% · 30yr · 1.5% tax · 5.0% vac · 8.0% maint · 8.0% mgmt
Financing live
Cash to close
- Down payment
- $137,500
- Closing costs
- $16,500
- Reserves months
- —
- Total cash needed
- —
Loan-product check · same deal, 3 products live
Conventional
25% down · 7.5% · 30yr
- Down + closing
- —
- Monthly P&I
- —
- Monthly cashflow
- —
- DSCR
- —
- Eligible?
- —
Personal DTI + credit; lowest rate.
DSCR
20% down · 8.5% · 30yr
- Down + closing
- —
- Monthly P&I
- —
- Monthly cashflow
- —
- DSCR
- —
- Eligible?
- —
No personal income docs; deal must DSCR.
Hard money
10% down · 12.0% · 12mo
- Down + closing
- —
- Monthly P&I
- —
- Monthly cashflow
- —
- DSCR
- —
- Eligible?
- —
Short-term bridge; refi at stabilization.
Listing history 17 events
-
2026-06-18days on market $550,000 Active 42 DOM
-
2026-06-17days on market $550,000 Active 41 DOM
-
2026-06-16days on market $550,000 Active 40 DOM
-
2026-06-15days on market $550,000 Active 39 DOM
-
2026-06-13days on market $550,000 Active 37 DOM
-
2026-06-12days on market $550,000 Active 36 DOM
-
2026-06-09days on market $550,000 Active 33 DOM
-
2026-06-08days on market $550,000 Active 32 DOM
-
2026-06-08days on market $550,000 Active 31 DOM
-
2026-06-07days on market $550,000 Active 30 DOM
-
2026-06-04days on market $550,000 Active 27 DOM
-
2026-06-02days on market $550,000 Active 26 DOM
-
2026-06-01days on market $550,000 Active 25 DOM
-
2026-05-31days on market $550,000 Active 24 DOM
-
2026-05-07$550,000 Active 513-char remark
-
2026-02-05$575,000 Active 640-char remark
Show marketing remark (640 chars)
Waterfront home for sale by owner. Located on Echo Lake ( Pascoag reservoir) this home was built in 1978 and features 3 bedrooms 1 full bath and a 1/2 bath with 1,600 sq feet of living space. Home has beautiful working wood stove located in the living room. The kitchen has beautiful customs cabinets. The house sits on a 14,000 sq foot lot with plenty of space for parking or future upgrades such as additions or a garage. This home also has a huge dock with space to pack a boat and jet skis. For any questions or to schedule a showing please text me at +14016778411 or send an email to [email protected]. Thank you for your interest
-
1996-09-04$135,000
ⓘ Source: listings_history table (triggers on properties + properties_extension) + one-shot
backfill from property_details.listing_events for pre-trigger history.
Tax reassessment forecast RI · Partial reset (capped growth)
- Current annual tax
- $6,530 · $544/mo
- Projected year-2 tax
- $7,748 · $646/mo
- Expected delta
- +$1,218/yr (+$101/mo · 18.6%)
ⓘ Screening estimate from a state-policy table — verify with the county assessor before closing.
Climate risk First Street
- Flood 1/10 Low FEMA zone X (unshaded) · 0% chance over 30 yrs
- Wildfire 3/10 Moderate
- Heat 4/10 Moderate 7 d/yr ≥94°F today · 15 d/yr by 30 yrs out
- Wind 6/10 Major 64% chance of damaging wind over 30 yrs
- Air quality 2/10 Low 2 unhealthy d/yr today · 2 by 30 yrs out
Nearby sold comps map
Loading sold comps map…
Walkable amenities ~0.75 mi
Loading nearby amenities…
Taxation est. · year 1
- Rental income
- $25,030
- − Mortgage interest
- −$30,809
- − Property taxes
- −$6,530
- − Insurance
- −$2,750
- − Repairs & maintenance
- −$2,002
- − Management
- −$2,002
- − Depreciation
- −$16,000
- Taxable loss
- −$35,063
- Est. tax savings @ 24.0%
- +$8,415
- After-tax cash flow
- $-15,702/yr
For passive investors: Depreciation is non-cash, so a rental often shows a tax loss while cash-flowing — sheltering income. Rental losses are passive: they offset passive income freely, and up to $25,000/yr can offset ordinary (W-2) income if you actively participate and your MAGI is under $100k (phasing out to $0 by $150k); unused losses carry forward. On sale, claimed depreciation is recaptured at up to 25%, and gains may owe capital-gains tax (a 1031 exchange can defer both). Figures are a year-1 estimate at your 24.0% rate — not tax advice; consult a CPA.
Schools (NCES district)
- District
- Burrillville
- NCES district ID
- 4400090
- Math proficiency
- 14% ▼ -6.00%
- Reading proficiency
- 29% ▼ -5.00%
- Median HH income
- $66,679
- Composite
- 20.69/100
- National rank
- #8529
- State rank
- #27 of 39 in RI
Livability — Burrillville
No livability data for this city. (Only ~50 U.S. cities are tracked.)
Census & demographics
- Census place
- Pascoag, RI
- Population (ZIP)
- 6,803
Population outlook (Providence County) Hauer SSP2
- Today (2025)
- 653,469 people
- By 2030
- 660,819 · +1.1%
- By 2040
- 672,747 · +3.0%
- By 2050
- 683,741 · +4.6%
- By 2075
- 720,435 · +10.2%
- By 2100
- 741,582 · +13.5%
Race, ethnicity, and origin ACS 2023
- Neighborhood character
- Predominantly White (88%)
- Race & ethnicity
- White 88% Hispanic / Latino 8% Two or more races 2% Asian 1%
- Hispanic origin (detail)
- Dominican 5%
- Common ancestry
- Lithuanian 16% Russian 4% Romanian 3%
- Foreign-born
- 8% · Canada
- Languages at home
- 90% English-only · Spanish 9% French/Haitian/Cajun 1%
Political lean MEDSL · Providence
- 2024 margin
- D (+14.4) · D 56.1% · R 41.7% · Other 2.2%
- 2008→2024 swing
- -20.0pp toward R · 2008: 34.4pp · 2024: 14.4pp
- All cycles
- 2024: D+14.4 2020: D+22.9 2016: D+21.2 2012: D+34.9 2008: D+34.4
Not yet ingested
- Civics
- —
Market trends
- HPI YoY
- ▲ 15.22%
- Current HPI
- 330.7456
- Rent YoY
- —
- Metro
- —
- State GDP YoY
- ▲ 2.25%
- F500 in state
- 10
Industry mix (Fortune 500 HQ in RI)
| Industry | F500 HQs | Revenue |
|---|---|---|
| Healthcare | 1 | $373B |
|
||
| Food Distribution | 1 | $31B |
|
||
| Aerospace / Defense | 1 | $14B |
|
||
| Financial Services | 1 | $8B |
|
||
| Consumer Goods | 1 | $4B |
|
||
Price history
+307.4% since first listed3 events — show timeline
- 2026-05-07 Listed $550,000 RIS
- 2026-02-05 Listed $575,000 Fizber.com
- 1996-09-04 Listed $135,000 RIS
Property tax history
+1.9%/yrLatest (2025): $6,530 · +2.8% YoY. Source: county tax records.
Cash-flow waterfall
monthlySold comps — $/sqft
last 12 mo · ≤1 miLoading sold comps…