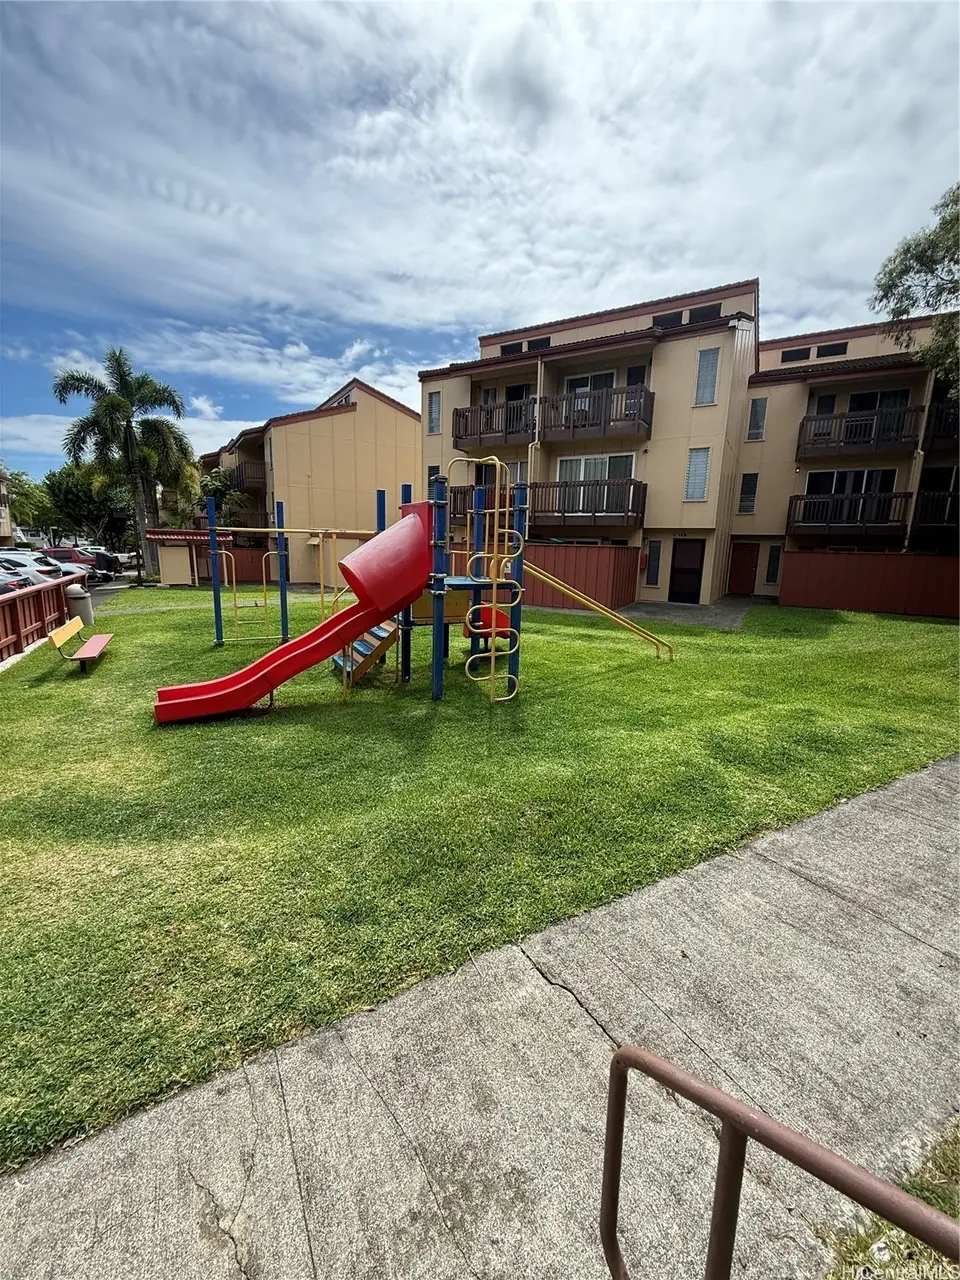
46-78 Emepela Pl Unit K104 · Kaneohe, HI
Flood risk 1/10 · Minimal
- FEMA flood zone
- X (unshaded)
- Chance of flooding over 30 yrs
- 0.0%
- Est. flood insurance / yr
- $507 – $1,088
Fire risk No data
- Est. fire insurance / yr
- —
Heat risk No data
- Hot days now (above threshold)
- —
- Hot days in 30 yrs
- —
Wind risk No data
- Chance of severe wind over 30 yrs
- —
Air-quality risk 1/10 · Minimal
- Unhealthy air days now
- —
- Unhealthy air days in 30 yrs
- —
Risk factors via First Street. Map © Google.
Why this score? — see what drove the B grade
The composite is a weighted blend of 9 inputs, each scored 0–100. Each bar is that input's sub-score; the figure is the points it added to the 100-point composite (weight × sub-score).
- Cash flow +30.0/30.0
- 1% rule +10.0/10.0
- DSCR +10.0/10.0
- ARV discount +7.5/15.0
- Rent growth +4.6/5.0
- Schools +3.7/10.0
- Livability +3.7/5.0
- Condition / age +2.5/5.0
- Appreciation +0.0/10.0
$165,600
🖨 Deal sheet (PDF) 📄 Offer letter ✓ Due diligence
Listing remarks MLS
Great opportunity to own a unit in Windward Estates. Leasehold Property. Lease until 2033. Buyer to do own due diligence. Lease and lease rent details to be confirmed.
Key facts
- $1,345 HOA
- 2 parking spots
- Community pool
Neighborhood map
What this means for you Summary
Snapshot
- This is a 4-bed/3.0-bath condo listed at $166k.
Deal economics
- At list price, monthly cash flow is $789 ($9k/yr) — positive.
- The deal already cash-flows at list — no discount required.
- Meets the 1% rule at list price ($4k rent vs $166k).
- Recommended offer: $146k (12.0% below list) — sets the bar for market timing.
- Cap rate 12.0% vs local median 1.6% in Kaneohe — top-decile yield for the area; either an underpriced asset or a hidden risk that comps aren't pricing in. Stress-test before assuming the spread holds.
Location & tenants
- Location reads 74/100 on livability (#15 in HI, #4,828 nationally) — a middle-class / working-renter tenant base. Strengths: employment A+, health & safety A+, crime A; Watch: amenities F, cost of living F.
- Hawaii Department Of Education (suburban): math 32% / reading 50% proficiency, ranked #1 of 1 in HI (top 100%) — families likely to look elsewhere, expect single-tenant / working-renter base with shorter leases.
- Market conditions: Rents rising fast (+8.4%/yr); 121 active listings in the ZIP; 4 comparable units currently listed for rent nearby; rentals lingering (median 45d on market — plan ~5-8 weeks vacancy on turnover, expect pricing pressure); 100% of comp listings sitting > 30 days — soft ceiling on asking rent; high-income renter base; 1,638 units permitted in Honolulu County in 2024 (793 in 5+ unit buildings).
- This rent runs 38% of the median local income ($132k/yr) — at the standard rent-burdened threshold; future hikes will face affordability resistance.
Forward outlook
- Local home prices are declining (-3.0%/yr); year-one equity from $1k of loan paydown is wiped out by about $5k of value loss. Plan a longer hold.
- Honolulu County population projected at +17% by 2050 — long-run rental-demand tailwind backs the buy-and-hold thesis.
- At projected returns (-3.0% appreciation + 8.0% rent growth), your $46k cash investment doubles in ~5 years — after that, you're playing with house money.
Negotiation context
- It's been on market 219 days — a 12% lower offer ($146k) is reasonable based on typical stale-listing flexibility.
- 4 sale attempts since 23y ago; this cycle's ask has dropped $94k (36%) from the opening price — seller is motivated, your offer sets the floor, not the list.
Risks & watch-outs
- Watch-outs: HOA is 33% of rent.
Questions for the listing agent
- It's been on market 219 days. Have you received any prior offers? Is the seller open to a 12% concession, seller financing, or rate buy-down credit?
- What does the HOA fee cover, when was the last increase, and are there any pending special assessments or reserve-fund shortfalls?
- Any open or pending special assessments — roof, HVAC, plumbing, elevator, façade? What's the per-unit balance and payoff schedule, and is the seller paying it off at close or rolling it to the buyer?
- Why hasn't it sold? Are there any deal-killer items the seller is aware of (foundation, flood, title, zoning, code violations)?
- Is there a deadline driving the sale (1031 exchange, divorce, estate, relocation)? That informs how much negotiation room exists.
- Schools are B-rated — typically a magnet for longer-tenancy family renters. What's the average tenant stay here, and is there a school-zone premium baked into asking?
- What's the average days-on-market for RENTAL listings here right now (not sales)? A rising rental-DOM trend means longer vacancies and softer asking-rent achievability than the comps imply.
- What's the recent tenant-quality profile in this submarket — average credit score on applications, eviction rate, late-payment / NSF rate, and stable-employment percentage? A property-management company in the area should have these aggregated.
- How much new apartment / multifamily construction is in the pipeline within 1–3 miles? Heavy new supply (>2% of stock underway) typically softens rents 12–24 months out; light construction supports rent growth.
Investment metrics
- 1% rule
- 2.50% ✓
- Cap rate
- 12.01%
- Cash-on-cash
- 20.42%
- DSCR
- 1.91
- GRM
- 3.3
CMA / ARV
- ARV (median comp)
- $690,087
- List price
- $165,600
- Delta
- -73.92%
- Verdict
- UNDERPRICED
- Comps
- 20 within 1.0 mi
Projected returns pro-forma
-3.0% appreciation · 8.0% rent growth · sell at horizon
- IRR
- 22.0%
- Equity multiple
- 2.00×
- Total profit
- $46,153
- Equity at exit
- $24,691
- IRR
- 34.8%
- Equity multiple
- 5.48×
- Total profit
- $207,929
- Equity at exit
- $14,318
Cash invested: $46,368 (down + closing). Projections, not guarantees.
Landlord ↔ Tenant lean methodology
- Overall (STATE)
- 37 Tenant-Leaning
- State Hawaii
- 37 Tenant-Leaning · D+13
- County
- — inherits STATE
- City
- — inherits STATE
ZIP-level market 96744
- Rents YoY
- 8.4%
- Active inventory
- 121
- Price-to-rent
- 3.3×
Monthly cashflow live
- Estimated rent
- $4,134 medium interval (Pro) →
- Mortgage (P&I)
- −$868
- Tax from tax record
- −$195 /mo · $2,337/yr
- Insurance
- −$69
- HOA
- −$1,345
- Vacancy / Maint / Mgmt
- −$868
- Net cashflow
- $789
Break-even live
Sensitivity live
| Price | -10% $883 | -5% $836 | +0% $789 | +5% $742 | +10% $695 |
|---|---|---|---|---|---|
| Rent | -10% $462 | -5% $626 | +0% $789 | +5% $952 | +10% $1,116 |
| Rate | -1.0pp $872 | -0.5pp $831 | base $789 | +0.5pp $746 | +1.0pp $703 |
UW: 25.0% down · 7.5% · 30yr · 1.5% tax · 5.0% vac · 8.0% maint · 8.0% mgmt
Financing live
Cash to close
- Down payment
- $41,400
- Closing costs
- $4,968
- Reserves months
- —
- Total cash needed
- —
Loan-product check · same deal, 3 products live
Conventional
25% down · 7.5% · 30yr
- Down + closing
- —
- Monthly P&I
- —
- Monthly cashflow
- —
- DSCR
- —
- Eligible?
- —
Personal DTI + credit; lowest rate.
DSCR
20% down · 8.5% · 30yr
- Down + closing
- —
- Monthly P&I
- —
- Monthly cashflow
- —
- DSCR
- —
- Eligible?
- —
No personal income docs; deal must DSCR.
Hard money
10% down · 12.0% · 12mo
- Down + closing
- —
- Monthly P&I
- —
- Monthly cashflow
- —
- DSCR
- —
- Eligible?
- —
Short-term bridge; refi at stabilization.
Rent comps 4 comps
| Address | Beds | Baths | Sqft | Rent | $/sqft | DOM | Units | Dist |
|---|---|---|---|---|---|---|---|---|
| 46-078 Emepela Pl Unit I200 Kaneohe, HI | 3.0 | 2.0 | 1362 | $3,600 | $2.64 | 45d | 1 | 0.03mi |
| 46-318 Haiku Rd #60 Kaneohe, HI | 4.0 | 2.5 | 2003 | $3,950 | $1.97 | 45d | 1 | 0.18mi |
| 46-259 Kahuhipa St Unit 206B Kaneohe, HI | 3.0 | 2.0 | 1097 | $3,500 | $3.19 | 45d | 1 | 0.24mi |
| 45-995 Wailele Rd #80 Kaneohe, HI | 3.0 | 3.0 | 1122 | $6,500 | $5.79 | 45d | 1 | 1.22mi |
HOA detail condo
- Monthly dues
- $1,345 · $16,140/yr
- Assessments
- None detected in remarks — confirm with the listing agent.
Listing history 33 events
-
2026-06-21pricedays on market $165,600 Active 219 DOM
-
2026-06-18days on market $180,000 Active 216 DOM
-
2026-06-17days on market $180,000 Active 215 DOM
-
2026-06-15days on market $180,000 Active 213 DOM
-
2026-06-13days on market $180,000 Active 211 DOM
-
2026-06-13days on market $180,000 Active 210 DOM
-
2026-06-10days on market $180,000 Active 208 DOM
-
2026-06-09days on market $180,000 Active 207 DOM
-
2026-06-08days on market $180,000 Active 206 DOM
-
2026-06-07days on market $180,000 Active 205 DOM
-
2026-06-05days on market $180,000 Active 202 DOM
-
2026-06-03days on market $180,000 Active 201 DOM
-
2026-06-02days on market $180,000 Active 200 DOM
-
2026-06-01days on market $180,000 Active 199 DOM
-
2026-05-31days on market $180,000 Active 198 DOM
-
2026-05-05price $180,000 167-char remark
Show marketing remark (167 chars)
Great opportunity to own a unit in Windward Estates. Leasehold Property. Lease until 2033. Buyer to do own due diligence. Lease and lease rent details to be confirmed.
-
2026-04-20price $200,000 167-char remark
Show marketing remark (167 chars)
Great opportunity to own a unit in Windward Estates. Leasehold Property. Lease until 2033. Buyer to do own due diligence. Lease and lease rent details to be confirmed.
-
2026-03-06price $217,000 167-char remark
Show marketing remark (167 chars)
Great opportunity to own a unit in Windward Estates. Leasehold Property. Lease until 2033. Buyer to do own due diligence. Lease and lease rent details to be confirmed.
-
2026-02-04price $234,906 167-char remark
Show marketing remark (167 chars)
Great opportunity to own a unit in Windward Estates. Leasehold Property. Lease until 2033. Buyer to do own due diligence. Lease and lease rent details to be confirmed.
-
2025-12-17price $249,900 167-char remark
Show marketing remark (167 chars)
Great opportunity to own a unit in Windward Estates. Leasehold Property. Lease until 2033. Buyer to do own due diligence. Lease and lease rent details to be confirmed.
-
2025-11-12$260,000 Active 167-char remark
Show marketing remark (167 chars)
Great opportunity to own a unit in Windward Estates. Leasehold Property. Lease until 2033. Buyer to do own due diligence. Lease and lease rent details to be confirmed.
-
2022-04-18soldstatus $315,000
-
2006-08-28historical
-
2006-06-22$409,500
-
2005-12-09soldstatus $382,500
-
2005-12-09soldstatus $375,000
-
2005-10-01$395,000
-
2003-09-23soldstatus $186,000
-
2003-06-05historical
-
2003-06-01$179,000
-
1993-09-03soldstatus $498,150
-
1982-10-29soldstatus $162,000
-
1981-07-01soldstatus $145,000
ⓘ Source: listings_history table (triggers on properties + properties_extension) + one-shot
backfill from property_details.listing_events for pre-trigger history.
Tax reassessment forecast HI · Partial reset (capped growth)
- Current annual tax
- $2,337 · $195/mo
- Projected year-2 tax
- $2,337 · $195/mo
- Expected delta
- $0/yr ($0/mo · 0.0%)
ⓘ Screening estimate from a state-policy table — verify with the county assessor before closing.
Climate risk First Street
- Flood 1/10 Low FEMA zone X (unshaded) · 0% chance over 30 yrs
- Air quality 1/10 Low
Nearby sold comps map
Loading sold comps map…
Walkable amenities ~0.75 mi
Loading nearby amenities…
Taxation est. · year 1
- Rental income
- $49,613
- − Mortgage interest
- −$9,276
- − Property taxes
- −$2,337
- − Insurance
- −$828
- − Repairs & maintenance
- −$3,969
- − Management
- −$3,969
- − HOA
- −$16,140
- − Depreciation
- −$4,817
- Taxable income
- $8,277
- Est. tax owed @ 24.0%
- −$1,986
- After-tax cash flow
- $7,482/yr
For passive investors: Depreciation is non-cash, so a rental often shows a tax loss while cash-flowing — sheltering income. Rental losses are passive: they offset passive income freely, and up to $25,000/yr can offset ordinary (W-2) income if you actively participate and your MAGI is under $100k (phasing out to $0 by $150k); unused losses carry forward. On sale, claimed depreciation is recaptured at up to 25%, and gains may owe capital-gains tax (a 1031 exchange can defer both). Figures are a year-1 estimate at your 24.0% rate — not tax advice; consult a CPA.
Schools (NCES district)
- District
- Hawaii Department Of Education
- NCES district ID
- 1500030
- Math proficiency
- 32% ▼ -10.00%
- Reading proficiency
- 50% ▼ -3.00%
- Median HH income
- $69,005
- Composite
- 37.07/100
- National rank
- #4504
- State rank
- #1 of 1 in HI
Livability — Kaneohe
- Score
- 74/100
- State rank
- #15
- US rank
- #4828
Category grades
Schools grade is shown separately in the Schools card above.
Census & demographics
- Census place
- Kaneohe, HI
- County
- Honolulu County · 963,448 people
- City population
- 57,620
- Metro
- Urban Honolulu, HI
- Population (ZIP)
- 57,620
- Household income
- $131,653
- Rent vs Own
- Severe rent burden
- 789.0
Population outlook (Honolulu County) Hauer SSP2
- Today (2025)
- 1,072,641 people
- By 2030
- 1,110,460 · +3.5%
- By 2040
- 1,181,593 · +10.2%
- By 2050
- 1,257,584 · +17.2%
- By 2075
- 1,501,120 · +39.9%
- By 2100
- 1,764,430 · +64.5%
Race, ethnicity, and origin ACS 2023
- Neighborhood character
- Highly diverse neighborhood (Simpson 0.83)
- Race & ethnicity
- Asian 35% Two or more races 35% White 17% Hispanic / Latino 11% Pacific Islander 9%
- Hispanic origin (detail)
- Mexican 3% Puerto Rican 5%
- Common ancestry
- Russian 3% Slovak 1% Lithuanian 1%
- Foreign-born
- 7% · Canada, China, Vietnam
- Languages at home
- 88% English-only · Other Asian/Pacific 7% Spanish 1% Tagalog/Filipino 1%
Political lean MEDSL · Honolulu
- 2024 margin
- Strong D (+21.6) · D 59.9% · R 38.3% · Other 1.8%
- 2008→2024 swing
- -19.4pp toward R · 2008: 41.1pp · 2024: 21.6pp
- All cycles
- 2024: D+21.6 2020: D+26.9 2016: D+29.9 2012: D+39.1 2008: D+41.1
Not yet ingested
- Civics
- —
Market trends
- HPI YoY
- ▼ -677.95%
- Current HPI
- 376.8834
- Rent YoY
- ▲ 8.45%
- Metro
- Urban Honolulu, HI
- State GDP YoY
- —
- F500 in state
- 0
Price history
+24.1% since first listed18 events — show timeline
- 2026-05-05 Price Changed $180,000 HiCentral MLS
- 2026-04-20 Price Changed $200,000 HiCentral MLS
- 2026-03-06 Price Changed $217,000 HiCentral MLS
- 2026-02-04 Price Changed $234,906 HiCentral MLS
- 2025-12-17 Price Changed $249,900 HiCentral MLS
- 2025-11-12 Listed $260,000 HiCentral MLS
- 2022-04-18 Sold (Public Records) $315,000 Public Records
- 2006-08-28 Listing Removed — HiCentral MLS
- 2006-06-22 Listed $409,500 HiCentral MLS
- 2005-12-09 Sold (Public Records) $375,000 Public Records
- 2005-12-09 Sold (MLS) $382,500 HiCentral MLS
- 2005-10-01 Listed $395,000 HiCentral MLS
- 2003-09-23 Sold (MLS) $186,000 HiCentral MLS
- 2003-06-05 Listing Removed — HiCentral MLS
- 2003-06-01 Listed $179,000 HiCentral MLS
- 1993-09-03 Sold (Public Records) $498,150 Public Records
- 1982-10-29 Sold (Public Records) $162,000 Public Records
- 1981-07-01 Sold (Public Records) $145,000 Public Records
Property tax history
+3.2%/yrLatest (2022): $2,337 · +5.9% YoY. Source: county tax records.
Cash-flow waterfall
monthlySold comps — $/sqft
last 12 mo · ≤1 miLoading sold comps…