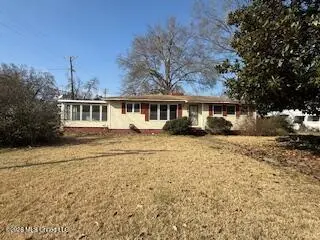
208 W Monroe Ave · Greenwood, MS
Flood risk 1/10 · Minimal
- FEMA flood zone
- X
- Chance of flooding over 30 yrs
- 0.0%
- Est. flood insurance / yr
- $507 – $1,088
Fire risk 1/10 · Minimal
- Est. fire insurance / yr
- $1,241 – $2,305
Heat risk 7/10 · Major
- Hot days now (above 110°F)
- 7 days/yr
- Hot days in 30 yrs
- 21 days/yr
Wind risk 6/10 · Moderate
- Chance of severe wind over 30 yrs
- 27.0%
Air-quality risk 1/10 · Minimal
- Unhealthy air days now
- 0 days/yr
- Unhealthy air days in 30 yrs
- 0 days/yr
Risk factors via First Street. Map © Google.
Why this score? — see what drove the B grade
The composite is a weighted blend of 9 inputs, each scored 0–100. Each bar is that input's sub-score; the figure is the points it added to the 100-point composite (weight × sub-score).
- Cash flow +30.0/30.0
- 1% rule +10.0/10.0
- DSCR +10.0/10.0
- ARV discount +7.5/15.0
- Schools +5.0/10.0
- Livability +3.6/5.0
- Rent growth +2.5/5.0
- Condition / age +2.5/5.0
- Appreciation +0.0/10.0
$69,900
🖨 Deal sheet (PDF) 📄 Offer letter ✓ Due diligence
Listing remarks MLS
JUST REDUCED! Sold AS IS - Great opportunity to renovate and make it your own! This home sits on a desirable corner lot with a private backyard. Features include bold interior colors, a drop-down den area, and a one-car garage. With some TLC, this property has incredible potential and value for the right buyer or investor
Key facts
- Drop-down den area
- Private backyard
- Corner lot
Tags
Neighborhood map
What this means for you Summary
Snapshot
- This is a 3-bed/2.0-bath other listed at $70k.
Deal economics
- At list price, monthly cash flow is $487 ($6k/yr) — positive.
- The deal already cash-flows at list — no discount required.
- Meets the 1% rule at list price ($1k rent vs $70k).
- Recommended offer: $62k (12.0% below list) — sets the bar for market timing.
- Cap rate 14.7% vs local median 4.7% in Greenwood — top-decile yield for the area; either an underpriced asset or a hidden risk that comps aren't pricing in. Stress-test before assuming the spread holds.
Location & tenants
- Location reads 71/100 on livability (#31 in MS) — a middle-class / working-renter tenant base. Strengths: cost of living A+, health & safety A+, housing A; Watch: schools D, amenities F, commute F.
- Market conditions: 101 active listings in the ZIP; 9 units permitted in Leflore County in 2024 (0 in 5+ unit buildings).
Forward outlook
- Local home prices are declining (-3.0%/yr); year-one equity from $483 of loan paydown is wiped out by about $2k of value loss. Plan a longer hold.
- Leflore County population projected at -29% by 2050 — secular population decline; favor cash flow + early exit over multi-decade hold.
- At projected returns (-3.0% appreciation + 3.0% rent growth), your $20k cash investment doubles in ~5 years — after that, you're playing with house money.
Negotiation context
- It's been on market 188 days — a 12% lower offer ($62k) is reasonable based on typical stale-listing flexibility.
- 2 sale attempts; this cycle's ask has dropped $20k (22%) from the opening price — seller is motivated, your offer sets the floor, not the list.
Risks & watch-outs
- Watch-outs: built in 1948 — expect roof / HVAC / electrical / plumbing capex.
- Climate carrying-cost: major wind risk, 27% chance of damaging wind over 30y; extreme-heat days projected 7→21/yr by 2055 (HVAC capex compounding) — expect insurance premiums to compound above CPI over the hold.
Questions for the listing agent
- It's been on market 188 days. Have you received any prior offers? Is the seller open to a 12% concession, seller financing, or rate buy-down credit?
- Built in 1948 — when were the roof, HVAC, electrical panel, plumbing, and water heater last replaced?
- Why hasn't it sold? Are there any deal-killer items the seller is aware of (foundation, flood, title, zoning, code violations)?
- Is there a deadline driving the sale (1031 exchange, divorce, estate, relocation)? That informs how much negotiation room exists.
- Schools are D-rated, which usually means shorter tenancies and higher turnover. Who's the typical renter profile here, and what's been the actual vacancy rate?
- What's the average days-on-market for RENTAL listings here right now (not sales)? A rising rental-DOM trend means longer vacancies and softer asking-rent achievability than the comps imply.
- What's the recent tenant-quality profile in this submarket — average credit score on applications, eviction rate, late-payment / NSF rate, and stable-employment percentage? A property-management company in the area should have these aggregated.
- How much new for-sale + rental construction is in the pipeline within 1–3 miles? Heavy new supply typically softens prices + rents 12–24 months out; constrained supply supports both.
Investment metrics
- 1% rule
- 1.76% ✓
- Cap rate
- 14.66%
- Cash-on-cash
- 29.87%
- DSCR
- 2.33
- GRM
- 4.7
CMA / ARV
No comps found within radius.
Projected returns pro-forma
-3.0% appreciation · 3.0% rent growth · sell at horizon
- IRR
- 24.4%
- Equity multiple
- 2.01×
- Total profit
- $19,718
- Equity at exit
- $10,422
- IRR
- 32.3%
- Equity multiple
- 3.92×
- Total profit
- $57,196
- Equity at exit
- $6,044
Cash invested: $19,572 (down + closing). Projections, not guarantees.
Landlord ↔ Tenant lean methodology
- Overall (STATE)
- 90 Strongly Landlord-Friendly
- State Mississippi
- 90 Strongly Landlord-Friendly · R+11
- County
- — inherits STATE
- City
- — inherits STATE
ZIP-level market 38930
- Home prices YoY
- -18.6%
- Active inventory
- 101
- Price-to-rent
- 4.7×
Monthly cashflow live
- Estimated rent
- $1,228 medium interval (Pro) →
- Mortgage (P&I)
- −$367
- Tax est. 1.5%
- −$87 /mo · $1,048/yr
- Insurance
- −$29
- HOA
- −$0
- Vacancy / Maint / Mgmt
- −$258
- Net cashflow
- $487
Break-even live
Sensitivity live
| Price | -10% $535 | -5% $511 | +0% $487 | +5% $463 | +10% $439 |
|---|---|---|---|---|---|
| Rent | -10% $390 | -5% $439 | +0% $487 | +5% $536 | +10% $584 |
| Rate | -1.0pp $522 | -0.5pp $505 | base $487 | +0.5pp $469 | +1.0pp $451 |
UW: 25.0% down · 7.5% · 30yr · 1.5% tax · 5.0% vac · 8.0% maint · 8.0% mgmt
Financing live
Cash to close
- Down payment
- $17,475
- Closing costs
- $2,097
- Reserves months
- —
- Total cash needed
- —
Loan-product check · same deal, 3 products live
Conventional
25% down · 7.5% · 30yr
- Down + closing
- —
- Monthly P&I
- —
- Monthly cashflow
- —
- DSCR
- —
- Eligible?
- —
Personal DTI + credit; lowest rate.
DSCR
20% down · 8.5% · 30yr
- Down + closing
- —
- Monthly P&I
- —
- Monthly cashflow
- —
- DSCR
- —
- Eligible?
- —
No personal income docs; deal must DSCR.
Hard money
10% down · 12.0% · 12mo
- Down + closing
- —
- Monthly P&I
- —
- Monthly cashflow
- —
- DSCR
- —
- Eligible?
- —
Short-term bridge; refi at stabilization.
Listing history 9 events
-
2026-05-15status Pending 324-char remark
Show marketing remark (324 chars)
JUST REDUCED! Sold AS IS - Great opportunity to renovate and make it your own! This home sits on a desirable corner lot with a private backyard. Features include bold interior colors, a drop-down den area, and a one-car garage. With some TLC, this property has incredible potential and value for the right buyer or investor
-
2026-04-01status Active 324-char remark
Show marketing remark (324 chars)
JUST REDUCED! Sold AS IS - Great opportunity to renovate and make it your own! This home sits on a desirable corner lot with a private backyard. Features include bold interior colors, a drop-down den area, and a one-car garage. With some TLC, this property has incredible potential and value for the right buyer or investor
-
2026-03-26historical 324-char remark
Show marketing remark (324 chars)
JUST REDUCED! Sold AS IS - Great opportunity to renovate and make it your own! This home sits on a desirable corner lot with a private backyard. Features include bold interior colors, a drop-down den area, and a one-car garage. With some TLC, this property has incredible potential and value for the right buyer or investor
-
2026-03-07price $69,900 324-char remark
Show marketing remark (324 chars)
JUST REDUCED! Sold AS IS - Great opportunity to renovate and make it your own! This home sits on a desirable corner lot with a private backyard. Features include bold interior colors, a drop-down den area, and a one-car garage. With some TLC, this property has incredible potential and value for the right buyer or investor
-
2026-02-01price $74,500 324-char remark
Show marketing remark (324 chars)
JUST REDUCED! Sold AS IS - Great opportunity to renovate and make it your own! This home sits on a desirable corner lot with a private backyard. Features include bold interior colors, a drop-down den area, and a one-car garage. With some TLC, this property has incredible potential and value for the right buyer or investor
-
2026-01-09price $79,900 324-char remark
Show marketing remark (324 chars)
JUST REDUCED! Sold AS IS - Great opportunity to renovate and make it your own! This home sits on a desirable corner lot with a private backyard. Features include bold interior colors, a drop-down den area, and a one-car garage. With some TLC, this property has incredible potential and value for the right buyer or investor
-
2025-12-12price $84,900 324-char remark
Show marketing remark (324 chars)
JUST REDUCED! Sold AS IS - Great opportunity to renovate and make it your own! This home sits on a desirable corner lot with a private backyard. Features include bold interior colors, a drop-down den area, and a one-car garage. With some TLC, this property has incredible potential and value for the right buyer or investor
-
2025-10-31$89,900 Active 324-char remark
Show marketing remark (324 chars)
JUST REDUCED! Sold AS IS - Great opportunity to renovate and make it your own! This home sits on a desirable corner lot with a private backyard. Features include bold interior colors, a drop-down den area, and a one-car garage. With some TLC, this property has incredible potential and value for the right buyer or investor
-
2000-10-20soldstatus
ⓘ Source: listings_history table (triggers on properties + properties_extension) + one-shot
backfill from property_details.listing_events for pre-trigger history.
Climate risk First Street
- Flood 1/10 Low FEMA zone X · 0% chance over 30 yrs
- Wildfire 1/10 Low
- Heat 7/10 Severe 7 d/yr ≥110°F today · 21 d/yr by 30 yrs out
- Wind 6/10 Major 27% chance of damaging wind over 30 yrs
- Air quality 1/10 Low 0 unhealthy d/yr today · 0 by 30 yrs out
Nearby sold comps map
Loading sold comps map…
Walkable amenities ~0.75 mi
Loading nearby amenities…
Taxation est. · year 1
- Rental income
- $14,737
- − Mortgage interest
- −$3,915
- − Property taxes
- −$1,048
- − Insurance
- −$350
- − Repairs & maintenance
- −$1,179
- − Management
- −$1,179
- − Depreciation
- −$2,033
- Taxable income
- $5,032
- Est. tax owed @ 24.0%
- −$1,208
- After-tax cash flow
- $4,638/yr
For passive investors: Depreciation is non-cash, so a rental often shows a tax loss while cash-flowing — sheltering income. Rental losses are passive: they offset passive income freely, and up to $25,000/yr can offset ordinary (W-2) income if you actively participate and your MAGI is under $100k (phasing out to $0 by $150k); unused losses carry forward. On sale, claimed depreciation is recaptured at up to 25%, and gains may owe capital-gains tax (a 1031 exchange can defer both). Figures are a year-1 estimate at your 24.0% rate — not tax advice; consult a CPA.
Schools (NCES district)
No district data.
Livability — Greenwood
- Score
- 71/100
- State rank
- #31
- US rank
- #6625
Category grades
Schools grade is shown separately in the Schools card above.
Census & demographics
- Census place
- Greenwood, MS
- Population (ZIP)
- 23,326
Population outlook (Leflore County) Hauer SSP2
- Today (2025)
- 27,008 people
- By 2030
- 25,362 · -6.1%
- By 2040
- 22,049 · -18.4%
- By 2050
- 19,188 · -29.0%
- By 2075
- 13,543 · -49.9%
- By 2100
- 8,913 · -67.0%
Race, ethnicity, and origin ACS 2023
- Neighborhood character
- Predominantly Black (70%)
- Race & ethnicity
- Black 70% White 25% Hispanic / Latino 3% Two or more races 1%
- Common ancestry
- Slovak 1% Serbian 1%
- Foreign-born
- 2% · Canada, Jamaica
- Languages at home
- 97% English-only · Spanish 2%
Political lean MEDSL · Leflore
- 2024 margin
- Solid D (+38.5) · D 68.7% · R 30.3%
- 2008→2024 swing
- +1.7pp toward D · 2008: 36.8pp · 2024: 38.5pp
- All cycles
- 2024: D+38.5 2020: D+41.5 2016: D+41.0 2012: D+45.8 2008: D+36.8
Not yet ingested
- Civics
- —
Market trends
- HPI YoY
- ▼ -34.32%
- Current HPI
- 150.2668
- Rent YoY
- —
- Metro
- —
- State GDP YoY
- —
- F500 in state
- 0
Price history
-22.2% since first listed9 events — show timeline
- 2026-05-15 Pending — MLSU
- 2026-04-01 Relisted — MLSU
- 2026-03-26 Listing Removed — MLSU
- 2026-03-07 Price Changed $69,900 MLSU
- 2026-02-01 Price Changed $74,500 MLSU
- 2026-01-09 Price Changed $79,900 MLSU
- 2025-12-12 Price Changed $84,900 MLSU
- 2025-10-31 Listed $89,900 MLSU
- 2000-10-20 Sold (Public Records) — Public Records
Property tax history
+18.1%/yrLatest (2025): $3,811 · +25.8% YoY. Source: county tax records.
Cash-flow waterfall
monthlySold comps — $/sqft
last 12 mo · ≤1 miLoading sold comps…