 Triplex
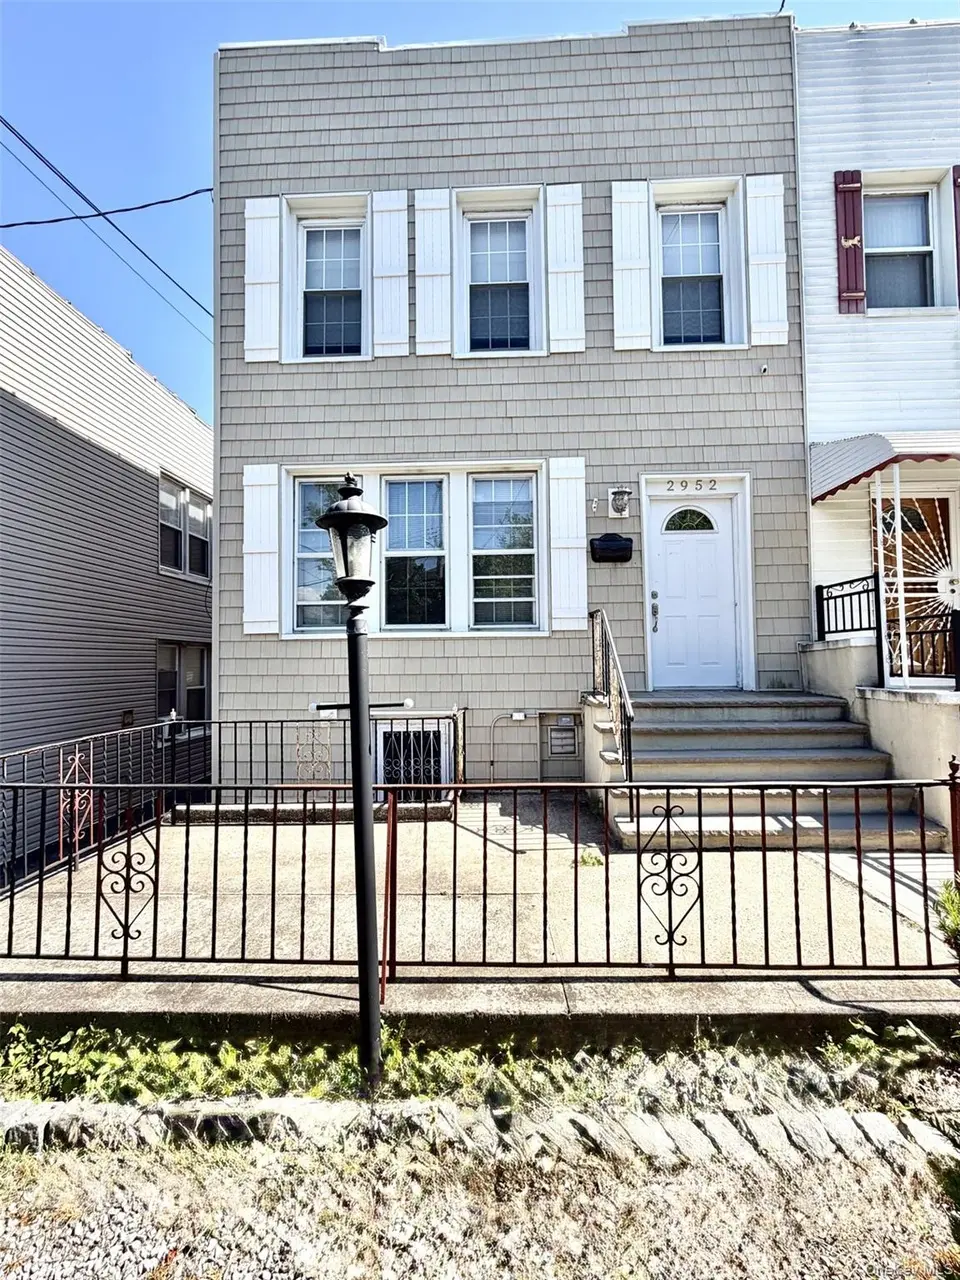
2952 Miles Ave · New York, NY
Flood risk 1/10 · Minimal
- FEMA flood zone
- X (unshaded)
- Chance of flooding over 30 yrs
- 0.0%
- Est. flood insurance / yr
- $507 – $1,088
Fire risk 1/10 · Minimal
- Est. fire insurance / yr
- $691 – $1,283
Heat risk 6/10 · Moderate
- Hot days now (above 99°F)
- 7 days/yr
- Hot days in 30 yrs
- 15 days/yr
Wind risk 6/10 · Moderate
- Chance of severe wind over 30 yrs
- 27.0%
Air-quality risk 4/10 · Minor
- Unhealthy air days now
- 6 days/yr
- Unhealthy air days in 30 yrs
- 6 days/yr
Risk factors via First Street. Map © Google.
Why this score? — see what drove the C- grade
The composite is a weighted blend of 9 inputs, each scored 0–100. Each bar is that input's sub-score; the figure is the points it added to the 100-point composite (weight × sub-score).
- Cash flow +19.7/30.0
- DSCR +6.2/10.0
- ARV discount +6.0/15.0
- Rent growth +5.0/5.0
- Schools +5.0/10.0
- 1% rule +4.4/10.0
- Livability +3.8/5.0
- Condition / age +2.5/5.0
- Appreciation +0.0/10.0
$950,000
🖨 Deal sheet 📄 Offer letter ✓ Due diligence
Multi-family units
County records classify this as Multi-Family (2-4 Unit). Listing-text estimate: 3 units. confirmed
Listing remarks
Exceptional opportunity in the heart of Throggs Neck! This spacious three-family property offers tremendous potential for investors, end-users, or multi-generational living. Featuring three separate units, a detached garage, and a highly desirable location just moments from bustling Tremont Avenue, this property combines size, versatility, and convenience. The home requires updating and renovation, presenting the perfect chance to customize, modernize, and significantly increase value. Whether you're looking to generate substantial rental income, occupy one unit while collecting rent from the others, or create a long-term investment asset, the possibilities are endless. Ideally situated nea
Key facts
- 2,500 sq ft lot
- Garage
- Built 1930
Property features AI
Exterior
- Parking: Garage; On-street parking; Shared driveway; 1-car garage
- Utilities: Public sewer; Electricity connected
- Home design: Triplex
- Construction: Vinyl siding construction
- Exterior features: Vinyl siding; Not waterfront
Interior
- Heating & cooling: Natural gas heating; Other heating; No central cooling
- Interior features: Finished full walk-out basement; Other interior features
Neighborhood map
What this means for you Summary
Snapshot
- This is a 3 × 3-bed/1.5-bath units multifamily listed at $950k.
Deal economics
- At list price, monthly cash flow is $1k ($13k/yr) — positive. Per door: $369/mo.
- The deal already cash-flows at list — no discount required.
- To meet the 1% rule (rent ≥ 1% of price), the offer needs to be $898k (5.5% below list).
- Recommended offer: $898k (5.5% below list) — sets the bar for 1% rule.
- Cap rate 7.7% vs local median 2.6% in New York — top-decile yield for the area; either an underpriced asset or a hidden risk that comps aren't pricing in. Stress-test before assuming the spread holds.
Location & tenants
- Location reads 75/100 on livability (#268 in NY, #4,188 nationally) — a middle-class / working-renter tenant base. Strengths: amenities A+, commute A+, health & safety A; Watch: crime F, cost of living F.
- Market conditions: Rents rising fast (+10.7%/yr); 215 active listings in the ZIP; solid renter incomes; 6,929 units permitted in Bronx County in 2024 (6,829 in 5+ unit buildings).
- At $8,976/mo this rent would consume 122% of the median local household income ($88k/yr) (locally 2294% of renters already pay >50% of income on rent) — very limited rent-growth headroom before tenants either downsize or default.
Forward outlook
- Local home prices are declining (-3.0%/yr); year-one equity from $7k of loan paydown is wiped out by about $28k of value loss. Plan a longer hold.
- Bronx County population projected at +21% by 2050 — long-run rental-demand tailwind backs the buy-and-hold thesis.
- At projected returns (-3.0% appreciation + 8.0% rent growth), your $266k cash investment doubles in ~10 years — after that, you're playing with house money.
Negotiation context
- Only 8 days on market — expect competitive offers; lowballing is unlikely to land.
- 2 sale attempts since 3y ago; this cycle's ask is 12% above the opening price — seller raised mid-cycle; expect resistance to lowballs.
Risks & watch-outs
- Watch-outs: built in 1930 — expect roof / HVAC / electrical / plumbing capex.
- Climate carrying-cost: major wind risk, 27% chance of damaging wind over 30y; extreme-heat days projected 7→15/yr by 2055 (HVAC capex compounding) — expect insurance premiums to compound above CPI over the hold.
Questions for the listing agent
- Can we see the unit-by-unit rent roll, current vacancy, and any below-market leases? What's the average tenancy length?
- What capital expenditures (roof, boiler, parking lot, exteriors) have been made in the last 5 years, and what's planned in the next 2?
- Built in 1930 — when were the roof, HVAC, electrical panel, plumbing, and water heater last replaced?
- Is there a deadline driving the sale (1031 exchange, divorce, estate, relocation)? That informs how much negotiation room exists.
- Schools are B-rated — typically a magnet for longer-tenancy family renters. What's the average tenant stay here, and is there a school-zone premium baked into asking?
- Crime grade is F in this area — have there been break-ins, vandalism, or insurance claims at this property in the last 3 years? What carrier currently insures it and at what premium?
- What's the average days-on-market for RENTAL listings here right now (not sales)? A rising rental-DOM trend means longer vacancies and softer asking-rent achievability than the comps imply.
- What's the recent tenant-quality profile in this submarket — average credit score on applications, eviction rate, late-payment / NSF rate, and stable-employment percentage? A property-management company in the area should have these aggregated.
- How much new apartment / multifamily construction is in the pipeline within 1–3 miles? Heavy new supply (>2% of stock underway) typically softens rents 12–24 months out; light construction supports rent growth.
Investment metrics
- 1% rule
- 0.94% ✗
- Cap rate
- 7.69%
- Cash-on-cash
- 4.99%
- DSCR
- 1.22
- GRM
- 8.8
CMA / ARV
- ARV (on-the-fly)
- $919,200
- Comps found
- 12
Show comp detail 12 sales within ~0.75 mi
| Address | Dist | Beds/Ba | Sqft | Sold | Price | $/sf | Match |
|---|---|---|---|---|---|---|---|
| 250 Kearney Ave | 0.19mi | 4/— | 2,477 (+3%) | 8mo | $910,000 | $367 | 79 |
| 248 Kearney Ave | 0.19mi | 4/3.0 | 2,477 (+3%) | 9mo | $780,000 | $315 | 78 |
| 258A Longstreet Ave | 0.48mi | 6/4.0 | 2,458 (+2%) | 1mo | $1,070,000 | $435 | 73 |
| 189 Swinton Ave | 0.37mi | 1/2.0 | 2,322 (-3%) | 8mo | $622,500 | $268 | 71 |
| 2812 Harding Ave | 0.32mi | 4/3.0 | 2,500 (+4%) | 9mo | $895,000 | $358 | 70 |
| 4190 E Tremont Ave | 0.13mi | 7/3.0 | 2,072 (-14%) | 2mo | $999,000 | $482 | 70 |
| 280 Throggs Neck Blvd | 0.12mi | 5/3.0 | 2,090 (-13%) | 5mo | $951,000 | $455 | 69 |
| 2819 Schurz Ave | 0.36mi | 5/2.0 | 2,156 (-10%) | 7mo | $825,000 | $383 | 61 |
| 525 Hollywood Ave | 0.32mi | 5/2.0 | 2,750 (+15%) | 7mo | $999,999 | $364 | 55 |
| 254 Robinson Ave | 0.63mi | 7/4.0 | 2,280 (-5%) | 10mo | $960,000 | $421 | 54 |
| 253 Robinson Ave | 0.66mi | 5/2.0 | 2,520 (+5%) | 11mo | $920,000 | $365 | 52 |
| 239 Hosmer Ave | 0.71mi | 6/4.0 | 2,200 (-8%) | 9mo | $950,000 | $432 | 45 |
Match score weights: distance 35% · size 25% · config 20% · recency 20%. Top-matched comps best support the ARV.
Projected returns pro-forma
-3.0% appreciation · 8.0% rent growth · sell at horizon
- IRR
- -3.5%
- Equity multiple
- 0.86×
- Total profit
- $-36,239
- Equity at exit
- $141,648
- IRR
- 10.9%
- Equity multiple
- 2.03×
- Total profit
- $274,209
- Equity at exit
- $82,139
Cash invested: $266,000 (down + closing). Projections, not guarantees.
Landlord ↔ Tenant lean methodology
- Overall (CITY)
- 0 Strongly Tenant-Friendly
- State New York
- 15 Strongly Tenant-Friendly · D+10
- County
- — inherits STATE
- City New York
- 0 Strongly Tenant-Friendly · D+34
ZIP-level market 10465
- Rents YoY
- 10.7%
- Active inventory
- 215
- Price-to-rent
- 26.5×
Monthly cashflow live
- Estimated rent
- $8,976 medium interval (Pro) →
- Mortgage (P&I)
- −$4,982
- Tax from tax record
- −$607 /mo · $7,279/yr
- Insurance
- −$396
- HOA
- −$0
- Vacancy / Maint / Mgmt
- −$1,885
- Net cashflow
- $1,107
Break-even live
3-unit breakdown (identical units grouped — click to expand)
| Units | Beds | Baths | Est. rent |
|---|---|---|---|
| 3× units | 3 | 1.5 | $8,976 |
| #1 | 3 | 1.5 | $2,992 |
| #2 | 3 | 1.5 | $2,992 |
| #3 | 3 | 1.5 | $2,992 |
| Total (3 units) | $8,976 | ||
UW: 25.0% down · 7.5% · 30yr · 1.5% tax · 5.0% vac · 8.0% maint · 8.0% mgmt
Financing live
Cash to close
- Down payment
- $237,500
- Closing costs
- $28,500
- Reserves months
- —
- Total cash needed
- —
Loan-product check · same deal, 3 products live
Conventional
25% down · 7.5% · 30yr
- Down + closing
- —
- Monthly P&I
- —
- Monthly cashflow
- —
- DSCR
- —
- Eligible?
- —
Personal DTI + credit; lowest rate.
DSCR
20% down · 8.5% · 30yr
- Down + closing
- —
- Monthly P&I
- —
- Monthly cashflow
- —
- DSCR
- —
- Eligible?
- —
No personal income docs; deal must DSCR.
Hard money
10% down · 12.0% · 12mo
- Down + closing
- —
- Monthly P&I
- —
- Monthly cashflow
- —
- DSCR
- —
- Eligible?
- —
Short-term bridge; refi at stabilization.
Listing history 9 events
-
2026-06-18days on market $950,000 Active 8 DOM
-
2026-06-17days on market $950,000 Active 7 DOM
-
2026-06-16days on market $950,000 Active 6 DOM
-
2026-06-15days on market $950,000 Active 5 DOM
-
2026-06-13statusdays on market $950,000 Active 3 DOM
-
2026-06-09days on market $950,000 Coming Soon 5 DOM
-
2026-06-08days on market $950,000 Coming Soon 4 DOM
-
2026-06-07remarks 699-char remark
-
2026-06-07$950,000 Coming Soon 3 DOM
ⓘ Source: listings_history table (triggers on properties + properties_extension) + one-shot
backfill from property_details.listing_events for pre-trigger history.
Tax reassessment forecast NY · Partial reset (capped growth)
- Current annual tax
- $7,279 · $607/mo
- Projected year-2 tax
- $11,667 · $972/mo
- Expected delta
- +$4,388/yr (+$366/mo · 60.3%)
ⓘ Screening estimate from a state-policy table — verify with the county assessor before closing.
Climate risk First Street
- Flood 1/10 Low FEMA zone X (unshaded) · 0% chance over 30 yrs
- Wildfire 1/10 Low
- Heat 6/10 Major 7 d/yr ≥99°F today · 15 d/yr by 30 yrs out
- Wind 6/10 Major 27% chance of damaging wind over 30 yrs
- Air quality 4/10 Moderate 6 unhealthy d/yr today · 6 by 30 yrs out
Nearby sold comps map
Loading sold comps map…
Walkable amenities ~0.75 mi
Loading nearby amenities…
Taxation est. · year 1
- Rental income
- $107,712
- − Mortgage interest
- −$53,215
- − Property taxes
- −$7,279
- − Insurance
- −$4,750
- − Repairs & maintenance
- −$8,617
- − Management
- −$8,617
- − Depreciation
- −$27,636
- Taxable loss
- −$2,402
- Est. tax savings @ 24.0%
- +$576
- After-tax cash flow
- $13,857/yr
For passive investors: Depreciation is non-cash, so a rental often shows a tax loss while cash-flowing — sheltering income. Rental losses are passive: they offset passive income freely, and up to $25,000/yr can offset ordinary (W-2) income if you actively participate and your MAGI is under $100k (phasing out to $0 by $150k); unused losses carry forward. On sale, claimed depreciation is recaptured at up to 25%, and gains may owe capital-gains tax (a 1031 exchange can defer both). Figures are a year-1 estimate at your 24.0% rate — not tax advice; consult a CPA.
Schools (NCES district)
No district data.
Livability — New York
- Score
- 75/100
- State rank
- #268
- US rank
- #4188
Category grades
Schools grade is shown separately in the Schools card above.
Census & demographics
- Census place
- New York, NY
- County
- Bronx County · 1,197,324 people
- City population
- 7,731,280
- Metro
- New York-Newark-Jersey City, NY-NJ-PA
- Population (ZIP)
- 45,404
- Household income
- $87,985
- Rent vs Own
- Severe rent burden
- 2294.0
Population outlook (Bronx County) Hauer SSP2
- Today (2025)
- 1,607,353 people
- By 2030
- 1,681,852 · +4.6%
- By 2040
- 1,824,421 · +13.5%
- By 2050
- 1,945,470 · +21.0%
- By 2075
- 2,187,887 · +36.1%
- By 2100
- 2,244,136 · +39.6%
Race, ethnicity, and origin ACS 2023
- Neighborhood character
- Diverse neighborhood (Simpson 0.65)
- Race & ethnicity
- Hispanic / Latino 46% White 35% Two or more races 15% Black 10% Asian 6%
- Hispanic origin (detail)
- Mexican 1% Puerto Rican 24% Dominican 12%
- Common ancestry
- Lithuanian 1% Hispanic 1% Romanian 1%
- Foreign-born
- 19% · Canada, China
- Languages at home
- 57% English-only · Spanish 32% Other Indo-European 7% Chinese 1%
Political lean MEDSL · Bronx
- 2024 margin
- Solid D (+45.4) · D 72.7% · R 27.3%
- 2008→2024 swing
- -32.3pp toward R · 2008: 77.8pp · 2024: 45.4pp
- All cycles
- 2024: D+45.4 2020: D+67.6 2016: D+79.1 2012: D+82.9 2008: D+77.8
Not yet ingested
- Civics
- —
Market trends
- HPI YoY
- ▼ -283.74%
- Current HPI
- 270.517
- Rent YoY
- ▲ 10.74%
- Metro
- New York-Newark-Jersey City, NY-NJ-PA
- State GDP YoY
- ▲ 2.60%
- F500 in state
- 92
Industry mix (Fortune 500 HQ in NY)
| Industry | F500 HQs | Revenue |
|---|---|---|
| Financial Services | 10 | $950B |
|
||
| Consumer Goods | 9 | $162B |
|
||
| Insurance | 4 | $225B |
|
||
| Telecommunications | 2 | $144B |
|
||
| Pharmaceuticals | 2 | $112B |
|
||
| Media / Entertainment | 2 | $69B |
|
||
Price history
+14.6% since first listed4 events — show timeline
- 2026-06-05 Coming Soon $950,000 OneKey® MLS as Distributed by MLS Grid
- 2024-10-21 Listing Removed — OneKey® MLS as Distributed by MLS Grid
- 2024-10-21 Listed $849,000 OneKey® MLS as Distributed by MLS Grid
- 2023-09-13 Listed $829,000 OneKey® MLS as Distributed by MLS Grid
Property tax history
+5.8%/yrLatest (2025): $7,279 · +23.3% YoY. Source: county tax records.
Cash-flow waterfall
monthlySold comps — $/sqft
last 12 mo · ≤1 miLoading sold comps…