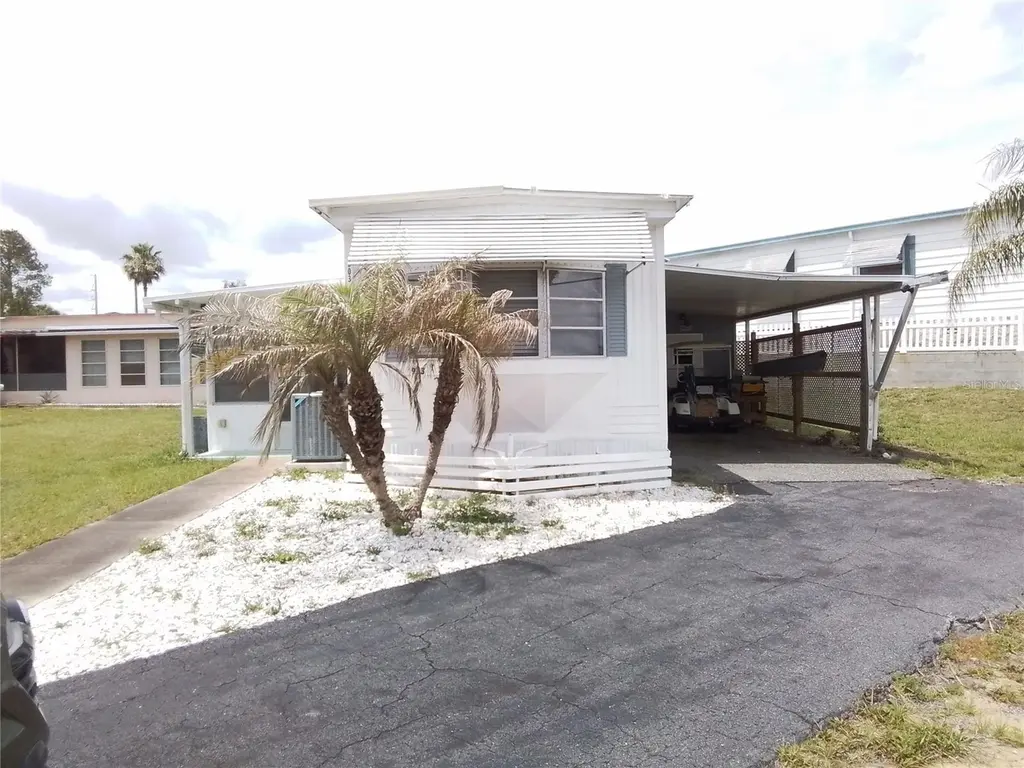
903 Mark Rd · Leesburg, FL
Flood risk 1/10 · Minimal
- FEMA flood zone
- X (unshaded)
- Chance of flooding over 30 yrs
- 0.0%
- Est. flood insurance / yr
- $507 – $1,088
Fire risk 3/10 · Minor
- Est. fire insurance / yr
- $947 – $1,759
Heat risk 8/10 · Major
- Hot days now (above 107°F)
- 7 days/yr
- Hot days in 30 yrs
- 22 days/yr
Wind risk 9/10 · Severe
- Chance of severe wind over 30 yrs
- 99.0%
Air-quality risk 2/10 · Minimal
- Unhealthy air days now
- 1 days/yr
- Unhealthy air days in 30 yrs
- 1 days/yr
Risk factors via First Street. Map © Google.
Why this score? — see what drove the B- grade
The composite is a weighted blend of 9 inputs, each scored 0–100. Each bar is that input's sub-score; the figure is the points it added to the 100-point composite (weight × sub-score).
- Cash flow +30.0/30.0
- 1% rule +10.0/10.0
- DSCR +10.0/10.0
- ARV discount +7.5/15.0
- Schools +4.2/10.0
- Livability +3.1/5.0
- Condition / age +2.5/5.0
- Rent growth +2.3/5.0
- Appreciation +0.0/10.0
$65,000
🖨 Deal sheet (PDF) 📄 Offer letter ✓ Due diligence
Listing remarks MLS
LOCATION LOCATION LOCATION!!! BEAUTIFUL 1/1 HOME IN A WATERFRONT COMMUNITY!! THIS HOME HAS MANY UPDATES WITH A NEW HVAC, ELECTRIC HOT WATER HEATER, COOLAROO SHADES, ELETRICAL OUTLETS HAVE BEEN UPDATED AND/OR ADDED, 2 NEW WINDOW AC UNITS, STAIRS, AWNINGS, NEWER CARPET IN SUNROOM, AND MUCH MORE. THIS HOME HAS BEEN FRESHLY PAINTED INSIDE AND OUT, FROM TOP TO BOTTOM. HOME COMES PARTIALLY FURNISHED WITH LINENS AND DISHES TOO. ALL APPLIANCES INCLUDED. HOME HAS BEEN WIRED FOR BOTH SATELLITE AND CABLE. GOLF CART INCLUED, CARPORT AND SHED. THE SHED IS 8 X 8. BRING YOUR FISHING POLE, 2 MINUTE WALK TO ONE OF THE BEAUTIFUL CHAIN OF LAKES RIGHT OUTSIDE YOUR DOORSTEPS!!!!
Key facts
- Pet-friendly
- Golf-cart friendly
- Waterfront living
Tags
Property features AI
Finance
- Other: Furnished; Third-party listing; Living area ~588 sq ft (public records)
- Financial info: Total monthly fees $160; total annual fees $1,920; Lease restrictions apply
- HOA & community: Located in Brittany Estates (association approval required); Monthly HOA $160 (required); Senior community; Pets allowed
Exterior
- Parking: Has carport (1 space)
- Utilities: Private water; Private sewer; Broadband/high-speed internet available; Cable available
- Home design: Residential mobile home (single wide); One level; Faces southeast; Homestead exempt
- Construction: Metal siding; Metal roof; Crawlspace foundation; Built as single wide
- Exterior features: Enclosed patio/porch; Storage; Near marina; Water access to Lake - Chain of Lakes
Interior
- Kitchen: Disposal; Range; Range hood; Refrigerator
- Bedrooms: 1 bedroom
- Flooring: Carpet; Laminate
- Bathrooms: 1 full bathroom
- Heating & cooling: Central heating; Central air; Wall/window unit(s)
- Interior features: Eat-in kitchen; Open floorplan; Window treatments
- Laundry & utility: Washer; Dryer; Electric water heater; Laundry: Other
Neighborhood map
What this means for you Summary
Snapshot
- This is a 1-bed/1.0-bath condo listed at $65k.
Deal economics
- At list price, monthly cash flow is $365 ($4k/yr) — positive.
- The deal already cash-flows at list — no discount required.
- Meets the 1% rule at list price ($1k rent vs $65k).
- Recommended offer: $64k (1.5% below list) — sets the bar for market timing.
- Cap rate 13.0% vs local median 4.4% in Leesburg — top-decile yield for the area; either an underpriced asset or a hidden risk that comps aren't pricing in. Stress-test before assuming the spread holds.
Location & tenants
- Location reads 62/100 on livability (#751 in FL) — a middle-class / working-renter tenant base. Strengths: cost of living A+, housing A+; Watch: crime D, amenities F, commute F.
- Lake (suburban): math 49% / reading 50% proficiency, ranked #37 of 73 in FL (top 51%) — families likely to look elsewhere, expect single-tenant / working-renter base with shorter leases.
- Zoned schools: Beverly Shores Elementary School (math 38% / reading 31%, grade F, #1,709 of 2,144 statewide, top 81%, 626 students, 73% FRL); Oak Park Middle School (math 32% / reading 36%, grade F, #426 of 571 statewide, top 75%, 575 students, 70% FRL); Leesburg High School (math 24% / reading 32%, grade F, #464 of 667 statewide, top 70%, 1,641 students, 58% FRL) — zoned schools average 67% FRL vs 49% district-wide (18 pts higher); higher-poverty schools than district average — tighter screening recommended.
- Zoned-school proficiency averages 32% at this address vs 50% district-wide (-17 pts) — the specific schools serving this property underperform the Lake average; the district grade overstates school quality for this exact location.
- Market conditions: Rents soft (-0.9%/yr); 798 active listings in the ZIP; 5 comparable units currently listed for rent nearby; rentals at typical pace (median 18d on market — plan ~3-4 weeks tenant-placement turnaround); 4,799 units permitted in Lake County in 2024 (814 in 5+ unit buildings).
Forward outlook
- Local home prices are declining (-3.0%/yr); year-one equity from $449 of loan paydown is wiped out by about $2k of value loss. Plan a longer hold.
- Lake County population projected at +37% by 2050 — long-run rental-demand tailwind backs the buy-and-hold thesis.
- At projected returns (-3.0% appreciation + 0.0% rent growth), your $18k cash investment doubles in ~7 years — after that, you're playing with house money.
Negotiation context
- It's been on market 19 days — a 2% lower offer ($64k) is reasonable based on typical stale-listing flexibility.
- 3 sale attempts since 7y ago with the ask held roughly flat each time — persistent listings suggest the price (not the market) is what's stuck; bring a comps-based counter.
- Current owner paid $42k; list at $65k implies a 57% gain — meaningful room to come down on a strong offer.
Risks & watch-outs
- Climate carrying-cost: severe wind risk, 99% chance of damaging wind over 30y; extreme-heat days projected 7→22/yr by 2055 (HVAC capex compounding) — expect insurance premiums to compound above CPI over the hold.
Questions for the listing agent
- Built in 1975 — when were the roof, HVAC, electrical panel, plumbing, and water heater last replaced?
- What does the HOA fee cover, when was the last increase, and are there any pending special assessments or reserve-fund shortfalls?
- Any open or pending special assessments — roof, HVAC, plumbing, elevator, façade? What's the per-unit balance and payoff schedule, and is the seller paying it off at close or rolling it to the buyer?
- Is there a deadline driving the sale (1031 exchange, divorce, estate, relocation)? That informs how much negotiation room exists.
- Schools are D-rated, which usually means shorter tenancies and higher turnover. Who's the typical renter profile here, and what's been the actual vacancy rate?
- Crime grade is D in this area — have there been break-ins, vandalism, or insurance claims at this property in the last 3 years? What carrier currently insures it and at what premium?
- What's the average days-on-market for RENTAL listings here right now (not sales)? A rising rental-DOM trend means longer vacancies and softer asking-rent achievability than the comps imply.
- What's the recent tenant-quality profile in this submarket — average credit score on applications, eviction rate, late-payment / NSF rate, and stable-employment percentage? A property-management company in the area should have these aggregated.
- How much new apartment / multifamily construction is in the pipeline within 1–3 miles? Heavy new supply (>2% of stock underway) typically softens rents 12–24 months out; light construction supports rent growth.
Investment metrics
- 1% rule
- 1.87% ✓
- Cap rate
- 13.03%
- Cash-on-cash
- 24.06%
- DSCR
- 2.07
- GRM
- 4.5
CMA / ARV
No comps found within radius.
Projected returns pro-forma
-3.0% appreciation · 0.0% rent growth · sell at horizon
- IRR
- 13.3%
- Equity multiple
- 1.51×
- Total profit
- $9,260
- Equity at exit
- $9,692
- IRR
- 19.3%
- Equity multiple
- 2.36×
- Total profit
- $24,679
- Equity at exit
- $5,620
Cash invested: $18,200 (down + closing). Projections, not guarantees.
Landlord ↔ Tenant lean methodology
- Overall (STATE)
- 87 Strongly Landlord-Friendly
- State Florida
- 87 Strongly Landlord-Friendly · R+3
- County
- — inherits STATE
- City
- — inherits STATE
ZIP-level market 34748
- Home prices YoY
- -25.3%
- Rents YoY
- -0.9%
- Active inventory
- 798
- Price-to-rent
- 4.5×
Monthly cashflow live
- Estimated rent
- $1,214 high interval (Pro) →
- Mortgage (P&I)
- −$341
- Tax from tax record
- −$66 /mo · $794/yr
- Insurance
- −$27
- HOA
- −$160
- Vacancy / Maint / Mgmt
- −$255
- Net cashflow
- $365
Break-even live
Sensitivity live
| Price | -10% $402 | -5% $383 | +0% $365 | +5% $347 | +10% $328 |
|---|---|---|---|---|---|
| Rent | -10% $269 | -5% $317 | +0% $365 | +5% $413 | +10% $461 |
| Rate | -1.0pp $398 | -0.5pp $381 | base $365 | +0.5pp $348 | +1.0pp $331 |
UW: 25.0% down · 7.5% · 30yr · 1.5% tax · 5.0% vac · 8.0% maint · 8.0% mgmt
Financing live
Cash to close
- Down payment
- $16,250
- Closing costs
- $1,950
- Reserves months
- —
- Total cash needed
- —
Loan-product check · same deal, 3 products live
Conventional
25% down · 7.5% · 30yr
- Down + closing
- —
- Monthly P&I
- —
- Monthly cashflow
- —
- DSCR
- —
- Eligible?
- —
Personal DTI + credit; lowest rate.
DSCR
20% down · 8.5% · 30yr
- Down + closing
- —
- Monthly P&I
- —
- Monthly cashflow
- —
- DSCR
- —
- Eligible?
- —
No personal income docs; deal must DSCR.
Hard money
10% down · 12.0% · 12mo
- Down + closing
- —
- Monthly P&I
- —
- Monthly cashflow
- —
- DSCR
- —
- Eligible?
- —
Short-term bridge; refi at stabilization.
Rent comps 5 comps
| Address | Beds | Baths | Sqft | Rent | $/sqft | DOM | Units | Dist |
|---|---|---|---|---|---|---|---|---|
| 205 Fern Dr Leesburg, FL | 2.0 | 1.0 | 584 | $1,275 | $2.18 | 18d | 1 | 0.71mi |
| 205 Fern Dr Leesburg, FL | 2.0 | 1.0 | 584 | $1,275 | $2.18 | 0d | 1 | 0.71mi |
| 1195 Bentley Rd Leesburg, FL | 1.0 | 1.0 | 629 | $1,099 | $1.75 | 25d | 1 | 1.10mi |
| 1185 Bentley Rd Leesburg, FL | 1.0 | 1.0 | 629 | $1,099 | $1.75 | 25d | 1 | 1.16mi |
| 420 Mills St Leesburg, FL | 1.0 | 1.0 | 576 | $999 | $1.73 | 5d | 2 | 1.21mi |
HOA detail condo
- Monthly dues
- $160 · $1,920/yr
- Likely covers
- waterelectriccable
- Assessments
- None detected in remarks — confirm with the listing agent.
Listing history 12 events
-
2026-06-21days on market $65,000 Active 19 DOM
-
2026-06-18days on market $65,000 Active 16 DOM
-
2026-06-17days on market $65,000 Active 15 DOM
-
2026-06-16days on market $65,000 Active 14 DOM
-
2026-06-15days on market $65,000 Active 13 DOM
-
2026-06-13days on market $65,000 Active 11 DOM
-
2026-06-09days on market $65,000 Active 7 DOM
-
2026-06-08days on market $65,000 Active 6 DOM
-
2026-06-07days on market $65,000 Active 5 DOM
-
2026-06-04days on market $65,000 Active 2 DOM
-
2026-06-02remarks 532-char remark
-
2026-06-02$65,000 Active 1 DOM
ⓘ Source: listings_history table (triggers on properties + properties_extension) + one-shot
backfill from property_details.listing_events for pre-trigger history.
Tax reassessment forecast FL · Resets to sale price
- Current annual tax
- $794 · $66/mo
- Projected year-2 tax
- $794 · $66/mo
- Expected delta
- $0/yr ($0/mo · 0.0%)
ⓘ Screening estimate from a state-policy table — verify with the county assessor before closing.
Climate risk First Street
- Flood 1/10 Low FEMA zone X (unshaded) · 0% chance over 30 yrs
- Wildfire 3/10 Moderate
- Heat 8/10 Severe 7 d/yr ≥107°F today · 22 d/yr by 30 yrs out
- Wind 9/10 Extreme 99% chance of damaging wind over 30 yrs
- Air quality 2/10 Low 1 unhealthy d/yr today · 1 by 30 yrs out
Nearby sold comps map
Loading sold comps map…
Walkable amenities ~0.75 mi
Loading nearby amenities…
Taxation est. · year 1
- Rental income
- $14,568
- − Mortgage interest
- −$3,641
- − Property taxes
- −$794
- − Insurance
- −$325
- − Repairs & maintenance
- −$1,165
- − Management
- −$1,165
- − HOA
- −$1,920
- − Depreciation
- −$1,891
- Taxable income
- $3,666
- Est. tax owed @ 24.0%
- −$880
- After-tax cash flow
- $3,499/yr
For passive investors: Depreciation is non-cash, so a rental often shows a tax loss while cash-flowing — sheltering income. Rental losses are passive: they offset passive income freely, and up to $25,000/yr can offset ordinary (W-2) income if you actively participate and your MAGI is under $100k (phasing out to $0 by $150k); unused losses carry forward. On sale, claimed depreciation is recaptured at up to 25%, and gains may owe capital-gains tax (a 1031 exchange can defer both). Figures are a year-1 estimate at your 24.0% rate — not tax advice; consult a CPA.
Schools (NCES district)
- District
- Lake
- NCES district ID
- 1201050
- Math proficiency
- 49% ▼ -7.00%
- Reading proficiency
- 50% ▼ -4.00%
- Median HH income
- $46,632
- Composite
- 42.05/100
- National rank
- #3327
- State rank
- #37 of 73 in FL
Livability — Leesburg
- Score
- 62/100
- State rank
- #751
- US rank
- #16429
Category grades
Schools grade is shown separately in the Schools card above.
Census & demographics
- County
- Lake County · 364,602 people
- City population
- 70,232
- Metro
- Orlando-Kissimmee-Sanford, FL
- Population (ZIP)
- 48,095
- Household income
- $58,192
- Rent vs Own
- Severe rent burden
- 1745.0
Population outlook (Lake County) Hauer SSP2
- Today (2025)
- 386,640 people
- By 2030
- 417,107 · +7.9%
- By 2040
- 476,676 · +23.3%
- By 2050
- 531,296 · +37.4%
- By 2075
- 648,303 · +67.7%
- By 2100
- 698,530 · +80.7%
Race, ethnicity, and origin ACS 2023
- Neighborhood character
- Majority White (64%)
- Race & ethnicity
- White 64% Black 16% Hispanic / Latino 15% Two or more races 9% Asian 1%
- Hispanic origin (detail)
- Mexican 4% Puerto Rican 5% Cuban 3%
- Common ancestry
- Romanian 3% Lithuanian 3% Slovak 2%
- Foreign-born
- 9% · Canada, Vietnam, Jamaica
- Languages at home
- 88% English-only · Spanish 10% French/Haitian/Cajun 1%
Political lean MEDSL · Lake
- 2024 margin
- Strong R (+24.7) · D 37.3% · R 62.0%
- 2008→2024 swing
- -11.2pp toward R · 2008: -13.5pp · 2024: -24.7pp
- All cycles
- 2024: R+24.7 2020: R+20.0 2016: R+23.1 2012: R+17.1 2008: R+13.5
Not yet ingested
- Civics
- —
Market trends
- HPI YoY
- ▼ -88.97%
- Current HPI
- 262.1766
- Rent YoY
- ▼ -0.95%
- Metro
- Orlando-Kissimmee-Sanford, FL
- State GDP YoY
- ▲ 3.28%
- F500 in state
- 36
Industry mix (Fortune 500 HQ in FL)
| Industry | F500 HQs | Revenue |
|---|---|---|
| Industrial Technology | 2 | $29B |
|
||
| Insurance | 2 | $17B |
|
||
| Retail | 1 | $60B |
|
||
| Technology Distribution | 1 | $58B |
|
||
| Homebuilding | 1 | $35B |
|
||
| Technology Manufacturing | 1 | $35B |
|
||
Price history
+48.1% since first listed8 events — show timeline
- 2026-06-02 Listed $65,000 Stellar MLS as Distributed by MLS Grid
- 2019-07-11 Sold (MLS) $41,500 Stellar MLS as Distributed by MLS Grid
- 2019-06-19 Pending — Stellar MLS as Distributed by MLS Grid
- 2019-05-24 Price Changed $41,500 Stellar MLS as Distributed by MLS Grid
- 2019-05-08 Price Changed $43,400 Stellar MLS as Distributed by MLS Grid
- 2019-03-26 Listed $43,900 Stellar MLS as Distributed by MLS Grid
- 2019-03-25 Listing Removed — Stellar MLS as Distributed by MLS Grid
- 2019-02-04 Listed $43,900 Stellar MLS as Distributed by MLS Grid
Property tax history
+4.4%/yrLatest (2025): $794 · -3.1% YoY. Source: county tax records.
Cash-flow waterfall
monthlySold comps — $/sqft
last 12 mo · ≤1 miLoading sold comps…