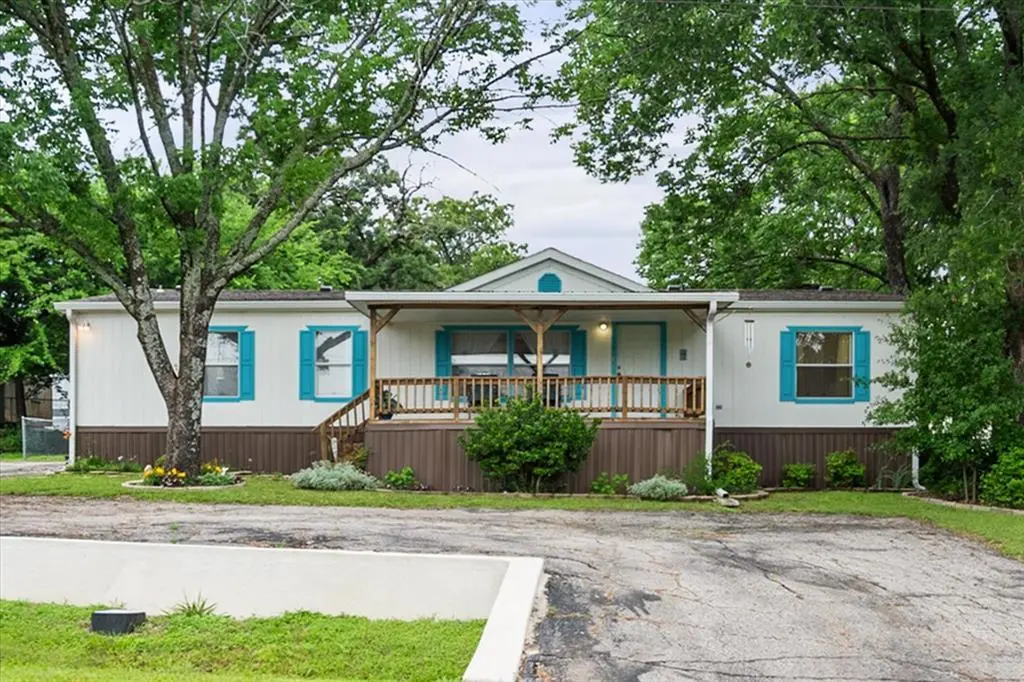
510 Nob Hill Ln · Seven Points, TX
Flood risk No data
- FEMA flood zone
- —
- Chance of flooding over 30 yrs
- —
- Est. flood insurance / yr
- —
Fire risk No data
- Est. fire insurance / yr
- —
Heat risk No data
- Hot days now (above threshold)
- —
- Hot days in 30 yrs
- —
Wind risk No data
- Chance of severe wind over 30 yrs
- —
Air-quality risk No data
- Unhealthy air days now
- —
- Unhealthy air days in 30 yrs
- —
Risk factors via First Street. Map © Google.
Why this score? — see what drove the B grade
The composite is a weighted blend of 9 inputs, each scored 0–100. Each bar is that input's sub-score; the figure is the points it added to the 100-point composite (weight × sub-score).
- Cash flow +30.0/30.0
- ARV discount +15.0/15.0
- DSCR +10.0/10.0
- 1% rule +9.3/10.0
- Livability +3.0/5.0
- Schools +2.6/10.0
- Rent growth +2.5/5.0
- Condition / age +2.5/5.0
- Appreciation +0.0/10.0
$199,900
🖨 Deal sheet 📄 Offer letter ✓ Due diligence
Listing remarks MLS
The gorgeous lake view and the constant breeze on the covered 10X20 front deck of this water view home overlooking Cedar Creek Lake is breath taking. Updated 4/2 split floor plan home with open kitchen and living room for entertaining will make the perfect home on the lake. Fenced in back yard is perfect for your pets with a storage shed for your outdoor toys. Neighborhood has a boat ramp and a park. This one won't last long. Call for showing!
Key facts
- New retaining wall
- Walk-in closet
- New hvac
Tags
Property features AI
Finance
- Financial info: Listing accepts Cash, Conventional, and FHA financing
- HOA & community: Mandatory association (Oak Landing); Annual HOA fee; Association covers full use of facilities; Community boat ramp
Exterior
- Parking: Circular driveway; No garage or covered/carport spaces
- Utilities: City sewer; Co-op electric; MUD water; Located in a Municipal Utility District (MUD)
- Home design: Single family residence; Residential property; One story; Deed restrictions
- Construction: Built in 2005; Aluminum siding; Composition roof; Pillar/post/pier foundation
- Exterior features: Covered porch(es); Chain link fencing; Few trees; Water/lake view; Storage structure
Interior
- Kitchen: Granite countertops; Built-in cabinets; Pantry; Water line to refrigerator; Dishwasher; Disposal; Electric range; Ice maker; Refrigerator
- Bedrooms: 4 bedrooms (all on main level); Primary bedroom on main level with dual sinks and walk-in closet
- Flooring: Carpet; Laminate
- Bathrooms: 2 full bathrooms
- Heating & cooling: Central heating; Central air conditioning
- Interior features: Eat-in kitchen; High speed internet available; Wainscoting; Walk-in closets; One living area; One dining area; Total of 7 rooms; One level
- Laundry & utility: Washer; Dryer
Neighborhood map
What this means for you Summary
Snapshot
- This is a 4-bed/2.0-bath manufactured listed at $200k.
Deal economics
- At list price, monthly cash flow is $846 ($10k/yr) — positive.
- The deal already cash-flows at list — no discount required.
- Meets the 1% rule at list price ($3k rent vs $200k).
- Recommended offer: $194k (3.0% below list) — sets the bar for market timing.
- Cap rate 11.4% vs local median 3.1% in Seven Points — top-decile yield for the area; either an underpriced asset or a hidden risk that comps aren't pricing in. Stress-test before assuming the spread holds.
Location & tenants
- Location reads 60/100 on livability (#1,063 in TX) — a middle-class / working-renter tenant base. Strengths: cost of living A+, housing A+, crime B+; Watch: employment D, amenities F, commute F.
- Kemp ISD (rural): math 33% / reading 29% proficiency, ranked #605 of 826 in TX (top 73%) — families likely to look elsewhere, expect single-tenant / working-renter base with shorter leases.
- Zoned schools: Kemp Pri (503 students, 81% FRL) — zoned schools average 81% FRL vs 54% district-wide (27 pts higher); higher-poverty schools than district average — tighter screening recommended.
- Market conditions: 440 active listings in the ZIP; 1 comparable units currently listed for rent nearby; 263 units permitted in Henderson County in 2024 (0 in 5+ unit buildings).
Forward outlook
- Local home prices are declining (-3.0%/yr); year-one equity from $1k of loan paydown is wiped out by about $6k of value loss. Plan a longer hold.
- At projected returns (-3.0% appreciation + 3.0% rent growth), your $56k cash investment doubles in ~7 years — after that, you're playing with house money.
Negotiation context
- It's been on market 55 days — a 3% lower offer ($194k) is reasonable based on typical stale-listing flexibility.
- 10 sale attempts since 9y ago with the ask held roughly flat each time — persistent listings suggest the price (not the market) is what's stuck; bring a comps-based counter.
Questions for the listing agent
- It's been on market 55 days. Have you received any prior offers? Is the seller open to a 3% concession, seller financing, or rate buy-down credit?
- What does the HOA fee cover, when was the last increase, and are there any pending special assessments or reserve-fund shortfalls?
- Is there a deadline driving the sale (1031 exchange, divorce, estate, relocation)? That informs how much negotiation room exists.
- Schools are F-rated, which usually means shorter tenancies and higher turnover. Who's the typical renter profile here, and what's been the actual vacancy rate?
- What's the average days-on-market for RENTAL listings here right now (not sales)? A rising rental-DOM trend means longer vacancies and softer asking-rent achievability than the comps imply.
- What's the recent tenant-quality profile in this submarket — average credit score on applications, eviction rate, late-payment / NSF rate, and stable-employment percentage? A property-management company in the area should have these aggregated.
- How much new for-sale + rental construction is in the pipeline within 1–3 miles? Heavy new supply typically softens prices + rents 12–24 months out; constrained supply supports both.
Investment metrics
- 1% rule
- 1.43% ✓
- Cap rate
- 11.37%
- Cash-on-cash
- 18.14%
- DSCR
- 1.81
- GRM
- 5.8
CMA / ARV
- ARV (median comp)
- $240,479
- List price
- $199,900
- Delta
- -16.87%
- Verdict
- UNDERPRICED
- Comps
- 20 within 1.0 mi
Show comp detail 3 sales within ~0.75 mi
| Address | Dist | Beds/Ba | Sqft | Sold | Price | $/sf | Match |
|---|---|---|---|---|---|---|---|
| 232 Sacremento Blvd | 0.36mi | 3/2.0 (-1) | 1,624 (+4%) | 2mo | $110,000 | $68 | 71 |
| 517 Pine St | 0.22mi | 3/2.0 (-1) | 1,736 (+11%) | 6mo | $150,000 | $86 | 62 |
| 1040 Red Bird | 0.50mi | 4/2.0 | 1,400 (-11%) | 13mo | $65,000 | $46 | 48 |
Match score weights: distance 35% · size 25% · config 20% · recency 20%. Top-matched comps best support the ARV.
Projected returns pro-forma
-3.0% appreciation · 3.0% rent growth · sell at horizon
- IRR
- 9.8%
- Equity multiple
- 1.38×
- Total profit
- $21,541
- Equity at exit
- $29,806
- IRR
- 18.9%
- Equity multiple
- 2.58×
- Total profit
- $88,366
- Equity at exit
- $17,284
Cash invested: $55,972 (down + closing). Projections, not guarantees.
Landlord ↔ Tenant lean methodology
- Overall (STATE)
- 87 Strongly Landlord-Friendly
- State Texas
- 87 Strongly Landlord-Friendly · R+5
- County
- — inherits STATE
- City
- — inherits STATE
ZIP-level market 75143
- Home prices YoY
- -11.4%
- Active inventory
- 440
- Price-to-rent
- 5.8×
Monthly cashflow live
- Estimated rent
- $2,850 medium interval (Pro) →
- Mortgage (P&I)
- −$1,048
- Tax from tax record
- −$262 /mo · $3,144/yr
- Insurance
- −$83
- HOA
- −$12
- Vacancy / Maint / Mgmt
- −$598
- Net cashflow
- $846
Break-even live
UW: 25.0% down · 7.5% · 30yr · 1.5% tax · 5.0% vac · 8.0% maint · 8.0% mgmt
Financing live
Cash to close
- Down payment
- $49,975
- Closing costs
- $5,997
- Reserves months
- —
- Total cash needed
- —
Loan-product check · same deal, 3 products live
Conventional
25% down · 7.5% · 30yr
- Down + closing
- —
- Monthly P&I
- —
- Monthly cashflow
- —
- DSCR
- —
- Eligible?
- —
Personal DTI + credit; lowest rate.
DSCR
20% down · 8.5% · 30yr
- Down + closing
- —
- Monthly P&I
- —
- Monthly cashflow
- —
- DSCR
- —
- Eligible?
- —
No personal income docs; deal must DSCR.
Hard money
10% down · 12.0% · 12mo
- Down + closing
- —
- Monthly P&I
- —
- Monthly cashflow
- —
- DSCR
- —
- Eligible?
- —
Short-term bridge; refi at stabilization.
Rent comps 1 comps
| Address | Beds | Baths | Sqft | Rent | $/sqft | DOM | Units | Dist |
|---|---|---|---|---|---|---|---|---|
| 1340 E Cedar Creek Pkwy Kemp, TX | 3.0 | 2.0 | 1330 | $2,850 | $2.14 | 43d | 1 | 0.50mi |
HOA detail
- Monthly dues
- $12 · $144/yr
- Likely covers
- water
Listing history 41 events
-
2026-06-18days on market $199,900 Active 55 DOM
-
2026-06-17days on market $199,900 Active 54 DOM
-
2026-06-16days on market $199,900 Active 53 DOM
-
2026-06-15days on market $199,900 Active 52 DOM
-
2026-06-13days on market $199,900 Active 50 DOM
-
2026-06-13days on market $199,900 Active 49 DOM
-
2026-06-09days on market $199,900 Active 46 DOM
-
2026-06-08days on market $199,900 Active 45 DOM
-
2026-06-07days on market $199,900 Active 44 DOM
-
2026-06-04days on market $199,900 Active 41 DOM
-
2026-06-03days on market $199,900 Active 40 DOM
-
2026-06-02days on market $199,900 Active 39 DOM
-
2026-06-01days on market $199,900 Active 38 DOM
-
2026-05-31days on market $199,900 Active 37 DOM
-
2026-04-24$199,900 Active 1064-char remark
-
2021-08-06soldstatus
-
2021-07-30soldstatus 447-char remark
Show marketing remark (447 chars)
The gorgeous lake view and the constant breeze on the covered 10X20 front deck of this water view home overlooking Cedar Creek Lake is breath taking. Updated 4/2 split floor plan home with open kitchen and living room for entertaining will make the perfect home on the lake. Fenced in back yard is perfect for your pets with a storage shed for your outdoor toys. Neighborhood has a boat ramp and a park. This one won't last long. Call for showing!
-
2021-06-12$152,500 447-char remark
Show marketing remark (447 chars)
The gorgeous lake view and the constant breeze on the covered 10X20 front deck of this water view home overlooking Cedar Creek Lake is breath taking. Updated 4/2 split floor plan home with open kitchen and living room for entertaining will make the perfect home on the lake. Fenced in back yard is perfect for your pets with a storage shed for your outdoor toys. Neighborhood has a boat ramp and a park. This one won't last long. Call for showing!
-
2021-01-05soldstatus
-
2020-12-30soldstatus
Show marketing remark (486 chars)
Come view today! This Four bdrm, Two bath home sits on the hill with wonderful Water Views! Split bedroom floorplan; Large master bedroom has walk-in closet; Open Living, Kitchen, Dining area is great for entertaining! Chainlink Fenced backyard with storage building. Lots of parking with driveway and a circle drive! Relax on your 10X20 covered front porch with a tall glass of sweet tea and enjoy the views of Cedar Creek Lake! Neighborhood has boat ramp and park. Call for a showing!
-
2020-12-30soldstatus Sold
Show marketing remark (486 chars)
Come view today! This Four bdrm, Two bath home sits on the hill with wonderful Water Views! Split bedroom floorplan; Large master bedroom has walk-in closet; Open Living, Kitchen, Dining area is great for entertaining! Chainlink Fenced backyard with storage building. Lots of parking with driveway and a circle drive! Relax on your 10X20 covered front porch with a tall glass of sweet tea and enjoy the views of Cedar Creek Lake! Neighborhood has boat ramp and park. Call for a showing!
-
2020-12-11status Pending
-
2020-11-03historical Active Contingent
-
2020-09-23status Active
-
2020-09-14historical Active Option Contract
-
2020-07-06$125,000
Show marketing remark (486 chars)
Come view today! This Four bdrm, Two bath home sits on the hill with wonderful Water Views! Split bedroom floorplan; Large master bedroom has walk-in closet; Open Living, Kitchen, Dining area is great for entertaining! Chainlink Fenced backyard with storage building. Lots of parking with driveway and a circle drive! Relax on your 10X20 covered front porch with a tall glass of sweet tea and enjoy the views of Cedar Creek Lake! Neighborhood has boat ramp and park. Call for a showing!
-
2020-07-03$125,000 Active
-
2020-04-02historical
-
2019-12-11price $140,000
-
2019-12-04$150,000 Active
-
2018-02-15soldstatus
-
2018-02-06soldstatus
-
2017-12-01$89,500
-
2017-10-27historical
-
2017-10-25status Active
-
2017-09-03status Pending
-
2017-04-14status Active
-
2017-04-08status Pending
-
2017-03-13$100,000 Active
-
2005-03-15soldstatus
-
1999-09-28soldstatus
ⓘ Source: listings_history table (triggers on properties + properties_extension) + one-shot
backfill from property_details.listing_events for pre-trigger history.
Tax reassessment forecast TX · Resets to sale price
- Current annual tax
- $3,144 · $262/mo
- Projected year-2 tax
- $3,658 · $305/mo
- Expected delta
- +$514/yr (+$43/mo · 16.3%)
ⓘ Screening estimate from a state-policy table — verify with the county assessor before closing.
Nearby sold comps map
Loading sold comps map…
Walkable amenities ~0.75 mi
Loading nearby amenities…
Taxation est. · year 1
- Rental income
- $34,200
- − Mortgage interest
- −$11,198
- − Property taxes
- −$3,144
- − Insurance
- −$1,000
- − Repairs & maintenance
- −$2,736
- − Management
- −$2,736
- − HOA
- −$144
- − Depreciation
- −$5,815
- Taxable income
- $7,428
- Est. tax owed @ 24.0%
- −$1,783
- After-tax cash flow
- $8,368/yr
For passive investors: Depreciation is non-cash, so a rental often shows a tax loss while cash-flowing — sheltering income. Rental losses are passive: they offset passive income freely, and up to $25,000/yr can offset ordinary (W-2) income if you actively participate and your MAGI is under $100k (phasing out to $0 by $150k); unused losses carry forward. On sale, claimed depreciation is recaptured at up to 25%, and gains may owe capital-gains tax (a 1031 exchange can defer both). Figures are a year-1 estimate at your 24.0% rate — not tax advice; consult a CPA.
Schools (NCES district)
- District
- Kemp ISD
- NCES district ID
- 4825320
- Math proficiency
- 33% ▼ -11.00%
- Reading proficiency
- 29% ▼ -5.00%
- Median HH income
- $42,788
- Composite
- 26.37/100
- National rank
- #7233
- State rank
- #605 of 826 in TX
Livability — Seven Points
- Score
- 60/100
- State rank
- #1063
- US rank
- #18899
Category grades
Schools grade is shown separately in the Schools card above.
Census & demographics
- Census place
- Seven Points, TX
- Population (ZIP)
- 14,676
Population outlook (Henderson County) Hauer SSP2
- Today (2025)
- 80,471 people
- By 2030
- 80,608 · +0.2%
- By 2040
- 80,087 · -0.5%
- By 2050
- 78,208 · -2.8%
- By 2075
- 72,423 · -10.0%
- By 2100
- 61,012 · -24.2%
Race, ethnicity, and origin ACS 2023
- Neighborhood character
- Predominantly White (80%)
- Race & ethnicity
- White 80% Hispanic / Latino 13% Two or more races 8% Black 2%
- Hispanic origin (detail)
- Mexican 13%
- Common ancestry
- Italian 2% Iranian 2% Lithuanian 1%
- Foreign-born
- 4% · Canada, China
- Languages at home
- 90% English-only · Spanish 9%
Political lean MEDSL · Henderson
- 2024 margin
- Solid R (+63.5) · D 18.0% · R 81.4%
- 2008→2024 swing
- -18.8pp toward R · 2008: -44.6pp · 2024: -63.5pp
- All cycles
- 2024: R+63.5 2020: R+60.2 2016: R+60.0 2012: R+54.8 2008: R+44.6
Not yet ingested
- Civics
- —
Market trends
- HPI YoY
- ▼ -42.99%
- Current HPI
- 332.57
- Rent YoY
- —
- Metro
- —
- State GDP YoY
- ▲ 3.95%
- F500 in state
- 110
Industry mix (Fortune 500 HQ in TX)
| Industry | F500 HQs | Revenue |
|---|---|---|
| Energy | 16 | $1,198B |
|
||
| Technology | 5 | $198B |
|
||
| Engineering / Construction | 4 | $72B |
|
||
| Energy Services | 3 | $60B |
|
||
| Utilities | 3 | $41B |
|
||
| Healthcare | 2 | $330B |
|
||
Price history
+99.9% since first listed27 events — show timeline
- 2026-04-24 Listed $199,900 NTREIS
- 2021-08-06 Sold (Public Records) — Public Records
- 2021-07-30 Sold (MLS) — GTAR
- 2021-06-12 Listed $152,500 GTAR
- 2021-01-05 Sold (Public Records) — Public Records
- 2020-12-30 Sold (MLS) — NTREIS
- 2020-12-30 Sold (MLS) — HCBOR
- 2020-12-11 Pending — NTREIS
- 2020-11-03 Contingent — NTREIS
- 2020-09-23 Relisted — NTREIS
- 2020-09-14 Contingent — NTREIS
- 2020-07-06 Listed $125,000 HCBOR
- 2020-07-03 Listed $125,000 NTREIS
- 2020-04-02 Listing Removed — NTREIS
- 2019-12-11 Price Changed $140,000 NTREIS
- 2019-12-04 Listed $150,000 NTREIS
- 2018-02-15 Sold (Public Records) — Public Records
- 2018-02-06 Sold (MLS) — HCBOR
- 2017-12-01 Listed $89,500 HCBOR
- 2017-10-27 Listing Removed — NTREIS
- 2017-10-25 Relisted — NTREIS
- 2017-09-03 Pending — NTREIS
- 2017-04-14 Relisted — NTREIS
- 2017-04-08 Pending — NTREIS
- 2017-03-13 Listed $100,000 NTREIS
- 2005-03-15 Sold (Public Records) — Public Records
- 1999-09-28 Sold (Public Records) — Public Records
Property tax history
+9.4%/yrLatest (2025): $3,144 · +22.2% YoY. Source: county tax records.
Cash-flow waterfall
monthlySold comps — $/sqft
last 12 mo · ≤1 miLoading sold comps…