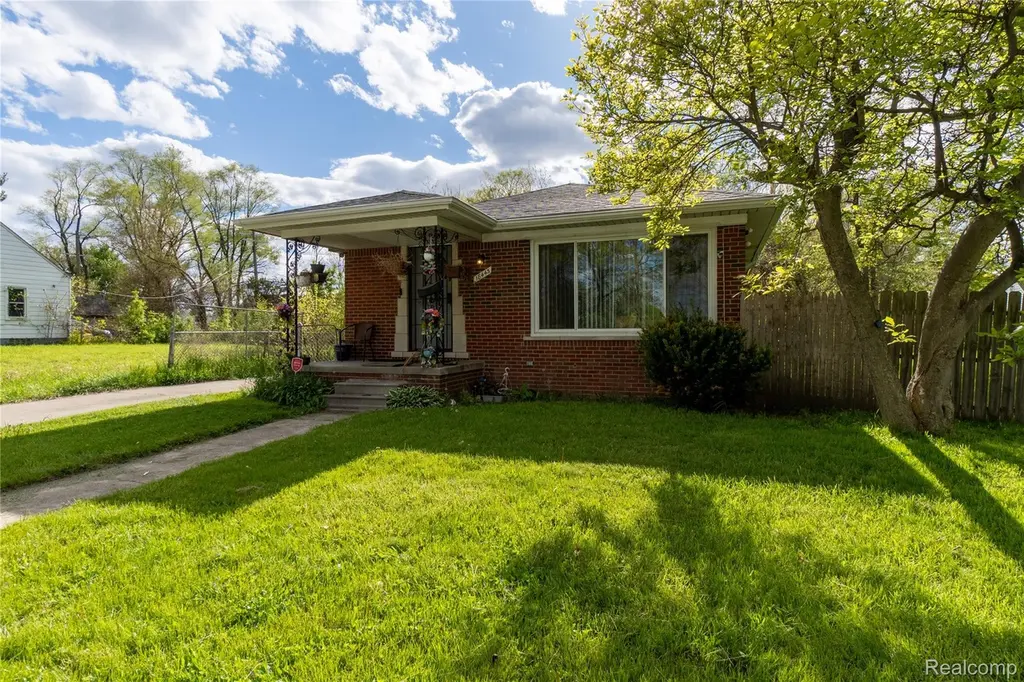
18445 Helen St · Detroit, MI
Flood risk 1/10 · Minimal
- FEMA flood zone
- X (unshaded)
- Chance of flooding over 30 yrs
- 0.0%
- Est. flood insurance / yr
- $473 – $860
Fire risk 1/10 · Minimal
- Est. fire insurance / yr
- $784 – $1,456
Heat risk 3/10 · Minor
- Hot days now (above 97°F)
- 7 days/yr
- Hot days in 30 yrs
- 15 days/yr
Wind risk 2/10 · Minimal
- Chance of severe wind over 30 yrs
- —
Air-quality risk 3/10 · Minor
- Unhealthy air days now
- 2 days/yr
- Unhealthy air days in 30 yrs
- 5 days/yr
Risk factors via First Street. Map © Google.
Why this score? — see what drove the D+ grade
The composite is a weighted blend of 9 inputs, each scored 0–100. Each bar is that input's sub-score; the figure is the points it added to the 100-point composite (weight × sub-score).
- Cash flow +16.2/30.0
- ARV discount +7.5/15.0
- 1% rule +7.1/10.0
- DSCR +5.0/10.0
- Rent growth +4.2/5.0
- Livability +3.7/5.0
- Condition / age +2.5/5.0
- Schools +1.3/10.0
- Appreciation +0.0/10.0
$101,000
🖨 Deal sheet 📄 Offer letter ✓ Due diligence
Listing remarks MLS
18445 Helen St is a 999 square foot house on a 6,098 square foot lot with 2 bedrooms and 1 full bathroom and one half. This home provides a HUGE lot next to the property and is included in the sale. The approximate size is 0.135 acre. Freshly remodeled in 2025 with everything brand new. Conveniently located near freeway access, local shopping, restaurants, schools, and parks, this move-in-ready property features a brand-new kitchen, updated bathroom, fresh flooring, new paint, 2025 roof, new sliding windows and doors providing a peace of mind for the new owner. Perfect for first-time homebuyers or investors seeking a solid addition to their portfolio. Schedule your showing today before it's gone! BATVAI, all measurements are estimated as taken from public records.
Key facts
- Fresh flooring
- 2025 roof
- New paint
Tags
Property features AI
Finance
- Other: Located in RAMM & COS North Detroit subdivision; Directions: Northeast Detroit near intersection of Nevada and Ryan Rd; cross streets E Hildale St and Stockton Ave
Exterior
- Parking: Detached driveway; Detached garage with 1.5 car capacity
- Utilities: Public water; Public sewer
- Home design: Single-family residence; One level; Ground-level entry
- Construction: Brick construction; Brick/mortar foundation; Built with shingle roof not specified
- Exterior features: Paved road access; Lot approximately 0.14 acres (51.6 x 114)
Interior
- Kitchen: Dishwasher; Free-standing gas range; Microwave
- Bedrooms: 2 total rooms
- Bathrooms: 1 full bathroom; 1 half bathroom
- Heating & cooling: Forced air heating (natural gas); No central cooling
- Interior features: Partially finished basement; Basement present
- Laundry & utility: Washer; Dryer
Neighborhood map
What this means for you Summary
Snapshot
- This is a 3-bed/1.0-bath single-family listed at $101k.
Deal economics
- At list price, monthly cash flow is $53 ($633/yr) — positive.
- The deal already cash-flows at list — no discount required.
- Meets the 1% rule at list price ($1k rent vs $101k).
- Cap rate 6.9% vs local median 10.2% in Detroit — below-typical yield; the buyer is paying a premium for something (appreciation thesis, condition, location) that the cap rate doesn't capture.
Location & tenants
- Location reads 73/100 on livability (#218 in MI) — a middle-class / working-renter tenant base. Strengths: amenities A+, commute A+, cost of living A+; Watch: schools F, crime F, employment F.
- Detroit Public Schools Community District (urban): math 10% / reading 24% proficiency, ranked #499 of 540 in MI (top 92%) — low school quality limits family demand, transient renter base, plan for 1-2y turnover; 90% free/reduced lunch — lower-income household profile, screen leases tightly.
- Market conditions: Rents rising fast (+6.7%/yr); 226 active listings in the ZIP; 17 comparable units currently listed for rent nearby; rentals at typical pace (median 22d on market — plan ~3-4 weeks tenant-placement turnaround); lower-income renter base — watch delinquency; 2,639 units permitted in Wayne County in 2024 (1,216 in 5+ unit buildings).
- This rent runs 41% of the median local income ($35k/yr) — at the standard rent-burdened threshold; future hikes will face affordability resistance.
Forward outlook
- Local home prices are declining (-3.0%/yr); year-one equity from $698 of loan paydown is wiped out by about $3k of value loss. Plan a longer hold.
- Wayne County population projected at -17% by 2050 — secular population decline; favor cash flow + early exit over multi-decade hold.
Negotiation context
- Only 1 days on market — expect competitive offers; lowballing is unlikely to land.
- 4 sale attempts with the ask held roughly flat each time — persistent listings suggest the price (not the market) is what's stuck; bring a comps-based counter.
- Current owner paid $20k; list at $101k implies a 405% gain — meaningful room to come down on a strong offer.
Risks & watch-outs
- Watch-outs: property tax is 4.0% of price; built in 1956 — expect roof / HVAC / electrical / plumbing capex.
Questions for the listing agent
- Built in 1956 — when were the roof, HVAC, electrical panel, plumbing, and water heater last replaced?
- Property tax is high relative to price — has the assessment been appealed recently, and will the sale trigger a re-assessment?
- Is there a deadline driving the sale (1031 exchange, divorce, estate, relocation)? That informs how much negotiation room exists.
- Schools are F-rated, which usually means shorter tenancies and higher turnover. Who's the typical renter profile here, and what's been the actual vacancy rate?
- Crime grade is F in this area — have there been break-ins, vandalism, or insurance claims at this property in the last 3 years? What carrier currently insures it and at what premium?
- The area grade is low — what's the realistic commute time and amenity access for the typical tenant pool here? Any planned neighborhood developments (good or bad) we should know about?
- What's the average days-on-market for RENTAL listings here right now (not sales)? A rising rental-DOM trend means longer vacancies and softer asking-rent achievability than the comps imply.
- What's the recent tenant-quality profile in this submarket — average credit score on applications, eviction rate, late-payment / NSF rate, and stable-employment percentage? A property-management company in the area should have these aggregated.
- How much new for-sale + rental construction is in the pipeline within 1–3 miles? Heavy new supply typically softens prices + rents 12–24 months out; constrained supply supports both.
Investment metrics
- 1% rule
- 1.21% ✓
- Cap rate
- 6.92%
- Cash-on-cash
- 2.24%
- DSCR
- 1.10
- GRM
- 6.9
CMA / ARV
- ARV (on-the-fly)
- $57,942
- Comps found
- 12
Show comp detail 12 sales within ~0.75 mi
| Address | Dist | Beds/Ba | Sqft | Sold | Price | $/sf | Match |
|---|---|---|---|---|---|---|---|
| 18810 Carrie St | 0.23mi | 3/1.0 | 982 (-2%) | 12mo | $86,000 | $88 | 77 |
| 19161 Rogge St | 0.40mi | 3/1.0 | 1,001 (+0%) | 8mo | $46,500 | $46 | 75 |
| 7505 E Robinwood St | 0.31mi | 4/2.0 (+1) | 1,000 (+0%) | 3mo | $140,500 | $141 | 74 |
| 18818 Sherwood St | 0.24mi | 3/1.0 | 940 (-6%) | 6mo | $38,000 | $40 | 74 |
| 8154 Quinn St | 0.56mi | 3/1.0 | 1,015 (+2%) | 9mo | $22,000 | $22 | 64 |
| 8245 E Hildale St | 0.61mi | 3/1.0 | 1,028 (+3%) | 3mo | $45,000 | $44 | 64 |
| 18810 Sherwood St | 0.23mi | 3/2.0 | 915 (-8%) | 11mo | $103,000 | $113 | 62 |
| 6744 Brimson St | 0.52mi | 3/1.0 | 910 (-9%) | 1mo | $45,000 | $49 | 60 |
| 19351 Dwyer St | 0.72mi | 3/1.0 | 971 (-3%) | 6mo | $120,000 | $124 | 57 |
| 6865 Edgeton St | 0.44mi | 3/1.5 | 888 (-11%) | 8mo | $73,000 | $82 | 52 |
| 19400 Dwyer St | 0.74mi | 3/1.5 | 960 (-4%) | 8mo | $50,000 | $52 | 50 |
| 19309 Carrie St | 0.48mi | 2/1.0 (-1) | 1,115 (+12%) | 10mo | $65,000 | $58 | 45 |
Match score weights: distance 35% · size 25% · config 20% · recency 20%. Top-matched comps best support the ARV.
Projected returns pro-forma
-3.0% appreciation · 6.72% rent growth · sell at horizon
- IRR
- -7.4%
- Equity multiple
- 0.71×
- Total profit
- $-8,126
- Equity at exit
- $15,059
- IRR
- 7.3%
- Equity multiple
- 1.67×
- Total profit
- $18,819
- Equity at exit
- $8,733
Cash invested: $28,280 (down + closing). Projections, not guarantees.
Landlord ↔ Tenant lean methodology
- Overall (STATE)
- 62 Landlord-Friendly
- State Michigan
- 62 Landlord-Friendly · EVEN
- County
- — inherits STATE
- City
- — inherits STATE
ZIP-level market 48234
- Home prices YoY
- -11.9%
- Rents YoY
- 6.7%
- Active inventory
- 226
- Price-to-rent
- 6.9×
Monthly cashflow live
- Estimated rent
- $1,219 high interval (Pro) →
- Mortgage (P&I)
- −$530
- Tax from tax record
- −$338 /mo · $4,061/yr
- Insurance
- −$42
- HOA
- −$0
- Vacancy / Maint / Mgmt
- −$256
- Net cashflow
- $53
Break-even live
UW: 25.0% down · 7.5% · 30yr · 1.5% tax · 5.0% vac · 8.0% maint · 8.0% mgmt
Financing live
Cash to close
- Down payment
- $25,250
- Closing costs
- $3,030
- Reserves months
- —
- Total cash needed
- —
Loan-product check · same deal, 3 products live
Conventional
25% down · 7.5% · 30yr
- Down + closing
- —
- Monthly P&I
- —
- Monthly cashflow
- —
- DSCR
- —
- Eligible?
- —
Personal DTI + credit; lowest rate.
DSCR
20% down · 8.5% · 30yr
- Down + closing
- —
- Monthly P&I
- —
- Monthly cashflow
- —
- DSCR
- —
- Eligible?
- —
No personal income docs; deal must DSCR.
Hard money
10% down · 12.0% · 12mo
- Down + closing
- —
- Monthly P&I
- —
- Monthly cashflow
- —
- DSCR
- —
- Eligible?
- —
Short-term bridge; refi at stabilization.
Rent comps 17 comps
| Address | Beds | Baths | Sqft | Rent | $/sqft | DOM | Units | Dist |
|---|---|---|---|---|---|---|---|---|
| 7533 Quinn St Unit 1 Detroit, MI | 2.0 | 1.0 | 700 | $850 | $1.21 | 44d | 1 | 0.31mi |
| 19171 Cliff St Detroit, MI | 3.0 | 1.0 | 1000 | $1,200 | $1.20 | 17d | 1 | 0.44mi |
| 19691 Cliff St #1 Detroit, MI | 2.0 | 1.0 | 850 | $1,050 | $1.24 | 5d | 1 | 0.78mi |
| 19415 Gable St Detroit, MI | 3.0 | 1.0 | 1000 | $1,373 | $1.37 | 24d | 1 | 0.83mi |
| 18884 Bloom St Detroit, MI | 3.0 | 1.0 | 979 | $975 | $1.00 | 22d | 1 | 0.91mi |
| 18884 Bloom St Detroit, MI | 3.0 | 1.0 | 979 | $975 | $1.00 | 44d | 1 | 0.91mi |
| 18891 Moenart St Detroit, MI | 3.0 | 1.0 | 870 | $1,195 | $1.37 | 17d | 1 | 0.98mi |
| 19260 Bloom St Detroit, MI | 3.0 | 1.0 | 1100 | $1,350 | $1.23 | 4d | 1 | 0.99mi |
| 19361 Moenart St Unit 1 Detroit, MI | 2.0 | 1.0 | 1000 | $1,100 | $1.10 | 24d | 1 | 1.10mi |
| 19162 Conley St Detroit, MI | 2.0 | 1.0 | 1000 | $1,300 | $1.30 | 44d | 1 | 1.11mi |
| 19450 Fenelon St Detroit, MI | 3.0 | 1.0 | 1062 | $1,384 | $1.30 | 5d | 1 | 1.28mi |
| 11513 Greiner St Unit 11521 Greiner Detroit, MI | 2.0 | 1.0 | 942 | $1,050 | $1.11 | 44d | 1 | 1.38mi |
| 20263 Caldwell St Detroit, MI | 3.0 | 1.0 | 909 | $1,350 | $1.49 | 17d | 1 | 1.39mi |
| 18662 Sunset St Detroit, MI | 2.0 | 1.0 | 726 | $1,250 | $1.72 | 18d | 1 | 1.46mi |
| 19335 Hoover St Detroit, MI | 2.0 | 1.0 | 620 | $1,099 | $1.77 | 17d | 1 | 1.48mi |
| 19335 Hoover St Detroit, MI | 2.0 | 1.0 | 620 | $1,099 | $1.77 | 44d | 1 | 1.48mi |
| 7605 Jackson Ave Warren, MI | 2.0 | 1.0 | 600 | $1,165 | $1.94 | 24d | 1 | 1.49mi |
Listing history 17 events
-
2026-06-17pricedays on market $101,000 Active 1 DOM
Show marketing remark (774 chars)
18445 Helen St is a 999 square foot house on a 6,098 square foot lot with 2 bedrooms and 1 full bathroom and one half. This home provides a HUGE lot next to the property and is included in the sale. The approximate size is 0.135 acre. Freshly remodeled in 2025 with everything brand new. Conveniently located near freeway access, local shopping, restaurants, schools, and parks, this move-in-ready property features a brand-new kitchen, updated bathroom, fresh flooring, new paint, 2025 roof, new sliding windows and doors providing a peace of mind for the new owner. Perfect for first-time homebuyers or investors seeking a solid addition to their portfolio. Schedule your showing today before it's gone! BATVAI, all measurements are estimated as taken from public records.
-
2026-06-16price $104,900 Active 31 DOM
-
2026-06-15days on market $114,900 Active 31 DOM
-
2026-06-13days on market $114,900 Active 29 DOM
-
2026-06-13days on market $114,900 Active 28 DOM
-
2026-06-09days on market $114,900 Active 25 DOM
-
2026-06-08days on market $114,900 Active 24 DOM
-
2026-06-07pricedays on market $114,900 Active 23 DOM
-
2026-06-04days on market $119,000 Active 20 DOM
-
2026-06-03days on market $119,000 Active 19 DOM
-
2026-06-02days on market $119,000 Active 18 DOM
-
2026-06-01days on market $119,000 Active 17 DOM
-
2026-05-31days on market $119,000 Active 16 DOM
-
2026-05-16$119,000 Active 774-char remark
-
2026-05-16$119,000 Active 780-char remark
-
2026-05-15historical $119,000 774-char remark
-
2023-07-11soldstatus $20,000
ⓘ Source: listings_history table (triggers on properties + properties_extension) + one-shot
backfill from property_details.listing_events for pre-trigger history.
Tax reassessment forecast MI · Partial reset (capped growth)
- Current annual tax
- $4,061 · $338/mo
- Projected year-2 tax
- $4,061 · $338/mo
- Expected delta
- $0/yr ($0/mo · 0.0%)
ⓘ Screening estimate from a state-policy table — verify with the county assessor before closing.
Climate risk First Street
- Flood 1/10 Low FEMA zone X (unshaded) · 0% chance over 30 yrs
- Wildfire 1/10 Low
- Heat 3/10 Moderate 7 d/yr ≥97°F today · 15 d/yr by 30 yrs out
- Wind 2/10 Low
- Air quality 3/10 Moderate 2 unhealthy d/yr today · 5 by 30 yrs out
Nearby sold comps map
Loading sold comps map…
Walkable amenities ~0.75 mi
Loading nearby amenities…
Taxation est. · year 1
- Rental income
- $14,626
- − Mortgage interest
- −$5,658
- − Property taxes
- −$4,061
- − Insurance
- −$505
- − Repairs & maintenance
- −$1,170
- − Management
- −$1,170
- − Depreciation
- −$2,938
- Taxable loss
- −$876
- Est. tax savings @ 24.0%
- +$210
- After-tax cash flow
- $843/yr
For passive investors: Depreciation is non-cash, so a rental often shows a tax loss while cash-flowing — sheltering income. Rental losses are passive: they offset passive income freely, and up to $25,000/yr can offset ordinary (W-2) income if you actively participate and your MAGI is under $100k (phasing out to $0 by $150k); unused losses carry forward. On sale, claimed depreciation is recaptured at up to 25%, and gains may owe capital-gains tax (a 1031 exchange can defer both). Figures are a year-1 estimate at your 24.0% rate — not tax advice; consult a CPA.
Schools (NCES district)
- District
- Detroit Public Schools Community District
- NCES district ID
- 2601103
- Math proficiency
- 10% ▼ -2.00%
- Reading proficiency
- 24% ▲ 6.00%
- Median HH income
- $25,815
- Composite
- 13.06/100
- National rank
- #9564
- State rank
- #499 of 540 in MI
Livability — Detroit
- Score
- 73/100
- State rank
- #218
- US rank
- #5427
Category grades
Schools grade is shown separately in the Schools card above.
Census & demographics
- Census place
- Detroit, MI
- County
- Wayne County · 1,562,939 people
- City population
- 572,865
- Metro
- Detroit-Warren-Dearborn, MI
- Population (ZIP)
- 32,760
- Household income
- $35,322
- Rent vs Own
- Severe rent burden
- 2372.0
Population outlook (Wayne County) Hauer SSP2
- Today (2025)
- 1,675,273 people
- By 2030
- 1,620,300 · -3.3%
- By 2040
- 1,502,341 · -10.3%
- By 2050
- 1,384,039 · -17.4%
- By 2075
- 1,124,592 · -32.9%
- By 2100
- 881,193 · -47.4%
Race, ethnicity, and origin ACS 2023
- Neighborhood character
- Predominantly Black (94%)
- Race & ethnicity
- Black 94% White 3% Two or more races 1%
- Common ancestry
- Romanian 1%
- Foreign-born
- 2% · Canada, Vietnam, Philippines
- Languages at home
- 97% English-only · French/Haitian/Cajun 1%
Political lean MEDSL · Wayne
- 2024 margin
- Strong D (+29.0) · D 62.7% · R 33.7% · Other 3.6%
- 2008→2024 swing
- -20.5pp toward R · 2008: 49.5pp · 2024: 29.0pp
- All cycles
- 2024: D+29.0 2020: D+38.1 2016: D+37.3 2012: D+46.9 2008: D+49.5
Not yet ingested
- Civics
- —
Market trends
- HPI YoY
- ▼ -44.65%
- Current HPI
- 328.8978
- Rent YoY
- ▲ 6.72%
- Metro
- Detroit-Warren-Dearborn, MI
- State GDP YoY
- ▲ 1.37%
- F500 in state
- 28
Industry mix (Fortune 500 HQ in MI)
| Industry | F500 HQs | Revenue |
|---|---|---|
| Automotive Parts | 3 | $48B |
|
||
| Automotive | 2 | $372B |
|
||
| Chemicals | 1 | $45B |
|
||
| Automotive Retail | 1 | $29B |
|
||
| Healthcare / Medical Devices | 1 | $23B |
|
||
| Automotive Technology | 1 | $20B |
|
||
Price history
+405.0% since first listed12 events — show timeline
- 2026-06-17 Listed $101,000 REALCOMP
- 2026-06-17 Listing Removed — MiRealSource-MiMLS
- 2026-06-17 Listed $101,000 MiRealSource-MiMLS
- 2026-06-17 Listing Removed — REALCOMP
- 2026-06-15 Price Changed $104,900 MiRealSource-MiMLS
- 2026-06-15 Price Changed $104,900 REALCOMP
- 2026-06-06 Price Changed $114,900 MiRealSource-MiMLS
- 2026-06-05 Price Changed $114,900 REALCOMP
- 2026-05-16 Listed $119,000 MiRealSource-MiMLS
- 2026-05-16 Listed $119,000 REALCOMP
- 2026-05-15 Coming Soon — MiRealSource-MiMLS
- 2023-07-11 Sold (Public Records) $20,000 Public Records
Property tax history
+8.0%/yrLatest (2025): $4,061 · -4.2% YoY. Source: county tax records.
Cash-flow waterfall
monthlySold comps — $/sqft
last 12 mo · ≤1 miLoading sold comps…