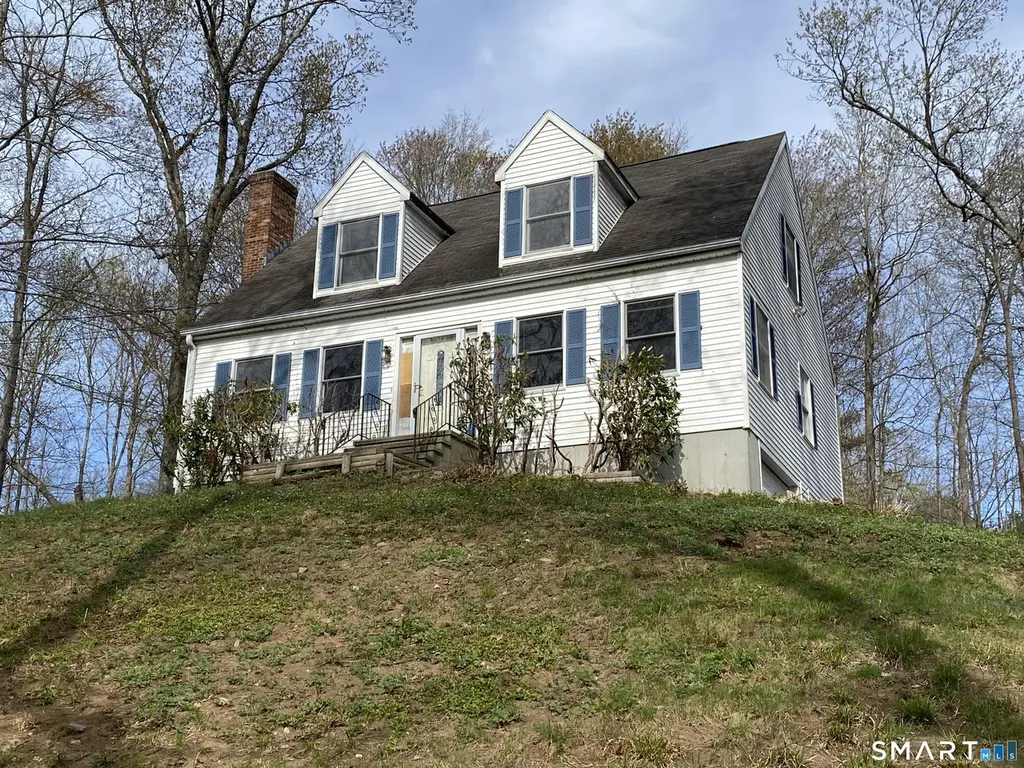
574 Town St · Moodus, CT
Flood risk 1/10 · Minimal
- FEMA flood zone
- X (unshaded)
- Chance of flooding over 30 yrs
- 0.0%
- Est. flood insurance / yr
- $473 – $860
Fire risk 3/10 · Minor
- Est. fire insurance / yr
- $829 – $1,539
Heat risk 5/10 · Moderate
- Hot days now (above 95°F)
- 7 days/yr
- Hot days in 30 yrs
- 16 days/yr
Wind risk 6/10 · Moderate
- Chance of severe wind over 30 yrs
- 56.0%
Air-quality risk 3/10 · Minor
- Unhealthy air days now
- 3 days/yr
- Unhealthy air days in 30 yrs
- 4 days/yr
Risk factors via First Street. Map © Google.
Why this score? — see what drove the C- grade
The composite is a weighted blend of 9 inputs, each scored 0–100. Each bar is that input's sub-score; the figure is the points it added to the 100-point composite (weight × sub-score).
- Cash flow +15.9/30.0
- ARV discount +15.0/15.0
- Schools +5.1/10.0
- DSCR +4.9/10.0
- 1% rule +4.2/10.0
- Livability +3.7/5.0
- Rent growth +2.5/5.0
- Condition / age +2.5/5.0
- Appreciation +0.0/10.0
$324,900
🖨 Deal sheet 📄 Offer letter ✓ Due diligence
Listing remarks
Opportunity awaits with this spacious 3-bedroom, 2 full bath home situated on a beautiful 1-acre lot. Built in 1995, this property offers 1,591 square feet of living space and features a desirable first-floor primary bedroom with a full bath, plus a 2-car under garage. Recent updates include new carpeting in the living room and dining room. A rear deck overlooks the private yard, offering great outdoor potential for entertaining or relaxing. This home is being sold as-is as part of an estate sale and will require updates and repairs, including a roof nearing the end of its useful life. Appliances are also being conveyed as-is. With solid bones, a functional layout, and a great setting, this
Key facts
- Private yard
- Rear deck
- Outdoor potential
Tags
Property features AI
Finance
- Other: Located in Connecticut (Middlesex County) near golf course, lake and library
Exterior
- Parking: Under-house garage; 2-car garage; Driveway (private, paved, asphalt); Off-street parking (total 5 spaces)
- Utilities: Private well; Septic system; Oil hot water heater (fuel tank in basement); Thermopane windows; Storm doors
- Home design: Single-family home; White exterior
- Construction: Frame construction; Vinyl siding; Asphalt shingle roof; Concrete foundation; Full unfinished basement with storage, interior and garage access, concrete floor
- Exterior features: Deck; Lightly wooded, sloping lot
Interior
- Kitchen: Microwave; Refrigerator; Dishwasher
- Bedrooms: 3 bedrooms
- Bathrooms: 2 full bathrooms
- Heating & cooling: Hot water heat; Oil-fired heating; Programmable thermostat
- Interior features: Open floor plan; Auto garage door opener; One fireplace (with insert)
- Laundry & utility: Washer (upper level); Dryer (lower level)
Neighborhood map
What this means for you Summary
Snapshot
- This is a 2-bed/2.0-bath single-family listed at $325k.
Deal economics
- At list price, monthly cash flow is $157 ($2k/yr) — positive.
- The deal already cash-flows at list — no discount required.
- To meet the 1% rule (rent ≥ 1% of price), the offer needs to be $300k (7.7% below list).
- Recommended offer: $300k (7.7% below list) — sets the bar for 1% rule.
Location & tenants
- Location reads 73/100 on livability (#70 in CT) — a middle-class / working-renter tenant base. Strengths: crime A+, employment A+, housing A+; Watch: amenities F, commute F.
- East Haddam School District (rural): math 47% / reading 65% proficiency, ranked #59 of 153 in CT (top 39%) — acceptable for families but not a draw, mixed tenant base, ~2y average lease; only 11% free/reduced lunch — higher-income household profile.
- Market conditions: 14 active listings in the ZIP; 1 comparable units currently listed for rent nearby; 278 units permitted in Lower Connecticut River Valley Planning Region in 2024 (89 in 5+ unit buildings).
Forward outlook
- Local home prices are declining (-3.0%/yr); year-one equity from $2k of loan paydown is wiped out by about $10k of value loss. Plan a longer hold.
Negotiation context
- It's been on market 26 days — a 2% lower offer ($320k) is reasonable based on typical stale-listing flexibility.
- 2 sale attempts since 22y ago; this cycle's ask has dropped $25k (7%) from the opening price — seller is motivated, your offer sets the floor, not the list.
- Current owner paid $232k; 40% above their basis — modest negotiation headroom, anchor on the comps not their cost.
Risks & watch-outs
- Climate carrying-cost: major wind risk, 56% chance of damaging wind over 30y; extreme-heat days projected 7→16/yr by 2055 (HVAC capex compounding) — expect insurance premiums to compound above CPI over the hold.
Questions for the listing agent
- Is there a deadline driving the sale (1031 exchange, divorce, estate, relocation)? That informs how much negotiation room exists.
- Schools are A-rated — typically a magnet for longer-tenancy family renters. What's the average tenant stay here, and is there a school-zone premium baked into asking?
- What's the average days-on-market for RENTAL listings here right now (not sales)? A rising rental-DOM trend means longer vacancies and softer asking-rent achievability than the comps imply.
- What's the recent tenant-quality profile in this submarket — average credit score on applications, eviction rate, late-payment / NSF rate, and stable-employment percentage? A property-management company in the area should have these aggregated.
- How much new for-sale + rental construction is in the pipeline within 1–3 miles? Heavy new supply typically softens prices + rents 12–24 months out; constrained supply supports both.
Investment metrics
- 1% rule
- 0.92% ✗
- Cap rate
- 6.87%
- Cash-on-cash
- 2.08%
- DSCR
- 1.09
- GRM
- 9.0
CMA / ARV
- ARV (median comp)
- $430,181
- List price
- $324,900
- Delta
- -24.47%
- Verdict
- UNDERPRICED
- Comps
- 20 within 1.0 mi
Show comp detail 8 sales within ~0.75 mi
| Address | Dist | Beds/Ba | Sqft | Sold | Price | $/sf | Match |
|---|---|---|---|---|---|---|---|
| 10 Highland Ave | 0.60mi | 3/1.0 (+1) | 1,692 (+6%) | 2mo | $367,000 | $217 | 51 |
| 24 Alger Rd | 0.68mi | 3/2.0 (+1) | 1,560 (-2%) | 11mo | $485,000 | $311 | 51 |
| 7 School Rd | 0.14mi | 2/2.0 | 1,363 (-14%) | 23mo | $405,000 | $297 | 50 |
| 26 Joe Williams Rd | 0.47mi | 3/2.0 (+1) | 1,638 (+3%) | 22mo | $400,000 | $244 | 50 |
| 58 Old Kentwood Rd | 0.66mi | 3/1.5 (+1) | 1,591 (0%) | 22mo | $389,000 | $245 | 44 |
| 18 Robbie Rd | 0.48mi | 3/3.0 (+1) | 1,392 (-12%) | 10mo | $340,000 | $244 | 39 |
| 78 E Haddam Colchester Tpke | 0.60mi | 3/2.0 (+1) | 1,400 (-12%) | 13mo | $365,000 | $261 | 36 |
| 76B E Haddam Colchester Tpke | 0.66mi | 3/2.0 (+1) | 1,363 (-14%) | 18mo | $410,000 | $301 | 25 |
Match score weights: distance 35% · size 25% · config 20% · recency 20%. Top-matched comps best support the ARV.
Projected returns pro-forma
-3.0% appreciation · 3.0% rent growth · sell at horizon
- IRR
- -13.0%
- Equity multiple
- 0.53×
- Total profit
- $-42,603
- Equity at exit
- $48,444
- IRR
- -4.0%
- Equity multiple
- 0.74×
- Total profit
- $-24,094
- Equity at exit
- $28,091
Cash invested: $90,972 (down + closing). Projections, not guarantees.
Landlord ↔ Tenant lean methodology
- Overall (STATE)
- 27 Tenant-Leaning
- State Connecticut
- 27 Tenant-Leaning · D+7
- County
- — inherits STATE
- City
- — inherits STATE
ZIP-level market 06469
- Home prices YoY
- -18.4%
- Active inventory
- 14
- Price-to-rent
- 9.0×
Monthly cashflow live
- Estimated rent
- $3,000 medium interval (Pro) →
- Mortgage (P&I)
- −$1,704
- Tax from tax record
- −$374 /mo · $4,482/yr
- Insurance
- −$135
- HOA
- −$0
- Vacancy / Maint / Mgmt
- −$630
- Net cashflow
- $157
Break-even live
UW: 25.0% down · 7.5% · 30yr · 1.5% tax · 5.0% vac · 8.0% maint · 8.0% mgmt
Financing live
Cash to close
- Down payment
- $81,225
- Closing costs
- $9,747
- Reserves months
- —
- Total cash needed
- —
Loan-product check · same deal, 3 products live
Conventional
25% down · 7.5% · 30yr
- Down + closing
- —
- Monthly P&I
- —
- Monthly cashflow
- —
- DSCR
- —
- Eligible?
- —
Personal DTI + credit; lowest rate.
DSCR
20% down · 8.5% · 30yr
- Down + closing
- —
- Monthly P&I
- —
- Monthly cashflow
- —
- DSCR
- —
- Eligible?
- —
No personal income docs; deal must DSCR.
Hard money
10% down · 12.0% · 12mo
- Down + closing
- —
- Monthly P&I
- —
- Monthly cashflow
- —
- DSCR
- —
- Eligible?
- —
Short-term bridge; refi at stabilization.
Rent comps 1 comps
| Address | Beds | Baths | Sqft | Rent | $/sqft | DOM | Units | Dist |
|---|---|---|---|---|---|---|---|---|
| 620 Town St Moodus, CT | 3.0 | 2.0 | 1171 | $3,000 | $2.56 | 21d | 1 | 0.43mi |
Listing history 14 events
-
2026-06-12statusdays on market $324,900 Under Contract 26 DOM
-
2026-06-09days on market $324,900 Active 25 DOM
-
2026-06-08days on market $324,900 Active 24 DOM
-
2026-06-07days on market $324,900 Active 23 DOM
-
2026-06-04days on market $324,900 Active 19 DOM
-
2026-06-03price $324,900 Active 18 DOM
-
2026-06-02days on market $349,900 Active 18 DOM
-
2026-06-01days on market $349,900 Active 17 DOM
-
2026-05-31days on market $349,900 Active 16 DOM
-
2026-05-31days on market $349,900 Active 15 DOM
-
2026-05-15$349,900 Active 883-char remark
-
2004-05-07soldstatus $232,500
-
2004-03-07$235,900
-
1995-03-27soldstatus $140,500
ⓘ Source: listings_history table (triggers on properties + properties_extension) + one-shot
backfill from property_details.listing_events for pre-trigger history.
Tax reassessment forecast CT · Partial reset (capped growth)
- Current annual tax
- $4,482 · $374/mo
- Projected year-2 tax
- $5,717 · $476/mo
- Expected delta
- +$1,235/yr (+$103/mo · 27.6%)
ⓘ Screening estimate from a state-policy table — verify with the county assessor before closing.
Climate risk First Street
- Flood 1/10 Low FEMA zone X (unshaded) · 0% chance over 30 yrs
- Wildfire 3/10 Moderate
- Heat 5/10 Major 7 d/yr ≥95°F today · 16 d/yr by 30 yrs out
- Wind 6/10 Major 56% chance of damaging wind over 30 yrs
- Air quality 3/10 Moderate 3 unhealthy d/yr today · 4 by 30 yrs out
Nearby sold comps map
Loading sold comps map…
Walkable amenities ~0.75 mi
Loading nearby amenities…
Taxation est. · year 1
- Rental income
- $36,000
- − Mortgage interest
- −$18,199
- − Property taxes
- −$4,482
- − Insurance
- −$1,624
- − Repairs & maintenance
- −$2,880
- − Management
- −$2,880
- − Depreciation
- −$9,452
- Taxable loss
- −$3,518
- Est. tax savings @ 24.0%
- +$844
- After-tax cash flow
- $2,732/yr
For passive investors: Depreciation is non-cash, so a rental often shows a tax loss while cash-flowing — sheltering income. Rental losses are passive: they offset passive income freely, and up to $25,000/yr can offset ordinary (W-2) income if you actively participate and your MAGI is under $100k (phasing out to $0 by $150k); unused losses carry forward. On sale, claimed depreciation is recaptured at up to 25%, and gains may owe capital-gains tax (a 1031 exchange can defer both). Figures are a year-1 estimate at your 24.0% rate — not tax advice; consult a CPA.
Schools (NCES district)
- District
- East Haddam School District
- NCES district ID
- 0901200
- Math proficiency
- 47% ▼ -9.00%
- Reading proficiency
- 65% ▼ -6.00%
- Median HH income
- $82,341
- Composite
- 50.78/100
- National rank
- #1809
- State rank
- #59 of 153 in CT
Livability — Moodus
- Score
- 73/100
- State rank
- #70
- US rank
- #5128
Category grades
Schools grade is shown separately in the Schools card above.
Census & demographics
- City population
- 3,125
- Population (ZIP)
- 3,125
Population outlook (Lower Connecticut River Valley County) Hauer SSP2
- By 2040
- 188,651
Race, ethnicity, and origin ACS 2023
- Neighborhood character
- Predominantly White (95%)
- Race & ethnicity
- White 95% Two or more races 5% Hispanic / Latino 1%
- Common ancestry
- Lithuanian 12% Romanian 6% Slovak 1%
- Foreign-born
- 2%
- Languages at home
- 97% English-only · French/Haitian/Cajun 1% Spanish 1%
Political lean MEDSL · Lower Connecticut River Valley
- 2024 margin
- D (+13.4) · D 55.9% · R 42.4% · Other 1.7%
- All cycles
- 2024: D+13.4
Not yet ingested
- Civics
- —
Market trends
- HPI YoY
- ▼ -40.95%
- Current HPI
- 181.4315
- Rent YoY
- —
- Metro
- —
- State GDP YoY
- ▲ 1.06%
- F500 in state
- 38
Industry mix (Fortune 500 HQ in CT)
| Industry | F500 HQs | Revenue |
|---|---|---|
| Industrial Machinery | 4 | $38B |
|
||
| Insurance | 3 | $71B |
|
||
| Financial Services | 2 | $25B |
|
||
| Transportation / Logistics | 2 | $18B |
|
||
| Healthcare | 1 | $247B |
|
||
| Telecommunications | 1 | $55B |
|
||
Price history
+131.2% since first listed6 events — show timeline
- 2026-06-10 Pending — Smart MLS
- 2026-06-02 Price Changed $324,900 Smart MLS
- 2026-05-15 Listed $349,900 Smart MLS
- 2004-05-07 Sold (MLS) $232,500 Smart MLS
- 2004-03-07 Listed $235,900 Smart MLS
- 1995-03-27 Sold (Public Records) $140,500 Public Records
Property tax history
+2.7%/yrLatest (2022): $4,482 · +4.5% YoY. Source: county tax records.
Cash-flow waterfall
monthlySold comps — $/sqft
last 12 mo · ≤1 miLoading sold comps…