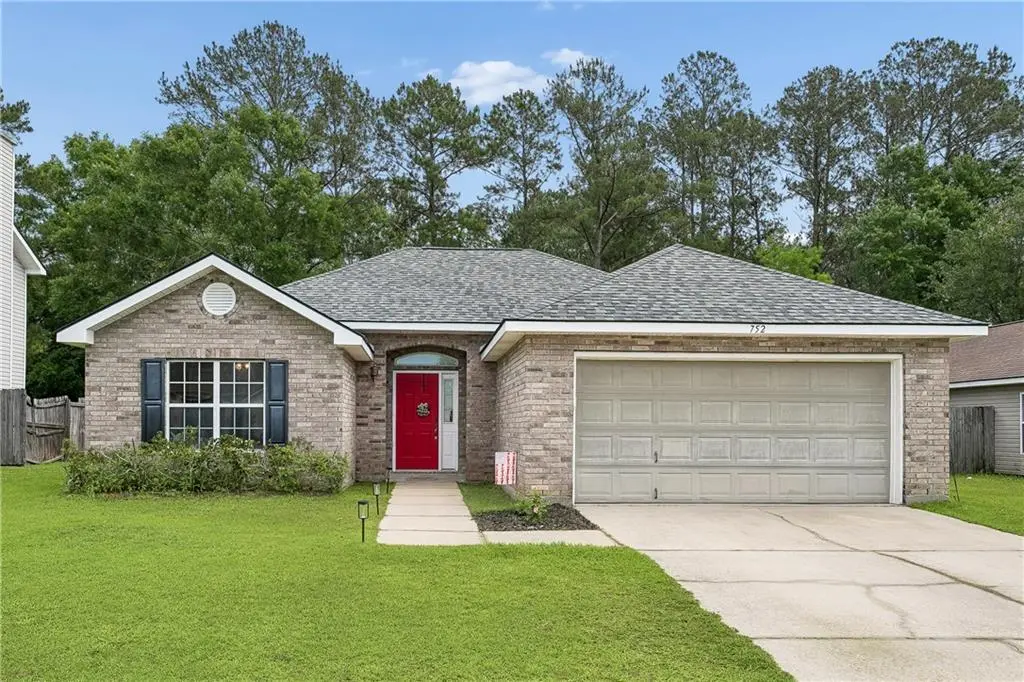
752 Simpson Way · Covington, LA
Flood risk 1/10 · Minimal
- FEMA flood zone
- X
- Chance of flooding over 30 yrs
- 0.0%
- Est. flood insurance / yr
- $507 – $1,088
Fire risk 5/10 · Moderate
- Est. fire insurance / yr
- $1,269 – $2,357
Heat risk 9/10 · Severe
- Hot days now (above 109°F)
- 7 days/yr
- Hot days in 30 yrs
- 22 days/yr
Wind risk 9/10 · Severe
- Chance of severe wind over 30 yrs
- 99.0%
Air-quality risk 2/10 · Minimal
- Unhealthy air days now
- 0 days/yr
- Unhealthy air days in 30 yrs
- 1 days/yr
Risk factors via First Street. Map © Google.
Why this score? — see what drove the C grade
The composite is a weighted blend of 9 inputs, each scored 0–100. Each bar is that input's sub-score; the figure is the points it added to the 100-point composite (weight × sub-score).
- Cash flow +21.2/30.0
- ARV discount +12.3/15.0
- DSCR +6.7/10.0
- 1% rule +5.1/10.0
- Schools +4.3/10.0
- Livability +3.8/5.0
- Rent growth +2.5/5.0
- Condition / age +2.5/5.0
- Appreciation +0.0/10.0
$239,000
🖨 Deal sheet 📄 Offer letter ✓ Due diligence
Listing remarks MLS
Check out this charming, cozy and inviting home with open living areas that are spacious and welcoming! NEW HVAC system in 2025 and NEW ROOF in 2024! Greenspace in the back for privacy! The kitchen flows seamlessly into the living and dining areas, creating an ideal space for everyday living and entertaining. All appliances remain, including a new kitchen refrigerator, an additional refrigerator in the garage & washer and dryer, making this home move-in ready! Spacious primary suite has a large closet. Nearby is the community pool and playground. Located in flood zone C. Great home for a first time homebuyer. This is a wonderful opportunity to own in a convenient location, just a short drive to Downtown Covington!
Key facts
- Move-in ready
- Community pool
- New roof
Tags
Property features AI
Finance
- HOA & community: Homeowners association with annual fee (approximately $580/year); Community clubhouse; Community pool
Exterior
- Parking: Attached garage with two spaces and garage door opener
- Utilities: Public water; Public sewer; Electric power (standard)
- Home design: Single-story home; Brick and vinyl siding exterior; Shingle roof; Slab foundation; Very good condition; Home warranty included
- Construction: Built with brick and vinyl siding; Shingle roof; Slab foundation
- Exterior features: Front porch; Community pool; Common grounds/area; Outside city limits; Rectangular lot with approximate dimensions 120x70
Interior
- Kitchen: Dishwasher; Disposal; Microwave; Oven; Range; Refrigerator
- Bathrooms: 2 full bathrooms
- Heating & cooling: Central heating; Central air conditioning; HVAC energy-efficient features
- Interior features: Ceiling fans; Cathedral ceilings; Vaulted/high ceilings
- Laundry & utility: Washer; Dryer
Neighborhood map
What this means for you Summary
Snapshot
- This is a 3-bed/2.0-bath single-family listed at $239k.
Deal economics
- At list price, monthly cash flow is $344 ($4k/yr) — positive.
- The deal already cash-flows at list — no discount required.
- Meets the 1% rule at list price ($2k rent vs $239k).
- Recommended offer: $235k (1.5% below list) — sets the bar for market timing.
- Cap rate 8.0% vs local median 3.9% in Covington — top-decile yield for the area; either an underpriced asset or a hidden risk that comps aren't pricing in. Stress-test before assuming the spread holds.
Location & tenants
- Location reads 75/100 on livability (#17 in LA, #3,876 nationally) — a middle-class / working-renter tenant base. Strengths: employment A+, housing A+, health & safety A+; Watch: amenities F, commute F.
- St. Tammany Parish (suburban): math 43% / reading 55% proficiency, ranked #11 of 98 in LA (top 11%) — families likely to look elsewhere, expect single-tenant / working-renter base with shorter leases.
- Market conditions: 365 active listings in the ZIP; 2 comparable units currently listed for rent nearby; solid renter incomes; 1,064 units permitted in St. Tammany Parish in 2024 (0 in 5+ unit buildings).
- This rent runs 36% of the median local income ($81k/yr) — at the standard rent-burdened threshold; future hikes will face affordability resistance.
Forward outlook
- Local home prices are declining (-3.0%/yr); year-one equity from $2k of loan paydown is wiped out by about $7k of value loss. Plan a longer hold.
- St. Tammany County population projected at +27% by 2050 — long-run rental-demand tailwind backs the buy-and-hold thesis.
Negotiation context
- It's been on market 27 days — a 2% lower offer ($235k) is reasonable based on typical stale-listing flexibility.
- 5 sale attempts with the ask held roughly flat each time — persistent listings suggest the price (not the market) is what's stuck; bring a comps-based counter.
Risks & watch-outs
- Climate carrying-cost: severe wind risk, 99% chance of damaging wind over 30y; moderate wildfire risk; extreme-heat days projected 7→22/yr by 2055 (HVAC capex compounding) — expect insurance premiums to compound above CPI over the hold.
Questions for the listing agent
- What does the HOA fee cover, when was the last increase, and are there any pending special assessments or reserve-fund shortfalls?
- Is there a deadline driving the sale (1031 exchange, divorce, estate, relocation)? That informs how much negotiation room exists.
- Schools are B-rated — typically a magnet for longer-tenancy family renters. What's the average tenant stay here, and is there a school-zone premium baked into asking?
- What's the average days-on-market for RENTAL listings here right now (not sales)? A rising rental-DOM trend means longer vacancies and softer asking-rent achievability than the comps imply.
- What's the recent tenant-quality profile in this submarket — average credit score on applications, eviction rate, late-payment / NSF rate, and stable-employment percentage? A property-management company in the area should have these aggregated.
- How much new for-sale + rental construction is in the pipeline within 1–3 miles? Heavy new supply typically softens prices + rents 12–24 months out; constrained supply supports both.
Investment metrics
- 1% rule
- 1.01% ✓
- Cap rate
- 8.02%
- Cash-on-cash
- 6.18%
- DSCR
- 1.27
- GRM
- 8.3
CMA / ARV
- ARV (median comp)
- $267,550
- List price
- $239,000
- Delta
- -8.43%
- Verdict
- FAIR
- Comps
- 20 within 1.0 mi
Show comp detail 10 sales within ~0.75 mi
| Address | Dist | Beds/Ba | Sqft | Sold | Price | $/sf | Match |
|---|---|---|---|---|---|---|---|
| 75522 Beverly Dr | 0.19mi | 3/2.0 | 1,487 (-2%) | 7mo | $250,000 | $168 | 83 |
| 709 Bridle Ct | 0.31mi | 3/2.0 | 1,533 (+2%) | 11mo | $245,000 | $160 | 73 |
| 413 Penn Ct | 0.13mi | 3/2.0 | 1,736 (+15%) | 3mo | $255,000 | $147 | 67 |
| 517 Huseman Ln | 0.55mi | 3/2.0 | 1,510 (0%) | 10mo | $192,500 | $127 | 66 |
| 76077 Carroll Dr | 0.33mi | 2/2.0 (-1) | 1,556 (+3%) | 14mo | $187,700 | $121 | 62 |
| 334 Penn Mill Lakes Blvd | 0.18mi | 3/2.0 | 1,350 (-11%) | 22mo | $249,999 | $185 | 56 |
| 337 Penn Mill Lakes Blvd | 0.22mi | 3/2.0 | 1,715 (+14%) | 15mo | $240,000 | $140 | 55 |
| 15010 Lake Ramsey Rd | 0.48mi | 3/2.0 | 1,600 (+6%) | 16mo | $147,000 | $92 | 55 |
| 76118 Carroll Dr | 0.42mi | 4/2.0 (+1) | 1,678 (+11%) | 21mo | $250,000 | $149 | 40 |
| 456 Steeple Chase Rd | 0.39mi | 3/2.0 | 1,731 (+15%) | 24mo | $255,000 | $147 | 38 |
Match score weights: distance 35% · size 25% · config 20% · recency 20%. Top-matched comps best support the ARV.
Projected returns pro-forma
-3.0% appreciation · 3.0% rent growth · sell at horizon
- IRR
- -6.8%
- Equity multiple
- 0.75×
- Total profit
- $-16,816
- Equity at exit
- $35,636
- IRR
- 2.8%
- Equity multiple
- 1.20×
- Total profit
- $13,508
- Equity at exit
- $20,664
Cash invested: $66,920 (down + closing). Projections, not guarantees.
Landlord ↔ Tenant lean methodology
- Overall (STATE)
- 90 Strongly Landlord-Friendly
- State Louisiana
- 90 Strongly Landlord-Friendly · R+12
- County
- — inherits STATE
- City
- — inherits STATE
ZIP-level market 70435
- Home prices YoY
- -27.3%
- Active inventory
- 365
- Price-to-rent
- 8.3×
Monthly cashflow live
- Estimated rent
- $2,404 medium interval (Pro) →
- Mortgage (P&I)
- −$1,253
- Tax from tax record
- −$154 /mo · $1,843/yr
- Insurance
- −$100
- HOA
- −$48
- Vacancy / Maint / Mgmt
- −$505
- Net cashflow
- $344
Break-even live
UW: 25.0% down · 7.5% · 30yr · 1.5% tax · 5.0% vac · 8.0% maint · 8.0% mgmt
Financing live
Cash to close
- Down payment
- $59,750
- Closing costs
- $7,170
- Reserves months
- —
- Total cash needed
- —
Loan-product check · same deal, 3 products live
Conventional
25% down · 7.5% · 30yr
- Down + closing
- —
- Monthly P&I
- —
- Monthly cashflow
- —
- DSCR
- —
- Eligible?
- —
Personal DTI + credit; lowest rate.
DSCR
20% down · 8.5% · 30yr
- Down + closing
- —
- Monthly P&I
- —
- Monthly cashflow
- —
- DSCR
- —
- Eligible?
- —
No personal income docs; deal must DSCR.
Hard money
10% down · 12.0% · 12mo
- Down + closing
- —
- Monthly P&I
- —
- Monthly cashflow
- —
- DSCR
- —
- Eligible?
- —
Short-term bridge; refi at stabilization.
Rent comps 2 comps
| Address | Beds | Baths | Sqft | Rent | $/sqft | DOM | Units | Dist |
|---|---|---|---|---|---|---|---|---|
| 75533 Joyce Dr Covington, LA | 3.0 | 2.0 | 1825 | $2,150 | $1.18 | 43d | 1 | 1.38mi |
| 16973 River Park Dr Covington, LA | 4.0 | 2.0 | 2014 | $2,500 | $1.24 | 19d | 1 | 1.47mi |
HOA detail
- Monthly dues
- $48 · $576/yr
- Likely covers
- pool
Listing history 24 events
-
2026-06-18days on market $239,000 Active 27 DOM
-
2026-06-17days on market $239,000 Active 26 DOM
-
2026-06-16days on market $239,000 Active 25 DOM
-
2026-06-15days on market $239,000 Active 24 DOM
-
2026-06-13days on market $239,000 Active 22 DOM
-
2026-06-10days on market $239,000 Active 19 DOM
-
2026-06-09days on market $239,000 Active 18 DOM
-
2026-06-08days on market $239,000 Active 17 DOM
-
2026-06-07days on market $239,000 Active 16 DOM
-
2026-06-03days on market $239,000 Active 12 DOM
-
2026-06-02days on market $239,000 Active 11 DOM
-
2026-06-01days on market $239,000 Active 10 DOM
-
2026-05-31days on market $239,000 Active 9 DOM
-
2026-05-11price $239,000 760-char remark
-
2026-05-11price $239,000 760-char remark
-
2026-04-28$245,000 Active 760-char remark
-
2026-04-28$245,000 Active 760-char remark
-
2025-04-25soldstatus $235,000 Closed
-
2025-04-25soldstatus $235,000
-
2025-03-31status Pending
-
2025-03-26price $235,000
-
2025-03-26price $235,000
-
2025-02-25$250,000 Active
-
2025-02-25$250,000 Active
ⓘ Source: listings_history table (triggers on properties + properties_extension) + one-shot
backfill from property_details.listing_events for pre-trigger history.
Tax reassessment forecast LA · Resets to sale price
- Current annual tax
- $1,843 · $154/mo
- Projected year-2 tax
- $1,843 · $154/mo
- Expected delta
- $0/yr ($0/mo · 0.0%)
ⓘ Screening estimate from a state-policy table — verify with the county assessor before closing.
Climate risk First Street
- Flood 1/10 Low FEMA zone X · 0% chance over 30 yrs
- Wildfire 5/10 Major
- Heat 9/10 Extreme 7 d/yr ≥109°F today · 22 d/yr by 30 yrs out
- Wind 9/10 Extreme 99% chance of damaging wind over 30 yrs
- Air quality 2/10 Low 0 unhealthy d/yr today · 1 by 30 yrs out
Nearby sold comps map
Loading sold comps map…
Walkable amenities ~0.75 mi
Loading nearby amenities…
Taxation est. · year 1
- Rental income
- $28,844
- − Mortgage interest
- −$13,388
- − Property taxes
- −$1,843
- − Insurance
- −$1,195
- − Repairs & maintenance
- −$2,308
- − Management
- −$2,308
- − HOA
- −$576
- − Depreciation
- −$6,953
- Taxable income
- $275
- Est. tax owed @ 24.0%
- −$66
- After-tax cash flow
- $4,067/yr
For passive investors: Depreciation is non-cash, so a rental often shows a tax loss while cash-flowing — sheltering income. Rental losses are passive: they offset passive income freely, and up to $25,000/yr can offset ordinary (W-2) income if you actively participate and your MAGI is under $100k (phasing out to $0 by $150k); unused losses carry forward. On sale, claimed depreciation is recaptured at up to 25%, and gains may owe capital-gains tax (a 1031 exchange can defer both). Figures are a year-1 estimate at your 24.0% rate — not tax advice; consult a CPA.
Schools (NCES district)
- District
- St. Tammany Parish
- NCES district ID
- 2201650
- Math proficiency
- 43% ▼ -32.00%
- Reading proficiency
- 55% ▼ -26.00%
- Median HH income
- $61,752
- Composite
- 43.04/100
- National rank
- #3098
- State rank
- #11 of 98 in LA
Livability — Covington
- Score
- 75/100
- State rank
- #17
- US rank
- #3876
Category grades
Schools grade is shown separately in the Schools card above.
Census & demographics
- County
- Saint Tammany Parish · 228,296 people
- City population
- 64,351
- Metro
- New Orleans-Metairie, LA
- Population (ZIP)
- 22,475
- Household income
- $80,926
- Rent vs Own
- Severe rent burden
- 296.0
Population outlook (St. Tammany County) Hauer SSP2
- Today (2025)
- 286,725 people
- By 2030
- 304,175 · +6.1%
- By 2040
- 336,203 · +17.3%
- By 2050
- 364,590 · +27.2%
- By 2075
- 433,362 · +51.1%
- By 2100
- 470,333 · +64.0%
Race, ethnicity, and origin ACS 2023
- Neighborhood character
- Predominantly White (84%)
- Race & ethnicity
- White 84% Black 9% Two or more races 4% Hispanic / Latino 3% Pacific Islander 2%
- Common ancestry
- Lithuanian 15% Serbian 1% Slovak 1%
- Foreign-born
- 2% · Canada
- Languages at home
- 97% English-only · Spanish 1% French/Haitian/Cajun 1%
Political lean MEDSL · St. Tammany
- 2024 margin
- Solid R (+43.8) · D 27.3% · R 71.1% · Other 1.6%
- 2008→2024 swing
- +9.6pp toward D · 2008: -53.4pp · 2024: -43.8pp
- All cycles
- 2024: R+43.8 2020: R+44.2 2016: R+50.8 2012: R+52.2 2008: R+53.4
Not yet ingested
- Civics
- —
Market trends
- HPI YoY
- ▼ -76.03%
- Current HPI
- 202.0458
- Rent YoY
- —
- Metro
- New Orleans-Metairie, LA
- State GDP YoY
- ▲ 3.29%
- F500 in state
- 10
Industry mix (Fortune 500 HQ in LA)
| Industry | F500 HQs | Revenue |
|---|---|---|
| Telecommunications | 2 | $23B |
|
||
| Utilities | 1 | $12B |
|
||
| Wholesale / Distribution | 1 | $5B |
|
||
| Advertising | 1 | $2B |
|
||
Price history
-4.4% since first listed12 events — show timeline
- 2026-05-21 Listed $239,000 GSREIN
- 2026-05-21 Listed $239,000 AcadianaMLS
- 2026-05-11 Price Changed $239,000 AcadianaMLS
- 2026-05-11 Price Changed $239,000 GSREIN
- 2026-04-28 Listed $245,000 AcadianaMLS
- 2025-04-25 Sold (Public Records) $235,000 Public Records
- 2025-04-25 Sold (MLS) $235,000 GSREIN
- 2025-03-31 Pending — GSREIN
- 2025-03-26 Price Changed $235,000 AcadianaMLS
- 2025-03-26 Price Changed $235,000 GSREIN
- 2025-02-25 Listed $250,000 GSREIN
- 2025-02-25 Listed $250,000 AcadianaMLS
Property tax history
+1.0%/yrLatest (2025): $1,843 · +77.1% YoY. Source: county tax records.
Cash-flow waterfall
monthlySold comps — $/sqft
last 12 mo · ≤1 miLoading sold comps…