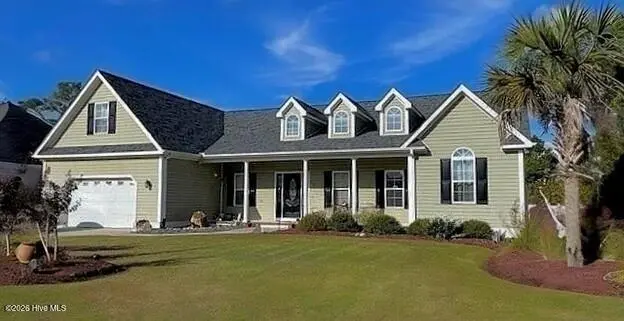
515 Davidson Dr · Newport, NC
Flood risk 7/10 · Major
- FEMA flood zone
- X (unshaded)
- Chance of flooding over 30 yrs
- 0.99%
- Est. flood insurance / yr
- $507 – $1,088
Fire risk 4/10 · Minor
- Est. fire insurance / yr
- $906 – $1,684
Heat risk 9/10 · Severe
- Hot days now (above 102°F)
- 7 days/yr
- Hot days in 30 yrs
- 21 days/yr
Wind risk 8/10 · Major
- Chance of severe wind over 30 yrs
- 99.0%
Air-quality risk 2/10 · Minimal
- Unhealthy air days now
- 0 days/yr
- Unhealthy air days in 30 yrs
- 1 days/yr
Risk factors via First Street. Map © Google.
Why this score? — see what drove the B grade
The composite is a weighted blend of 9 inputs, each scored 0–100. Each bar is that input's sub-score; the figure is the points it added to the 100-point composite (weight × sub-score).
- Cash flow +30.0/30.0
- 1% rule +10.0/10.0
- DSCR +10.0/10.0
- ARV discount +7.5/15.0
- Schools +5.1/10.0
- Livability +3.2/5.0
- Rent growth +2.5/5.0
- Condition / age +2.5/5.0
- Appreciation +0.0/10.0
$475,000
🖨 Deal sheet 📄 Offer letter ✓ Due diligence
Listing remarks MLS
Recent updates to this desirable property include new LVP flooring and carpet, kitchen countertops, microwave, kitchen sink, paint in major rooms, new lighting fixtures as well as newly painted kitchen cabinets. This split floor plan with a FROG has 3 bedrooms and 3 full baths as well as a screened porch overlooking a large fenced in backyard with new shed that has electricity. Great property to call home!
Key facts
- 0.35 acre lot
- 2 garage spots
- Built 2006
Property features AI
Finance
- HOA & community: Homeowners association with management; Annual association fee of $299 (about $24.92/month)
Exterior
- Parking: Attached garage; Two garage spaces; Two total parking spaces; Garage faces front; Concrete driveway; Garage door opener; Off-street paved parking
- Security: Smoke detector(s)
- Utilities: Public water; Sewer connected; Water connected; Cable available
- Home design: Single-family residence; One level / single-story; Entry level: 1
- Construction: Vinyl siding with frame construction; Composition roof; Raised and slab foundation; Built with accessible full bath
- Exterior features: Covered screened front porch; Porch; Shed(s); Back yard fencing (vinyl); Fenced yard; Cul-de-sac lot; Paved road frontage; Has view; Street lights in community
Interior
- Kitchen: Electric oven; Range; Double oven; Microwave; Dishwasher; Disposal; Refrigerator; Ice maker; Tankless gas water heater
- Bedrooms: Bedrooms located on main level
- Flooring: Carpet; Tile
- Bathrooms: Three full bathrooms; Accessible full bathroom
- Heating & cooling: Heat pump and electric heating; Central air; Zoned cooling; Ceiling fans
- Interior features: Master suite on the main floor; Walk-in closet(s); Tray ceilings; High ceilings; Built-in bookcases; Ceiling fan(s); Insulated windows; Window coverings; Gas log fireplace insert
- Laundry & utility: Washer hookup; Washer and dryer included; Laundry in hall
Neighborhood map
What this means for you Summary
Snapshot
- This is a 4-bed/3.0-bath other listed at $475k.
Deal economics
- At list price, monthly cash flow is $9k ($107k/yr) — positive.
- The deal already cash-flows at list — no discount required.
- Meets the 1% rule at list price ($15k rent vs $475k).
Location & tenants
- Location reads 63/100 on livability (#385 in NC) — a middle-class / working-renter tenant base. Strengths: cost of living A+, housing A+; Watch: employment C-, amenities F, commute F.
- Carteret County Public Schools (rural): math 59% / reading 61% proficiency, ranked #31 of 178 in NC (top 17%) — acceptable for families but not a draw, mixed tenant base, ~2y average lease.
- Zoned schools: Newport Elementary (math 48% / reading 45%, grade D-, #542 of 1,410 statewide, top 39%, 645 students, 100% FRL); Newport Middle (math 39% / reading 56%, grade C-, #140 of 475 statewide, top 30%, 378 students, 98% FRL); West Carteret High (math 82% / reading 71%, grade A-, #89 of 535 statewide, top 16%, 1,146 students, 40% FRL) — zoned schools average 79% FRL vs 39% district-wide (40 pts higher); higher-poverty schools than district average — tighter screening recommended.
- Market conditions: 216 active listings in the ZIP; 935 units permitted in Carteret County in 2024 (360 in 5+ unit buildings).
- At $14,918/mo this rent would consume 255% of the median local household income ($70k/yr) (locally 461% of renters already pay >50% of income on rent) — very limited rent-growth headroom before tenants either downsize or default.
Forward outlook
- Local home prices are declining (-3.0%/yr); year-one equity from $3k of loan paydown is wiped out by about $14k of value loss. Plan a longer hold.
- Carteret County population projected at +9% by 2050 — modest demand growth; plan on rents tracking national, not racing it.
- At projected returns (-3.0% appreciation + 3.0% rent growth), your $133k cash investment doubles in ~2 years — after that, you're playing with house money.
Negotiation context
- Only 14 days on market — expect competitive offers; lowballing is unlikely to land.
- 4 sale attempts since 20y ago with the ask held roughly flat each time — persistent listings suggest the price (not the market) is what's stuck; bring a comps-based counter.
- Current owner paid $325k; 46% above their basis — modest negotiation headroom, anchor on the comps not their cost.
Risks & watch-outs
- Watch-outs: flood insurance adds $66/mo.
- Climate carrying-cost: major flood risk; severe wind risk, 99% chance of damaging wind over 30y; extreme-heat days projected 7→21/yr by 2055 (HVAC capex compounding) — expect insurance premiums to compound above CPI over the hold.
Questions for the listing agent
- What's the actual annual flood-insurance premium (NFIP or private), and is the property in a SFHA with mandatory coverage?
- What does the HOA fee cover, when was the last increase, and are there any pending special assessments or reserve-fund shortfalls?
- Is there a deadline driving the sale (1031 exchange, divorce, estate, relocation)? That informs how much negotiation room exists.
- What's the average days-on-market for RENTAL listings here right now (not sales)? A rising rental-DOM trend means longer vacancies and softer asking-rent achievability than the comps imply.
- What's the recent tenant-quality profile in this submarket — average credit score on applications, eviction rate, late-payment / NSF rate, and stable-employment percentage? A property-management company in the area should have these aggregated.
- How much new for-sale + rental construction is in the pipeline within 1–3 miles? Heavy new supply typically softens prices + rents 12–24 months out; constrained supply supports both.
Investment metrics
- 1% rule
- 3.14% ✓
- Cap rate
- 29.00%
- Cash-on-cash
- 81.08%
- DSCR
- 4.61
- GRM
- 2.7
CMA / ARV
No comps found within radius.
Projected returns pro-forma
-3.0% appreciation · 3.0% rent growth · sell at horizon
- IRR
- 80.7%
- Equity multiple
- 4.69×
- Total profit
- $491,144
- Equity at exit
- $70,824
- IRR
- 84.1%
- Equity multiple
- 9.72×
- Total profit
- $1,159,129
- Equity at exit
- $41,069
Cash invested: $133,000 (down + closing). Projections, not guarantees.
Landlord ↔ Tenant lean methodology
- Overall (STATE)
- 85 Strongly Landlord-Friendly
- State North Carolina
- 85 Strongly Landlord-Friendly · R+3
- County
- — inherits STATE
- City
- — inherits STATE
ZIP-level market 28570
- Home prices YoY
- -16.2%
- Active inventory
- 216
- Price-to-rent
- 2.7×
Monthly cashflow live
- Estimated rent
- $14,918 medium interval (Pro) →
- Mortgage (P&I)
- −$2,491
- Tax from tax record
- −$84 /mo · $1,010/yr
- Insurance
- −$198
- Flood insurance flood zone
- −$66 /mo · $798/yr
- HOA
- −$25
- Vacancy / Maint / Mgmt
- −$3,133
- Net cashflow
- $8,920
Break-even live
UW: 25.0% down · 7.5% · 30yr · 1.5% tax · 5.0% vac · 8.0% maint · 8.0% mgmt
Financing live
Cash to close
- Down payment
- $118,750
- Closing costs
- $14,250
- Reserves months
- —
- Total cash needed
- —
Loan-product check · same deal, 3 products live
Conventional
25% down · 7.5% · 30yr
- Down + closing
- —
- Monthly P&I
- —
- Monthly cashflow
- —
- DSCR
- —
- Eligible?
- —
Personal DTI + credit; lowest rate.
DSCR
20% down · 8.5% · 30yr
- Down + closing
- —
- Monthly P&I
- —
- Monthly cashflow
- —
- DSCR
- —
- Eligible?
- —
No personal income docs; deal must DSCR.
Hard money
10% down · 12.0% · 12mo
- Down + closing
- —
- Monthly P&I
- —
- Monthly cashflow
- —
- DSCR
- —
- Eligible?
- —
Short-term bridge; refi at stabilization.
HOA detail
- Monthly dues
- $25 · $300/yr
- Likely covers
- electric
Listing history 11 events
-
2026-06-19days on market $475,000 Active 14 DOM
-
2026-06-18days on market $475,000 Active 13 DOM
-
2026-06-17days on market $475,000 Active 12 DOM
-
2026-06-16days on market $475,000 Active 11 DOM
-
2026-06-15days on market $475,000 Active 10 DOM
-
2026-06-14days on market $475,000 Active 8 DOM
-
2026-06-12days on market $475,000 Active 7 DOM
-
2026-06-09days on market $475,000 Active 4 DOM
-
2026-06-08days on market $475,000 Active 3 DOM
-
2026-06-07remarks 699-char remark
-
2026-06-07$475,000 Active 2 DOM
ⓘ Source: listings_history table (triggers on properties + properties_extension) + one-shot
backfill from property_details.listing_events for pre-trigger history.
Tax reassessment forecast NC · Resets to sale price
- Current annual tax
- $1,010 · $84/mo
- Projected year-2 tax
- $3,895 · $325/mo
- Expected delta
- +$2,885/yr (+$240/mo · 285.6%)
ⓘ Screening estimate from a state-policy table — verify with the county assessor before closing.
Climate risk First Street
- Flood 7/10 Severe FEMA zone X (unshaded) · 99% chance over 30 yrs
- Wildfire 4/10 Moderate
- Heat 9/10 Extreme 7 d/yr ≥102°F today · 21 d/yr by 30 yrs out
- Wind 8/10 Severe 99% chance of damaging wind over 30 yrs
- Air quality 2/10 Low 0 unhealthy d/yr today · 1 by 30 yrs out
Nearby sold comps map
Loading sold comps map…
Walkable amenities ~0.75 mi
Loading nearby amenities…
Taxation est. · year 1
- Rental income
- $179,012
- − Mortgage interest
- −$26,607
- − Property taxes
- −$1,010
- − Insurance
- −$3,172
- − Repairs & maintenance
- −$14,321
- − Management
- −$14,321
- − HOA
- −$300
- − Depreciation
- −$13,818
- Taxable income
- $105,461
- Est. tax owed @ 24.0%
- −$25,311
- After-tax cash flow
- $81,734/yr
For passive investors: Depreciation is non-cash, so a rental often shows a tax loss while cash-flowing — sheltering income. Rental losses are passive: they offset passive income freely, and up to $25,000/yr can offset ordinary (W-2) income if you actively participate and your MAGI is under $100k (phasing out to $0 by $150k); unused losses carry forward. On sale, claimed depreciation is recaptured at up to 25%, and gains may owe capital-gains tax (a 1031 exchange can defer both). Figures are a year-1 estimate at your 24.0% rate — not tax advice; consult a CPA.
Schools (NCES district)
- District
- Carteret County Public Schools
- NCES district ID
- 3700630
- Math proficiency
- 59% ▲ 5.00%
- Reading proficiency
- 61% ▲ 2.00%
- Median HH income
- $48,330
- Composite
- 50.92/100
- National rank
- #1786
- State rank
- #31 of 178 in NC
Livability — Newport
- Score
- 63/100
- State rank
- #385
- US rank
- #15094
Category grades
Schools grade is shown separately in the Schools card above.
Census & demographics
- Census place
- Newport, NC
- County
- Carteret County · 52,389 people
- City population
- 22,197
- Metro
- Morehead City, NC
- Population (ZIP)
- 22,197
- Household income
- $70,229
- Rent vs Own
- Severe rent burden
- 461.0
Population outlook (Carteret County) Hauer SSP2
- Today (2025)
- 73,443 people
- By 2030
- 75,344 · +2.6%
- By 2040
- 78,142 · +6.4%
- By 2050
- 80,091 · +9.1%
- By 2075
- 86,120 · +17.3%
- By 2100
- 89,408 · +21.7%
Race, ethnicity, and origin ACS 2023
- Neighborhood character
- Predominantly White (82%)
- Race & ethnicity
- White 82% Hispanic / Latino 7% Two or more races 6% Black 3% Asian 1%
- Hispanic origin (detail)
- Mexican 4%
- Common ancestry
- Slovak 3% Romanian 3% Lithuanian 2%
- Foreign-born
- 5% · Canada, Dominican Republic
- Languages at home
- 92% English-only · Spanish 6% German/W. Germanic 1%
Political lean MEDSL · Carteret
- 2024 margin
- Solid R (+43.1) · D 28.0% · R 71.1%
- 2008→2024 swing
- -8.4pp toward R · 2008: -34.7pp · 2024: -43.1pp
- All cycles
- 2024: R+43.1 2020: R+42.0 2016: R+44.5 2012: R+41.0 2008: R+34.7
Not yet ingested
- Civics
- —
Market trends
- HPI YoY
- ▼ -53.54%
- Current HPI
- 276.6589
- Rent YoY
- —
- Metro
- Morehead City, NC
- State GDP YoY
- ▲ 3.28%
- F500 in state
- 26
Industry mix (Fortune 500 HQ in NC)
| Industry | F500 HQs | Revenue |
|---|---|---|
| Financial Services | 2 | $213B |
|
||
| Retail | 2 | $95B |
|
||
| Industrial Conglomerate | 1 | $38B |
|
||
| Metals / Steel | 1 | $35B |
|
||
| Utilities | 1 | $30B |
|
||
| Industrial Machinery | 1 | $19B |
|
||
Price history
+82.7% since first listed8 events — show timeline
- 2026-06-05 Listed $475,000 Hive MLS
- 2021-12-15 Sold (Public Records) $325,000 Public Records
- 2021-12-15 Sold (MLS) $325,000 Hive MLS
- 2021-11-15 Listed $325,000 Hive MLS
- 2007-01-25 Sold (MLS) $285,000 Hive MLS
- 2007-01-25 Sold (MLS) $285,000 Hive MLS
- 2006-03-20 Listed $260,000 Hive MLS
- 2006-03-16 Listed $260,000 Hive MLS
Property tax history
+2.2%/yrLatest (2025): $1,010 · +2.8% YoY. Source: county tax records.
Cash-flow waterfall
monthlySold comps — $/sqft
last 12 mo · ≤1 miLoading sold comps…