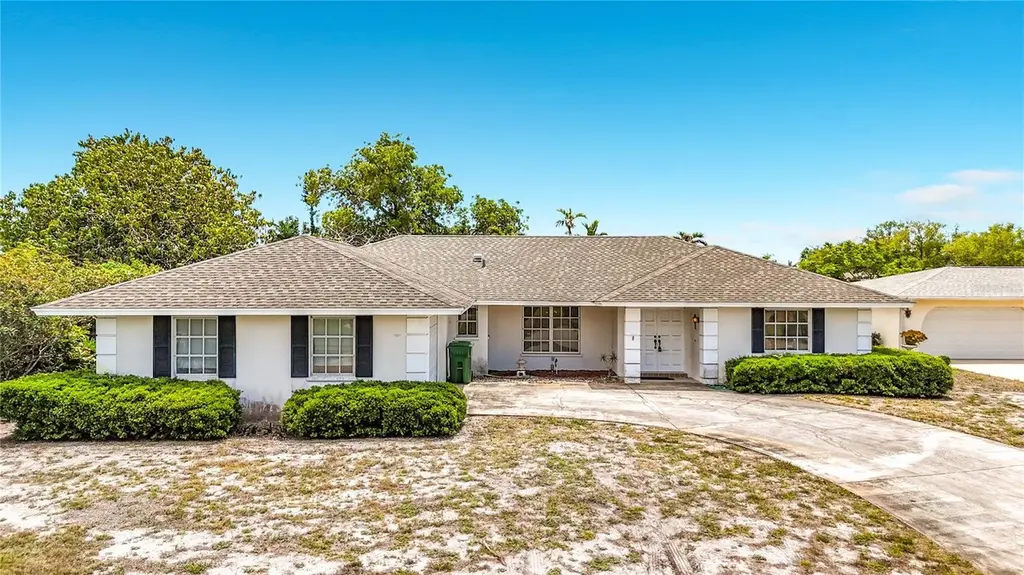
7401 13th Ave W · Bradenton, FL
Flood risk 1/10 · Minimal
- FEMA flood zone
- X (unshaded)
- Chance of flooding over 30 yrs
- 0.0%
- Est. flood insurance / yr
- $507 – $1,088
Fire risk 1/10 · Minimal
- Est. fire insurance / yr
- $947 – $1,759
Heat risk 10/10 · Severe
- Hot days now (above 107°F)
- 7 days/yr
- Hot days in 30 yrs
- 29 days/yr
Wind risk 10/10 · Severe
- Chance of severe wind over 30 yrs
- 99.0%
Air-quality risk 3/10 · Minor
- Unhealthy air days now
- 2 days/yr
- Unhealthy air days in 30 yrs
- 2 days/yr
Risk factors via First Street. Map © Google.
Why this score? — see what drove the C grade
The composite is a weighted blend of 9 inputs, each scored 0–100. Each bar is that input's sub-score; the figure is the points it added to the 100-point composite (weight × sub-score).
- Cash flow +19.6/30.0
- ARV discount +15.0/15.0
- DSCR +6.2/10.0
- Schools +4.4/10.0
- 1% rule +4.3/10.0
- Livability +4.0/5.0
- Condition / age +2.5/5.0
- Rent growth +2.4/5.0
- Appreciation +0.0/10.0
$340,000
🖨 Deal sheet 📄 Offer letter ✓ Due diligence
Listing remarks
Under contract-accepting backup offers. NEW TO MARKET- more photos coming soon! location. .. Location. .. LOCATION! UNLOCK YOUR COASTAL VISION! Why choose between the city and the sand when you can have it all? Perfectly positioned in the heart of convenience, this property puts the very best of Bradenton right at your doorstep. Whether you’re a beach lover, a commuter, or a weekend explorer, this location is the ultimate "home base. " Unlock incredible potential in one of Bradenton’s most sought-after pockets! If you’ve been searching for a true diamond in the rough, your search ends here. This property offers a rare opportunity to build significant equity
Key facts
- Downtown bradenton
- Medical centers
- Shopping
Tags
Property features AI
Finance
- Other: Homestead exempt; No lease restrictions
- HOA & community: No association fees
Exterior
- Parking: Attached garage; 2-car garage
- Utilities: Public water; Public sewer; Electricity connected; Water and sewer connected
- Home design: Single family residence; One story; North-facing entry; Residential property in fixer condition
- Construction: Block construction; Shingle roof; Slab foundation; Built on one level
- Exterior features: Sliding doors; Asphalt road access
Interior
- Kitchen: Dishwasher; Range; Microwave; Refrigerator; Electric water heater
- Bedrooms: 3 bedrooms
- Flooring: Carpet; Linoleum
- Bathrooms: 2 full bathrooms
- Heating & cooling: Electric heating; Central air conditioning
- Interior features: Split bedroom layout; Window treatments; 8 total rooms
- Laundry & utility: Washer; Dryer; Laundry located in garage
Neighborhood map
What this means for you Summary
Snapshot
- This is a 3-bed/2.0-bath single-family listed at $340k.
Deal economics
- At list price, monthly cash flow is $391 ($5k/yr) — positive.
- The deal already cash-flows at list — no discount required.
- To meet the 1% rule (rent ≥ 1% of price), the offer needs to be $317k (6.7% below list).
- Recommended offer: $317k (6.7% below list) — sets the bar for 1% rule.
- Cap rate 7.7% vs local median 3.6% in Bradenton — top-decile yield for the area; either an underpriced asset or a hidden risk that comps aren't pricing in. Stress-test before assuming the spread holds.
Location & tenants
- Location reads 81/100 on livability (#101 in FL, #1,528 nationally) — a professional / high-income tenant draw. Strengths: commute A+, cost of living A+, housing A+; Watch: employment D+, crime D, amenities F.
- Manatee (suburban): math 54% / reading 50% proficiency, ranked #26 of 73 in FL (top 36%) — acceptable for families but not a draw, mixed tenant base, ~2y average lease.
- Zoned schools: Palma Sola Elementary School (math 72% / reading 59%, grade B+, #500 of 2,144 statewide, top 24%, 434 students, 56% FRL); Manatee High School (math 32% / reading 47%, grade F, #304 of 667 statewide, top 47%, 1,983 students, 59% FRL).
- Market conditions: Rents soft (-0.3%/yr); 510 active listings in the ZIP; 40 comparable units currently listed for rent nearby; rentals at typical pace (median 24d on market — plan ~3-4 weeks tenant-placement turnaround); solid renter incomes; 7,472 units permitted in Manatee County in 2024 (1,782 in 5+ unit buildings).
- At $3,171/mo this rent would consume 47% of the median local household income ($82k/yr) (locally 1126% of renters already pay >50% of income on rent) — very limited rent-growth headroom before tenants either downsize or default.
Forward outlook
- Local home prices are declining (-3.0%/yr); year-one equity from $2k of loan paydown is wiped out by about $10k of value loss. Plan a longer hold.
- Manatee County population projected at +43% by 2050 — long-run rental-demand tailwind backs the buy-and-hold thesis.
Negotiation context
- Only 3 days on market — expect competitive offers; lowballing is unlikely to land.
Risks & watch-outs
- Climate carrying-cost: severe wind risk, 99% chance of damaging wind over 30y; extreme-heat days projected 7→29/yr by 2055 (HVAC capex compounding) — expect insurance premiums to compound above CPI over the hold.
Questions for the listing agent
- Built in 1973 — when were the roof, HVAC, electrical panel, plumbing, and water heater last replaced?
- Is there a deadline driving the sale (1031 exchange, divorce, estate, relocation)? That informs how much negotiation room exists.
- Crime grade is D in this area — have there been break-ins, vandalism, or insurance claims at this property in the last 3 years? What carrier currently insures it and at what premium?
- What's the average days-on-market for RENTAL listings here right now (not sales)? A rising rental-DOM trend means longer vacancies and softer asking-rent achievability than the comps imply.
- What's the recent tenant-quality profile in this submarket — average credit score on applications, eviction rate, late-payment / NSF rate, and stable-employment percentage? A property-management company in the area should have these aggregated.
- How much new for-sale + rental construction is in the pipeline within 1–3 miles? Heavy new supply typically softens prices + rents 12–24 months out; constrained supply supports both.
Investment metrics
- 1% rule
- 0.93% ✗
- Cap rate
- 7.67%
- Cash-on-cash
- 4.93%
- DSCR
- 1.22
- GRM
- 8.9
CMA / ARV
- ARV (on-the-fly)
- $526,854
- Comps found
- 12
Show comp detail 12 sales within ~0.75 mi
| Address | Dist | Beds/Ba | Sqft | Sold | Price | $/sf | Match |
|---|---|---|---|---|---|---|---|
| 7207 11th Ave W | 0.16mi | 3/2.0 | 1,880 (-1%) | 2mo | $484,030 | $257 | 89 |
| 1306 70th St W | 0.26mi | 3/2.0 | 1,852 (-3%) | 3mo | $557,000 | $301 | 81 |
| 1109 DE Narvaez Ave | 0.25mi | 4/2.5 (+1) | 2,000 (+5%) | 2mo | $820,000 | $410 | 71 |
| 6802 8th Ave W | 0.51mi | 2/2.0 (-1) | 1,913 (+1%) | 3mo | $300,000 | $157 | 68 |
| 7208 Pointe West Blvd | 0.50mi | 3/3.0 | 1,796 (-6%) | 2mo | $515,000 | $287 | 62 |
| 6622 10th Ave W #5707 | 0.50mi | 2/2.0 (-1) | 1,745 (-8%) | 3mo | $290,000 | $166 | 56 |
| 7211 25th Dr W | 0.73mi | 3/2.0 | 1,728 (-9%) | 2mo | $615,000 | $356 | 49 |
| 6910 Arbor Oaks Ct | 0.74mi | 3/2.0 | 1,730 (-9%) | 3mo | $479,000 | $277 | 48 |
| 1413 63rd St W | 0.69mi | 3/2.0 | 1,660 (-13%) | 1mo | $420,000 | $253 | 46 |
| 6520 10th Ave W #5714 | 0.56mi | 2/2.0 (-1) | 2,153 (+13%) | 1mo | $300,000 | $139 | 46 |
| 7807 Senrab Dr | 0.56mi | 2/2.0 (-1) | 1,626 (-14%) | 1mo | $536,000 | $330 | 44 |
| 7904 4th Ave W | 0.70mi | 3/2.0 | 1,650 (-13%) | 2mo | $365,000 | $221 | 44 |
Match score weights: distance 35% · size 25% · config 20% · recency 20%. Top-matched comps best support the ARV.
Projected returns pro-forma
-3.0% appreciation · 0.0% rent growth · sell at horizon
- IRR
- -11.8%
- Equity multiple
- 0.58×
- Total profit
- $-39,587
- Equity at exit
- $50,695
- IRR
- -7.3%
- Equity multiple
- 0.59×
- Total profit
- $-38,723
- Equity at exit
- $29,397
Cash invested: $95,200 (down + closing). Projections, not guarantees.
Landlord ↔ Tenant lean methodology
- Overall (STATE)
- 87 Strongly Landlord-Friendly
- State Florida
- 87 Strongly Landlord-Friendly · R+3
- County
- — inherits STATE
- City
- — inherits STATE
ZIP-level market 34209
- Rents YoY
- -0.3%
- Active inventory
- 510
- Price-to-rent
- 8.9×
Monthly cashflow live
- Estimated rent
- $3,171 high interval (Pro) →
- Mortgage (P&I)
- −$1,783
- Tax from tax record
- −$190 /mo · $2,278/yr
- Insurance
- −$142
- HOA
- −$0
- Vacancy / Maint / Mgmt
- −$666
- Net cashflow
- $391
Break-even live
UW: 25.0% down · 7.5% · 30yr · 1.5% tax · 5.0% vac · 8.0% maint · 8.0% mgmt
Financing live
Cash to close
- Down payment
- $85,000
- Closing costs
- $10,200
- Reserves months
- —
- Total cash needed
- —
Loan-product check · same deal, 3 products live
Conventional
25% down · 7.5% · 30yr
- Down + closing
- —
- Monthly P&I
- —
- Monthly cashflow
- —
- DSCR
- —
- Eligible?
- —
Personal DTI + credit; lowest rate.
DSCR
20% down · 8.5% · 30yr
- Down + closing
- —
- Monthly P&I
- —
- Monthly cashflow
- —
- DSCR
- —
- Eligible?
- —
No personal income docs; deal must DSCR.
Hard money
10% down · 12.0% · 12mo
- Down + closing
- —
- Monthly P&I
- —
- Monthly cashflow
- —
- DSCR
- —
- Eligible?
- —
Short-term bridge; refi at stabilization.
Rent comps 40 comps
| Address | Beds | Baths | Sqft | Rent | $/sqft | DOM | Units | Dist |
|---|---|---|---|---|---|---|---|---|
| 7207 15th Avenue Dr W Bradenton, FL | 3.0 | 2.0 | 1719 | $3,495 | $2.03 | 23d | 1 | 0.20mi |
| 1008 Estremadura Dr Bradenton, FL | 3.0 | 2.0 | 1698 | $2,995 | $1.76 | 23d | 1 | 0.29mi |
| 6914 20th Ave W Bradenton, FL | 2.0 | 2.0 | 1383 | $2,795 | $2.02 | 16d | 1 | 0.48mi |
| 7516 22nd Ave W Unit 1244473P Bradenton, FL | 4.0 | 2.0 | 1593 | $5,058 | $3.18 | 12d | 1 | 0.52mi |
| 7507 4th Ave W Unit 1546087P Bradenton, FL | 3.0 | 2.0 | 1474 | $2,258 | $1.53 | 16d | 1 | 0.60mi |
| 6652 7th Avenue Cir W Bradenton, FL | 3.0 | 2.0 | 1495 | $2,800 | $1.87 | 14d | 1 | 0.62mi |
| 6640 7th Avenue Cir W Unit 1513 Bradenton, FL | 3.0 | 2.0 | 1610 | $3,600 | $2.24 | 23d | 1 | 0.64mi |
| 6646 7th Avenue Cir W Bradenton, FL | 2.0 | 2.0 | 1440 | $2,500 | $1.74 | 23d | 1 | 0.64mi |
| 6446 7th Avenue Cir W Unit 6446 Bradenton, FL | 2.0 | 2.0 | 1440 | $2,400 | $1.67 | 23d | 1 | 0.67mi |
| 6618 7th Ave Cir W #1404 Bradenton, FL | 2.0 | 2.0 | 1440 | $3,400 | $2.36 | 23d | 1 | 0.67mi |
| 6448 7th Avenue Cir W Bradenton, FL | 3.0 | 2.0 | 1482 | $3,100 | $2.09 | 23d | 1 | 0.68mi |
| 7909 4th Ave W #12 Bradenton, FL | 3.0 | 2.0 | 1900 | $2,895 | $1.52 | 23d | 1 | 0.68mi |
| 6904 Manatee Ave W Bradenton, FL | 1.0–3.0 | 1.0–2.0 | 1068 | $2,050 | $1.92 | 1d | 76 | 0.74mi |
| 6908 Arbor Oaks Cir Bradenton, FL | 3.0 | 2.0 | 1600 | $3,200 | $2.00 | 3d | 1 | 0.75mi |
| 6108 10th Ave W Bradenton, FL | 3.0 | 2.0 | 1534 | $7,000 | $4.56 | 23d | 1 | 0.82mi |
| 6415 21st Ave W Bradenton, FL | 1.0–2.0 | 1.0–2.0 | 1150 | $1,896 | $1.65 | 3d | 5 | 0.82mi |
| 5911 7th Avenue Dr W Bradenton, FL | 3.0 | 2.0 | 1684 | $2,595 | $1.54 | 23d | 1 | 1.00mi |
| 7412 5th Ave NW Bradenton, FL | 3.0 | 2.0 | 1608 | $2,900 | $1.80 | 14d | 1 | 1.08mi |
| 7710 34th Ave W #303 Bradenton, FL | 3.0 | 2.5 | 1854 | $3,500 | $1.89 | 16d | 1 | 1.17mi |
| 7710 34th Ave W #202 Bradenton, FL | 2.0 | 2.0 | 1650 | $3,000 | $1.82 | 23d | 1 | 1.17mi |
| 7740 34th Ave W #203 Bradenton, FL | 3.0 | 2.5 | 1854 | $3,500 | $1.89 | 23d | 1 | 1.18mi |
| 7610 34th Ave W Unit 203 Bradenton, FL | 3.0 | 2.5 | 1857 | $3,000 | $1.62 | 23d | 1 | 1.19mi |
| 7610 34th Ave W #102 Bradenton, FL | 2.0 | 2.0 | 1657 | $2,600 | $1.57 | 23d | 1 | 1.19mi |
| 6709 35th Ave W Unit 1346494P Bradenton, FL | 3.0 | 2.0 | 1227 | $4,527 | $3.69 | 16d | 1 | 1.24mi |
| 7840 34th Ave W #202 Bradenton, FL | 2.0 | 2.0 | 1650 | $3,000 | $1.82 | 23d | 1 | 1.28mi |
| 7840 34th Ave W #102 Bradenton, FL | 2.0 | 2.0 | 1650 | $2,800 | $1.70 | 23d | 1 | 1.28mi |
| 7930 34th Ave W #102 Bradenton, FL | 2.0 | 2.0 | 1657 | $6,000 | $3.62 | 23d | 1 | 1.29mi |
| 7930 34th Ave W #303 Bradenton, FL | 3.0 | 2.5 | 1854 | $4,000 | $2.16 | 16d | 1 | 1.29mi |
| 3450 77th St W #303 Bradenton, FL | 3.0 | 2.5 | 1857 | $5,400 | $2.91 | 23d | 1 | 1.31mi |
| 5513 3rd Avenue Plz W Bradenton, FL | 3.0 | 2.0 | 1282 | $2,019 | $1.57 | 3d | 1 | 1.32mi |
| 7707 9th Avenue Dr NW Bradenton, FL | 3.0 | 2.0 | 1785 | $4,500 | $2.52 | 23d | 1 | 1.34mi |
| 709 84th St NW Bradenton, FL | 3.0 | 2.0 | 1360 | $3,500 | $2.57 | 20d | 1 | 1.35mi |
| 4122 Overture Cir #533 Bradenton, FL | 3.0 | 2.0 | 1381 | $2,900 | $2.10 | 23d | 1 | 1.35mi |
| 3412 79th Street Cir W #103 Bradenton, FL | 3.0 | 2.5 | 1854 | $3,500 | $1.89 | 23d | 1 | 1.36mi |
| 912 72nd St NW Bradenton, FL | 3.0 | 2.0 | 1544 | $3,800 | $2.46 | 23d | 1 | 1.36mi |
| 3418 79th Street Cir W #302 Bradenton, FL | 2.0 | 2.0 | 1657 | $2,949 | $1.78 | 16d | 1 | 1.37mi |
| 3426 79th Street Cir W #203 Bradenton, FL | 3.0 | 2.5 | 1857 | $5,100 | $2.75 | 23d | 1 | 1.37mi |
| 7242 Hamilton Rd Bradenton, FL | 3.0 | 2.5 | 1520 | $2,800 | $1.84 | 3d | 1 | 1.39mi |
| 5111 13th Avenue Dr W Bradenton, FL | 3.0 | 2.0 | 1778 | $3,700 | $2.08 | 23d | 1 | 1.43mi |
| 7202 Hamilton Rd Unit 7202 Bradenton, FL | 3.0 | 2.0 | 1277 | $2,250 | $1.76 | 16d | 1 | 1.45mi |
Listing history 2 events
-
2026-05-08status Pending
-
2026-05-04$340,000 Active
ⓘ Source: listings_history table (triggers on properties + properties_extension) + one-shot
backfill from property_details.listing_events for pre-trigger history.
Tax reassessment forecast FL · Resets to sale price
- Current annual tax
- $2,278 · $190/mo
- Projected year-2 tax
- $2,822 · $235/mo
- Expected delta
- +$544/yr (+$45/mo · 23.9%)
ⓘ Screening estimate from a state-policy table — verify with the county assessor before closing.
Climate risk First Street
- Flood 1/10 Low FEMA zone X (unshaded) · 0% chance over 30 yrs
- Wildfire 1/10 Low
- Heat 10/10 Extreme 7 d/yr ≥107°F today · 29 d/yr by 30 yrs out
- Wind 10/10 Extreme 99% chance of damaging wind over 30 yrs
- Air quality 3/10 Moderate 2 unhealthy d/yr today · 2 by 30 yrs out
Nearby sold comps map
Loading sold comps map…
Walkable amenities ~0.75 mi
Loading nearby amenities…
Taxation est. · year 1
- Rental income
- $38,057
- − Mortgage interest
- −$19,045
- − Property taxes
- −$2,278
- − Insurance
- −$1,700
- − Repairs & maintenance
- −$3,045
- − Management
- −$3,045
- − Depreciation
- −$9,891
- Taxable loss
- −$946
- Est. tax savings @ 24.0%
- +$227
- After-tax cash flow
- $4,918/yr
For passive investors: Depreciation is non-cash, so a rental often shows a tax loss while cash-flowing — sheltering income. Rental losses are passive: they offset passive income freely, and up to $25,000/yr can offset ordinary (W-2) income if you actively participate and your MAGI is under $100k (phasing out to $0 by $150k); unused losses carry forward. On sale, claimed depreciation is recaptured at up to 25%, and gains may owe capital-gains tax (a 1031 exchange can defer both). Figures are a year-1 estimate at your 24.0% rate — not tax advice; consult a CPA.
Schools (NCES district)
- District
- Manatee
- NCES district ID
- 1201230
- Math proficiency
- 54% ▼ -6.00%
- Reading proficiency
- 50% ▼ -2.00%
- Median HH income
- $49,607
- Composite
- 44.43/100
- National rank
- #2806
- State rank
- #26 of 73 in FL
Livability — Bradenton
- Score
- 81/100
- State rank
- #101
- US rank
- #1528
Category grades
Schools grade is shown separately in the Schools card above.
Census & demographics
- Census place
- Bradenton, FL
- County
- Manatee County · 416,364 people
- City population
- 227,091
- Metro
- North Port-Sarasota-Bradenton, FL
- Population (ZIP)
- 33,224
- Household income
- $81,728
- Rent vs Own
- Severe rent burden
- 1126.0
Population outlook (Manatee County) Hauer SSP2
- Today (2025)
- 447,342 people
- By 2030
- 488,911 · +9.3%
- By 2040
- 567,934 · +27.0%
- By 2050
- 637,995 · +42.6%
- By 2075
- 781,970 · +74.8%
- By 2100
- 848,272 · +89.6%
Race, ethnicity, and origin ACS 2023
- Neighborhood character
- Predominantly White (84%)
- Race & ethnicity
- White 84% Hispanic / Latino 11% Two or more races 6% Black 2% Asian 1%
- Hispanic origin (detail)
- Puerto Rican 4% Cuban 3%
- Common ancestry
- Romanian 3% Slovak 3% Lithuanian 3%
- Foreign-born
- 9% · Canada, Jamaica, China
- Languages at home
- 90% English-only · Spanish 6% Russian/Polish/Slavic 1% Other Indo-European 1%
Political lean MEDSL · Manatee
- 2024 margin
- Strong R (+23.5) · D 37.9% · R 61.4%
- 2008→2024 swing
- -16.5pp toward R · 2008: -7.0pp · 2024: -23.5pp
- All cycles
- 2024: R+23.5 2020: R+16.1 2016: R+17.1 2012: R+12.5 2008: R+7.0
Not yet ingested
- Civics
- —
Market trends
- HPI YoY
- ▼ -360.34%
- Current HPI
- 320.0061
- Rent YoY
- ▼ -0.30%
- Metro
- North Port-Sarasota-Bradenton, FL
- State GDP YoY
- ▲ 3.28%
- F500 in state
- 36
Industry mix (Fortune 500 HQ in FL)
| Industry | F500 HQs | Revenue |
|---|---|---|
| Industrial Technology | 2 | $29B |
|
||
| Insurance | 2 | $17B |
|
||
| Retail | 1 | $60B |
|
||
| Technology Distribution | 1 | $58B |
|
||
| Homebuilding | 1 | $35B |
|
||
| Technology Manufacturing | 1 | $35B |
|
||
Price history
2 events — show timeline
- 2026-05-08 Pending — Stellar MLS as Distributed by MLS Grid
- 2026-05-04 Listed $340,000 Stellar MLS as Distributed by MLS Grid
Property tax history
+2.0%/yrLatest (2025): $2,278 · +3.2% YoY. Source: county tax records.
Cash-flow waterfall
monthlySold comps — $/sqft
last 12 mo · ≤1 miLoading sold comps…