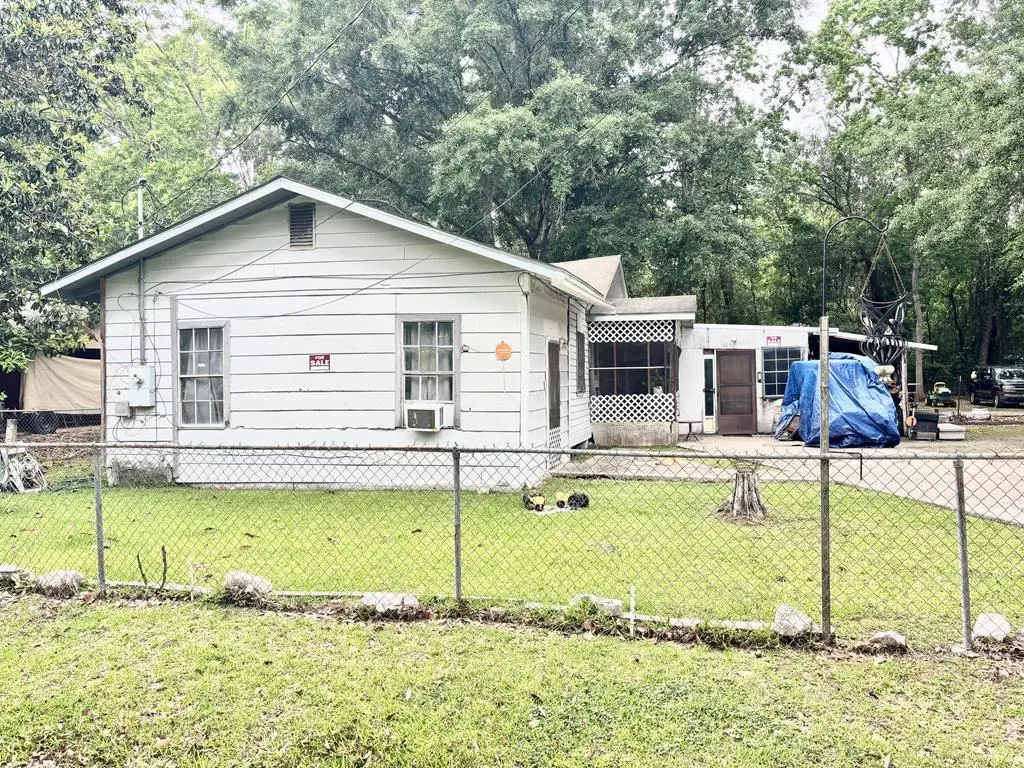
1616 Bender St · Picayune, MS
Flood risk 1/10 · Minimal
- FEMA flood zone
- X (unshaded)
- Chance of flooding over 30 yrs
- 0.0%
- Est. flood insurance / yr
- $507 – $1,088
Fire risk 5/10 · Moderate
- Est. fire insurance / yr
- $1,241 – $2,305
Heat risk 9/10 · Severe
- Hot days now (above 108°F)
- 7 days/yr
- Hot days in 30 yrs
- 20 days/yr
Wind risk 9/10 · Severe
- Chance of severe wind over 30 yrs
- 99.0%
Air-quality risk 1/10 · Minimal
- Unhealthy air days now
- 0 days/yr
- Unhealthy air days in 30 yrs
- 0 days/yr
Risk factors via First Street. Map © Google.
Why this score? — see what drove the B grade
The composite is a weighted blend of 9 inputs, each scored 0–100. Each bar is that input's sub-score; the figure is the points it added to the 100-point composite (weight × sub-score).
- Cash flow +29.7/30.0
- ARV discount +15.0/15.0
- DSCR +10.0/10.0
- 1% rule +8.4/10.0
- Livability +3.8/5.0
- Schools +2.7/10.0
- Rent growth +2.5/5.0
- Condition / age +2.5/5.0
- Appreciation +0.0/10.0
$100,000
🖨 Deal sheet (PDF) 📄 Offer letter ✓ Due diligence
Listing remarks
Attention investors. Give this 3 bedroom 1 ba home some TLC and turn it into a gem. Screen porch attached and shed. Fenced in yard. Close to schools, shopping, and parks. Minutes to I-59
Key facts
- Close to parks
- Close to schools
- Close to shopping
Tags
Property features AI
Exterior
- Parking: Other parking
- Utilities: Public water; Public sewer
- Home design: Residential property; One story
- Construction: HardiPlank type siding; Block and slab foundation; Built with standard residential construction
- Exterior features: City lot; Asphalt road; Shed(s); Other fencing
Interior
- Kitchen: Microwave; Dishwasher; Oven; Electric range
- Flooring: Laminate
- Bathrooms: 1 full bathroom
- Heating & cooling: Has heating; Window unit(s) for cooling
- Interior features: Microwave; Dishwasher; Dryer; Oven; Electric range; Laminate flooring; No fireplace; 6 total rooms; No basement
- Laundry & utility: Dryer
Neighborhood map
What this means for you Summary
Snapshot
- This is a 3-bed/1.0-bath single-family listed at $100k.
Deal economics
- At list price, monthly cash flow is $365 ($4k/yr) — positive.
- The deal already cash-flows at list — no discount required.
- Meets the 1% rule at list price ($1k rent vs $100k).
- Recommended offer: $97k (3.0% below list) — sets the bar for market timing.
- Cap rate 10.7% vs local median 3.3% in Picayune — top-decile yield for the area; either an underpriced asset or a hidden risk that comps aren't pricing in. Stress-test before assuming the spread holds.
Location & tenants
- Location reads 76/100 on livability (#11 in MS, #3,748 nationally) — a middle-class / working-renter tenant base. Strengths: cost of living A+, health & safety A+, amenities A; Watch: schools C-, commute F, employment F.
- Picayune School District (town): math 31% / reading 34% proficiency, ranked #60 of 130 in MS (top 46%) — families likely to look elsewhere, expect single-tenant / working-renter base with shorter leases; 73% free/reduced lunch — lower-income household profile, screen leases tightly.
- Market conditions: 344 active listings in the ZIP; 326 units permitted in Pearl River County in 2024 (0 in 5+ unit buildings).
Forward outlook
- Local home prices are declining (-3.0%/yr); year-one equity from $691 of loan paydown is wiped out by about $3k of value loss. Plan a longer hold.
- Pearl River County population projected at -19% by 2050 — secular population decline; favor cash flow + early exit over multi-decade hold.
- At projected returns (-3.0% appreciation + 3.0% rent growth), your $28k cash investment doubles in ~8 years — after that, you're playing with house money.
Negotiation context
- It's been on market 43 days — a 3% lower offer ($97k) is reasonable based on typical stale-listing flexibility.
Risks & watch-outs
- Climate carrying-cost: severe wind risk, 99% chance of damaging wind over 30y; moderate wildfire risk; extreme-heat days projected 7→20/yr by 2055 (HVAC capex compounding) — expect insurance premiums to compound above CPI over the hold.
Questions for the listing agent
- It's been on market 43 days. Have you received any prior offers? Is the seller open to a 3% concession, seller financing, or rate buy-down credit?
- Built in 1960 — when were the roof, HVAC, electrical panel, plumbing, and water heater last replaced?
- Is there a deadline driving the sale (1031 exchange, divorce, estate, relocation)? That informs how much negotiation room exists.
- What's the average days-on-market for RENTAL listings here right now (not sales)? A rising rental-DOM trend means longer vacancies and softer asking-rent achievability than the comps imply.
- What's the recent tenant-quality profile in this submarket — average credit score on applications, eviction rate, late-payment / NSF rate, and stable-employment percentage? A property-management company in the area should have these aggregated.
- How much new for-sale + rental construction is in the pipeline within 1–3 miles? Heavy new supply typically softens prices + rents 12–24 months out; constrained supply supports both.
Investment metrics
- 1% rule
- 1.34% ✓
- Cap rate
- 10.67%
- Cash-on-cash
- 15.64%
- DSCR
- 1.70
- GRM
- 6.2
CMA / ARV
- ARV (median comp)
- $145,632
- List price
- $100,000
- Delta
- -31.33%
- Verdict
- UNDERPRICED
- Comps
- 20 within 1.0 mi
Show comp detail 6 sales within ~0.75 mi
| Address | Dist | Beds/Ba | Sqft | Sold | Price | $/sf | Match |
|---|---|---|---|---|---|---|---|
| 847 Herrin Dr | 0.34mi | 3/1.5 | 1,196 (+4%) | 4mo | $159,500 | $133 | 71 |
| 1005 Abbott St | 0.51mi | 3/1.5 | 1,170 (+2%) | 0mo | $164,999 | $141 | 70 |
| 916 Central Ave Ave | 0.60mi | 3/2.0 | 1,233 (+8%) | 17mo | $189,000 | $153 | 41 |
| 904 Clover Cir | 0.61mi | 2/1.0 (-1) | 1,064 (-7%) | 20mo | $126,000 | $118 | 39 |
| 912 Central Ave | 0.59mi | 3/2.0 | 1,250 (+9%) | 22mo | $187,900 | $150 | 35 |
| 313 Rosa St | 0.75mi | 3/2.0 | 1,218 (+6%) | 22mo | $64,900 | $53 | 32 |
Match score weights: distance 35% · size 25% · config 20% · recency 20%. Top-matched comps best support the ARV.
Projected returns pro-forma
-3.0% appreciation · 3.0% rent growth · sell at horizon
- IRR
- 6.5%
- Equity multiple
- 1.25×
- Total profit
- $7,065
- Equity at exit
- $14,910
- IRR
- 15.8%
- Equity multiple
- 2.29×
- Total profit
- $36,171
- Equity at exit
- $8,646
Cash invested: $28,000 (down + closing). Projections, not guarantees.
Landlord ↔ Tenant lean methodology
- Overall (STATE)
- 90 Strongly Landlord-Friendly
- State Mississippi
- 90 Strongly Landlord-Friendly · R+11
- County
- — inherits STATE
- City
- — inherits STATE
ZIP-level market 39466
- Home prices YoY
- -26.3%
- Active inventory
- 344
- Price-to-rent
- 6.2×
Monthly cashflow live
- Estimated rent
- $1,337 medium interval (Pro) →
- Mortgage (P&I)
- −$524
- Tax est. 1.5%
- −$125 /mo · $1,500/yr
- Insurance
- −$42
- HOA
- −$0
- Vacancy / Maint / Mgmt
- −$281
- Net cashflow
- $365
Break-even live
Sensitivity live
| Price | -10% $434 | -5% $400 | +0% $365 | +5% $330 | +10% $296 |
|---|---|---|---|---|---|
| Rent | -10% $259 | -5% $312 | +0% $365 | +5% $418 | +10% $471 |
| Rate | -1.0pp $415 | -0.5pp $390 | base $365 | +0.5pp $339 | +1.0pp $313 |
UW: 25.0% down · 7.5% · 30yr · 1.5% tax · 5.0% vac · 8.0% maint · 8.0% mgmt
Financing live
Cash to close
- Down payment
- $25,000
- Closing costs
- $3,000
- Reserves months
- —
- Total cash needed
- —
Loan-product check · same deal, 3 products live
Conventional
25% down · 7.5% · 30yr
- Down + closing
- —
- Monthly P&I
- —
- Monthly cashflow
- —
- DSCR
- —
- Eligible?
- —
Personal DTI + credit; lowest rate.
DSCR
20% down · 8.5% · 30yr
- Down + closing
- —
- Monthly P&I
- —
- Monthly cashflow
- —
- DSCR
- —
- Eligible?
- —
No personal income docs; deal must DSCR.
Hard money
10% down · 12.0% · 12mo
- Down + closing
- —
- Monthly P&I
- —
- Monthly cashflow
- —
- DSCR
- —
- Eligible?
- —
Short-term bridge; refi at stabilization.
Listing history 15 events
-
2026-06-18days on market $100,000 Active 43 DOM
-
2026-06-17days on market $100,000 Active 42 DOM
-
2026-06-16days on market $100,000 Active 41 DOM
-
2026-06-15days on market $100,000 Active 40 DOM
-
2026-06-13days on market $100,000 Active 38 DOM
-
2026-06-12days on market $100,000 Active 37 DOM
-
2026-06-09days on market $100,000 Active 34 DOM
-
2026-06-08days on market $100,000 Active 33 DOM
-
2026-06-07days on market $100,000 Active 32 DOM
-
2026-06-07days on market $100,000 Active 31 DOM
-
2026-06-04days on market $100,000 Active 28 DOM
-
2026-06-03days on market $100,000 Active 27 DOM
-
2026-06-01days on market $100,000 Active 26 DOM
-
2026-05-31days on market $100,000 Active 25 DOM
-
2026-05-06$100,000 Active 187-char remark
ⓘ Source: listings_history table (triggers on properties + properties_extension) + one-shot
backfill from property_details.listing_events for pre-trigger history.
Climate risk First Street
- Flood 1/10 Low FEMA zone X (unshaded) · 0% chance over 30 yrs
- Wildfire 5/10 Major
- Heat 9/10 Extreme 7 d/yr ≥108°F today · 20 d/yr by 30 yrs out
- Wind 9/10 Extreme 99% chance of damaging wind over 30 yrs
- Air quality 1/10 Low 0 unhealthy d/yr today · 0 by 30 yrs out
Nearby sold comps map
Loading sold comps map…
Walkable amenities ~0.75 mi
Loading nearby amenities…
Taxation est. · year 1
- Rental income
- $16,042
- − Mortgage interest
- −$5,602
- − Property taxes
- −$1,500
- − Insurance
- −$500
- − Repairs & maintenance
- −$1,283
- − Management
- −$1,283
- − Depreciation
- −$2,909
- Taxable income
- $2,965
- Est. tax owed @ 24.0%
- −$712
- After-tax cash flow
- $3,669/yr
For passive investors: Depreciation is non-cash, so a rental often shows a tax loss while cash-flowing — sheltering income. Rental losses are passive: they offset passive income freely, and up to $25,000/yr can offset ordinary (W-2) income if you actively participate and your MAGI is under $100k (phasing out to $0 by $150k); unused losses carry forward. On sale, claimed depreciation is recaptured at up to 25%, and gains may owe capital-gains tax (a 1031 exchange can defer both). Figures are a year-1 estimate at your 24.0% rate — not tax advice; consult a CPA.
Schools (NCES district)
- District
- Picayune School District
- NCES district ID
- 2803630
- Math proficiency
- 31% ▼ -12.00%
- Reading proficiency
- 34% ▼ -9.00%
- Median HH income
- $38,446
- Composite
- 27.17/100
- National rank
- #7025
- State rank
- #60 of 130 in MS
Livability — Picayune
- Score
- 76/100
- State rank
- #11
- US rank
- #3748
Category grades
Schools grade is shown separately in the Schools card above.
Census & demographics
- Census place
- Picayune, MS
- Population (ZIP)
- 28,292
Population outlook (Pearl River County) Hauer SSP2
- Today (2025)
- 53,426 people
- By 2030
- 51,663 · -3.3%
- By 2040
- 47,611 · -10.9%
- By 2050
- 43,286 · -19.0%
- By 2075
- 32,859 · -38.5%
- By 2100
- 22,476 · -57.9%
Race, ethnicity, and origin ACS 2023
- Neighborhood character
- Predominantly White (72%)
- Race & ethnicity
- White 72% Black 18% Two or more races 6% Hispanic / Latino 6%
- Hispanic origin (detail)
- Mexican 1%
- Common ancestry
- Lithuanian 9% Iranian 1% Slovak 1%
- Foreign-born
- 2% · Canada
- Languages at home
- 96% English-only · Spanish 3%
Political lean MEDSL · Pearl River
- 2024 margin
- Solid R (+66.7) · D 16.1% · R 82.8% · Other 1.0%
- 2008→2024 swing
- -6.3pp toward R · 2008: -60.4pp · 2024: -66.7pp
- All cycles
- 2024: R+66.7 2020: R+64.2 2016: R+66.8 2012: R+60.3 2008: R+60.4
Not yet ingested
- Civics
- —
Market trends
- HPI YoY
- ▼ -69.32%
- Current HPI
- 194.6541
- Rent YoY
- —
- Metro
- —
- State GDP YoY
- —
- F500 in state
- 0
Price history
1 event — show timeline
- 2026-05-06 Listed $100,000 PRCBOR
Property tax history
+2.8%/yrLatest (2019): $129 · -0.4% YoY. Source: county tax records.
Cash-flow waterfall
monthlySold comps — $/sqft
last 12 mo · ≤1 miLoading sold comps…