 🏷️ Likely Rental
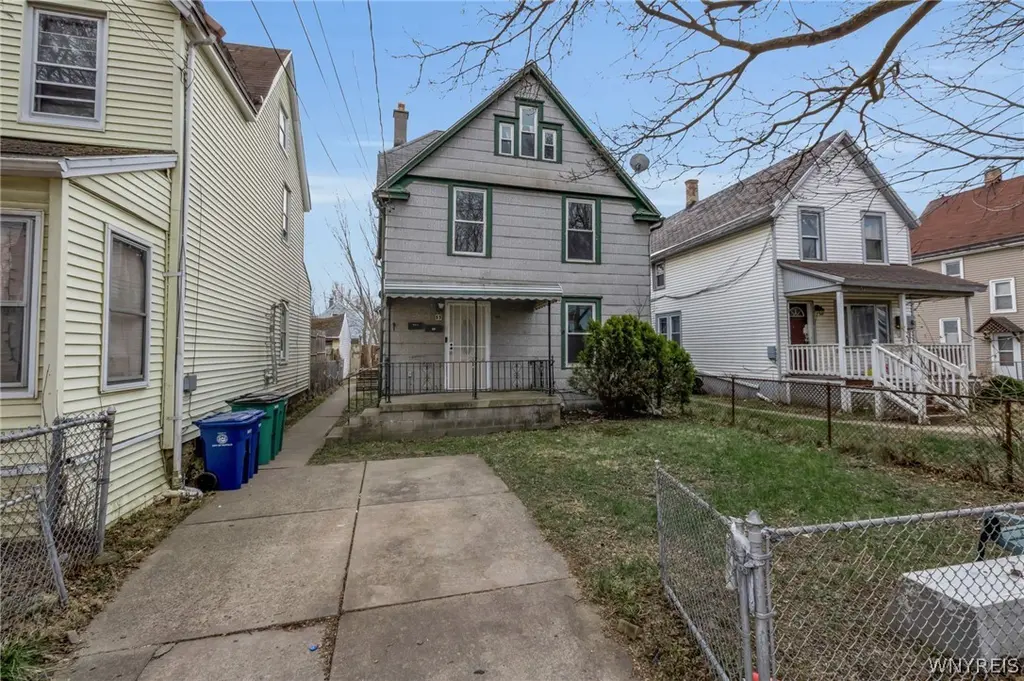
53 Sirret St · Buffalo, NY
Flood risk 7/10 · Major
- FEMA flood zone
- X (unshaded)
- Chance of flooding over 30 yrs
- 0.77%
- Est. flood insurance / yr
- $473 – $860
Fire risk 1/10 · Minimal
- Est. fire insurance / yr
- $691 – $1,283
Heat risk 3/10 · Minor
- Hot days now (above 92°F)
- 7 days/yr
- Hot days in 30 yrs
- 15 days/yr
Wind risk 1/10 · Minimal
- Chance of severe wind over 30 yrs
- —
Air-quality risk 3/10 · Minor
- Unhealthy air days now
- 2 days/yr
- Unhealthy air days in 30 yrs
- 3 days/yr
Risk factors via First Street. Map © Google.
Why this score? — see what drove the B+ grade
The composite is a weighted blend of 9 inputs, each scored 0–100. Each bar is that input's sub-score; the figure is the points it added to the 100-point composite (weight × sub-score).
- Cash flow +30.0/30.0
- ARV discount +15.0/15.0
- 1% rule +10.0/10.0
- DSCR +10.0/10.0
- Rent growth +4.4/5.0
- Livability +3.9/5.0
- Schools +3.3/10.0
- Condition / age +2.5/5.0
- Appreciation +0.0/10.0
$159,900
🖨 Deal sheet 📄 Offer letter ✓ Due diligence
Multi-family units
County records classify this as Multi-Family (2-4 Unit). Listing-text estimate: 1 unit. estimate disagrees with records
Listing remarks MLS
Investment Opportunity or Owner-Occupant Potential in Buffalo! Welcome to 53 Sirret Street, a well-maintained two-unit property offering excellent income potential and long-term value. This property features a spacious 3-bedroom lower unit and a 2-bedroom upper unit, both currently vacant and ready for occupancy. Based on previous rental history, the property has the potential to generate up to $2,400 per month in total rental income. Additional highlights include off-street driveway parking and a large rear storage shed, adding convenience for both tenants and owners. Ideally located just minutes from major employers, including Tesla, this property is well-positioned to benefit from strong and consistent rental demand. Whether you're looking to expand your investment portfolio or occupy one unit while generating income from the other, 53 Sirret Street presents a fantastic opportunity!
Key facts
- Two unit property
- 3,120 sq ft lot
- Built 1910
Tags
Neighborhood map
What this means for you Summary
Snapshot
- This is a 4-bed/2.0-bath multifamily listed at $160k.
Deal economics
- At list price, monthly cash flow is $769 ($9k/yr) — positive.
- The deal already cash-flows at list — no discount required.
- Meets the 1% rule at list price ($2k rent vs $160k).
- Recommended offer: $150k (6.0% below list) — sets the bar for market timing.
- Cap rate 12.5% vs local median 8.0% in Buffalo — top-decile yield for the area; either an underpriced asset or a hidden risk that comps aren't pricing in. Stress-test before assuming the spread holds.
Location & tenants
- Location reads 77/100 on livability (#195 in NY, #3,011 nationally) — a middle-class / working-renter tenant base. Strengths: commute A+, housing A+, health & safety A+; Watch: crime F, employment D-.
- Buffalo City School District (urban): math 41% / reading 40% proficiency, ranked #535 of 590 in NY (top 91%) — families likely to look elsewhere, expect single-tenant / working-renter base with shorter leases; 75% free/reduced lunch — lower-income household profile, screen leases tightly.
- Market conditions: Rents rising fast (+7.6%/yr); 136 active listings in the ZIP; 11 comparable units currently listed for rent nearby; rentals at typical pace (median 15d on market — plan ~3-4 weeks tenant-placement turnaround); 1,244 units permitted in Erie County in 2024 (563 in 5+ unit buildings).
- This rent runs 41% of the median local income ($71k/yr) — at the standard rent-burdened threshold; future hikes will face affordability resistance.
Forward outlook
- Local home prices are declining (-3.0%/yr); year-one equity from $1k of loan paydown is wiped out by about $5k of value loss. Plan a longer hold.
- At projected returns (-3.0% appreciation + 7.6% rent growth), your $45k cash investment doubles in ~5 years — after that, you're playing with house money.
Negotiation context
- It's been on market 69 days — a 6% lower offer ($150k) is reasonable based on typical stale-listing flexibility.
- 5 sale attempts since 7y ago with the ask held roughly flat each time — persistent listings suggest the price (not the market) is what's stuck; bring a comps-based counter.
- Current owner paid $55k; list at $160k implies a 191% gain — meaningful room to come down on a strong offer.
Risks & watch-outs
- Watch-outs: flood insurance adds $56/mo; built in 1910 — expect roof / HVAC / electrical / plumbing capex.
- Climate carrying-cost: major flood risk — expect insurance premiums to compound above CPI over the hold.
Questions for the listing agent
- It's been on market 69 days. Have you received any prior offers? Is the seller open to a 6% concession, seller financing, or rate buy-down credit?
- Built in 1910 — when were the roof, HVAC, electrical panel, plumbing, and water heater last replaced?
- What's the actual annual flood-insurance premium (NFIP or private), and is the property in a SFHA with mandatory coverage?
- Why hasn't it sold? Are there any deal-killer items the seller is aware of (foundation, flood, title, zoning, code violations)?
- Is there a deadline driving the sale (1031 exchange, divorce, estate, relocation)? That informs how much negotiation room exists.
- Crime grade is F in this area — have there been break-ins, vandalism, or insurance claims at this property in the last 3 years? What carrier currently insures it and at what premium?
- What's the average days-on-market for RENTAL listings here right now (not sales)? A rising rental-DOM trend means longer vacancies and softer asking-rent achievability than the comps imply.
- What's the recent tenant-quality profile in this submarket — average credit score on applications, eviction rate, late-payment / NSF rate, and stable-employment percentage? A property-management company in the area should have these aggregated.
- How much new apartment / multifamily construction is in the pipeline within 1–3 miles? Heavy new supply (>2% of stock underway) typically softens rents 12–24 months out; light construction supports rent growth.
Investment metrics
- 1% rule
- 1.53% ✓
- Cap rate
- 12.48%
- Cash-on-cash
- 22.11%
- DSCR
- 1.98
- GRM
- 5.5
CMA / ARV
- ARV (median comp)
- $313,198
- List price
- $159,900
- Delta
- -48.95%
- Verdict
- UNDERPRICED
- Comps
- 20 within 1.0 mi
Show comp detail 4 sales within ~0.75 mi
| Address | Dist | Beds/Ba | Sqft | Sold | Price | $/sf | Match |
|---|---|---|---|---|---|---|---|
| 61 Sirret St | 0.01mi | 4/2.0 | 1,371 (-4%) | 9mo | $65,000 | $47 | 84 |
| 119 Trowbridge St | 0.23mi | 3/2.0 (-1) | 1,505 (+5%) | 12mo | $133,400 | $89 | 67 |
| 199 Amber St | 0.69mi | 3/2.0 (-1) | 1,543 (+8%) | 10mo | $159,900 | $104 | 42 |
| 79 Eaglewood Ave | 0.71mi | 3/2.0 (-1) | 1,267 (-12%) | 5mo | $181,000 | $143 | 38 |
Match score weights: distance 35% · size 25% · config 20% · recency 20%. Top-matched comps best support the ARV.
Projected returns pro-forma
-3.0% appreciation · 7.62% rent growth · sell at horizon
- IRR
- 18.2%
- Equity multiple
- 1.78×
- Total profit
- $35,048
- Equity at exit
- $23,842
- IRR
- 29.8%
- Equity multiple
- 4.30×
- Total profit
- $147,568
- Equity at exit
- $13,825
Cash invested: $44,772 (down + closing). Projections, not guarantees.
Landlord ↔ Tenant lean methodology
- Overall (STATE)
- 15 Strongly Tenant-Friendly
- State New York
- 15 Strongly Tenant-Friendly · D+10
- County
- — inherits STATE
- City
- — inherits STATE
ZIP-level market 14220
- Home prices YoY
- -26.7%
- Rents YoY
- 7.6%
- Active inventory
- 136
- Price-to-rent
- 9.9×
Monthly cashflow live
- Estimated rent
- $2,443 medium interval (Pro) →
- Mortgage (P&I)
- −$839
- Tax est. 1.5%
- −$200 /mo · $2,398/yr
- Insurance
- −$67
- Flood insurance flood zone
- −$56 /mo · $666/yr
- HOA
- −$0
- Vacancy / Maint / Mgmt
- −$513
- Net cashflow
- $769
Break-even live
2-unit breakdown (identical units grouped — click to expand)
| Units | Beds | Baths | Est. rent |
|---|---|---|---|
| 1× unit | 3 | 1 | $1,348 |
| 1× unit | 2 | 1 | $1,095 |
| Total (2 units) | $2,443 | ||
UW: 25.0% down · 7.5% · 30yr · 1.5% tax · 5.0% vac · 8.0% maint · 8.0% mgmt
Financing live
Cash to close
- Down payment
- $39,975
- Closing costs
- $4,797
- Reserves months
- —
- Total cash needed
- —
Loan-product check · same deal, 3 products live
Conventional
25% down · 7.5% · 30yr
- Down + closing
- —
- Monthly P&I
- —
- Monthly cashflow
- —
- DSCR
- —
- Eligible?
- —
Personal DTI + credit; lowest rate.
DSCR
20% down · 8.5% · 30yr
- Down + closing
- —
- Monthly P&I
- —
- Monthly cashflow
- —
- DSCR
- —
- Eligible?
- —
No personal income docs; deal must DSCR.
Hard money
10% down · 12.0% · 12mo
- Down + closing
- —
- Monthly P&I
- —
- Monthly cashflow
- —
- DSCR
- —
- Eligible?
- —
Short-term bridge; refi at stabilization.
Rent comps 11 comps
| Address | Beds | Baths | Sqft | Rent | $/sqft | DOM | Units | Dist |
|---|---|---|---|---|---|---|---|---|
| 89 Macamley St #2 Buffalo, NY | 3.0 | 1.0 | 1274 | $1,100 | $0.86 | 10d | 1 | 0.19mi |
| 700 Hopkins St Buffalo, NY | 3.0 | 1.0 | 1100 | $1,225 | $1.11 | 14d | 1 | 0.23mi |
| 76 Hammerschmidt Ave Buffalo, NY | 3.0 | 1.0 | 1200 | $1,275 | $1.06 | 2d | 1 | 0.75mi |
| 298 Cumberland Ave Buffalo, NY | 3.0 | 1.5 | 1208 | $2,200 | $1.82 | 1d | 1 | 0.78mi |
| 1899 Seneca St Buffalo, NY | 3.0 | 1.0 | 1134 | $1,075 | $0.95 | 14d | 1 | 0.86mi |
| 1927 Seneca St Buffalo, NY | 3.0 | 1.0 | 1196 | $1,250 | $1.05 | 23d | 1 | 0.89mi |
| 74 Woodside Ave Unit 1 Buffalo, NY | 3.0 | 1.0 | 1250 | $1,510 | $1.21 | 1d | 1 | 0.93mi |
| 34 Hayden St Unit Back Buffalo, NY | 3.0 | 1.0 | 1200 | $1,600 | $1.33 | 43d | 1 | 1.00mi |
| 47 Lester St Unit Main Floor Buffalo, NY | 3.0 | 1.0 | 900 | $1,000 | $1.11 | 43d | 1 | 1.09mi |
| 901 S Park Ave Unit Lower Buffalo, NY | 4.0 | 1.0 | 1729 | $1,600 | $0.93 | 23d | 1 | 1.27mi |
| 23 Indian Orchard Pl Unit Lower Buffalo, NY | 3.0 | 1.0 | 1200 | $1,250 | $1.04 | 43d | 1 | 1.37mi |
Listing history 31 events
-
2026-06-18days on market $159,900 Active 69 DOM
-
2026-06-17days on market $159,900 Active 68 DOM
-
2026-06-16days on market $159,900 Active 67 DOM
-
2026-06-15days on market $159,900 Active 66 DOM
-
2026-06-13days on market $159,900 Active 64 DOM
-
2026-06-13days on market $159,900 Active 63 DOM
-
2026-06-10days on market $159,900 Active 61 DOM
-
2026-06-09days on market $159,900 Active 60 DOM
-
2026-06-08days on market $159,900 Active 59 DOM
-
2026-06-07days on market $159,900 Active 58 DOM
-
2026-06-03days on market $159,900 Active 54 DOM
-
2026-06-02days on market $159,900 Active 53 DOM
-
2026-06-01days on market $159,900 Active 52 DOM
-
2026-05-31days on market $159,900 Active 51 DOM
-
2026-04-10$159,900 Active 901-char remark
Show marketing remark (901 chars)
Investment Opportunity or Owner-Occupant Potential in Buffalo! Welcome to 53 Sirret Street, a well-maintained two-unit property offering excellent income potential and long-term value. This property features a spacious 3-bedroom lower unit and a 2-bedroom upper unit, both currently vacant and ready for occupancy. Based on previous rental history, the property has the potential to generate up to $2,400 per month in total rental income. Additional highlights include off-street driveway parking and a large rear storage shed, adding convenience for both tenants and owners. Ideally located just minutes from major employers, including Tesla, this property is well-positioned to benefit from strong and consistent rental demand. Whether you're looking to expand your investment portfolio or occupy one unit while generating income from the other, 53 Sirret Street presents a fantastic opportunity!
-
2025-02-06status Pending
-
2025-02-06historical
-
2025-01-28price $187,500
-
2024-12-02$194,900 Active
-
2023-09-29soldstatus $55,000 Closed Sale or Rented
-
2023-09-29soldstatus $55,000
-
2023-08-10status Under Contract- Do Not Show
-
2023-08-04$44,900 Active
-
2023-04-25historical
-
2023-04-07$49,900 Active
-
2023-04-03soldstatus $33,500
-
2019-08-16historical
-
2019-07-31$72,000 Active
-
2014-07-31soldstatus $15,500
-
2006-08-28soldstatus $28,000
-
2005-08-10soldstatus $14,900
ⓘ Source: listings_history table (triggers on properties + properties_extension) + one-shot
backfill from property_details.listing_events for pre-trigger history.
Climate risk First Street
- Flood 7/10 Severe FEMA zone X (unshaded) · 77% chance over 30 yrs
- Wildfire 1/10 Low
- Heat 3/10 Moderate 7 d/yr ≥92°F today · 15 d/yr by 30 yrs out
- Wind 1/10 Low
- Air quality 3/10 Moderate 2 unhealthy d/yr today · 3 by 30 yrs out
Nearby sold comps map
Loading sold comps map…
Walkable amenities ~0.75 mi
Loading nearby amenities…
Taxation est. · year 1
- Rental income
- $29,316
- − Mortgage interest
- −$8,957
- − Property taxes
- −$2,398
- − Insurance
- −$1,466
- − Repairs & maintenance
- −$2,345
- − Management
- −$2,345
- − Depreciation
- −$4,652
- Taxable income
- $7,152
- Est. tax owed @ 24.0%
- −$1,717
- After-tax cash flow
- $7,516/yr
For passive investors: Depreciation is non-cash, so a rental often shows a tax loss while cash-flowing — sheltering income. Rental losses are passive: they offset passive income freely, and up to $25,000/yr can offset ordinary (W-2) income if you actively participate and your MAGI is under $100k (phasing out to $0 by $150k); unused losses carry forward. On sale, claimed depreciation is recaptured at up to 25%, and gains may owe capital-gains tax (a 1031 exchange can defer both). Figures are a year-1 estimate at your 24.0% rate — not tax advice; consult a CPA.
Schools (NCES district)
- District
- Buffalo City School District
- NCES district ID
- 3605850
- Math proficiency
- 41% ▲ 11.00%
- Reading proficiency
- 40% ▲ 7.00%
- Median HH income
- $31,665
- Composite
- 33.17/100
- National rank
- #5544
- State rank
- #535 of 590 in NY
Livability — Buffalo
- Score
- 77/100
- State rank
- #195
- US rank
- #3011
Category grades
Schools grade is shown separately in the Schools card above.
Census & demographics
- Census place
- Buffalo, NY
- County
- Erie County · 714,559 people
- City population
- 440,021
- Metro
- Buffalo-Cheektowaga, NY
- Population (ZIP)
- 24,428
- Household income
- $70,963
- Rent vs Own
- Severe rent burden
- 602.0
Population outlook (Erie County) Hauer SSP2
- Today (2025)
- 933,037 people
- By 2030
- 935,181 · +0.2%
- By 2040
- 928,531 · -0.5%
- By 2050
- 905,725 · -2.9%
- By 2075
- 834,037 · -10.6%
- By 2100
- 708,033 · -24.1%
Race, ethnicity, and origin ACS 2023
- Neighborhood character
- Predominantly White (76%)
- Race & ethnicity
- White 76% Hispanic / Latino 13% Two or more races 6% Black 5% Asian 2%
- Hispanic origin (detail)
- Puerto Rican 10% Cuban 1%
- Common ancestry
- Romanian 16% Lithuanian 1% Subsaharan African 1%
- Foreign-born
- 4% · Canada, Jamaica, China
- Languages at home
- 90% English-only · Spanish 4% Chinese 1%
Political lean MEDSL · Erie
- 2024 margin
- Lean D (+9.7) · D 54.8% · R 45.2%
- 2008→2024 swing
- -7.9pp toward R · 2008: 17.5pp · 2024: 9.7pp
- All cycles
- 2024: D+9.7 2020: D+14.7 2016: D+4.8 2012: D+15.6 2008: D+17.5
Not yet ingested
- Civics
- —
Market trends
- HPI YoY
- ▼ -146.29%
- Current HPI
- 402.5053
- Rent YoY
- ▲ 7.62%
- Metro
- Buffalo-Cheektowaga, NY
- State GDP YoY
- ▲ 2.60%
- F500 in state
- 92
Industry mix (Fortune 500 HQ in NY)
| Industry | F500 HQs | Revenue |
|---|---|---|
| Financial Services | 10 | $950B |
|
||
| Consumer Goods | 9 | $162B |
|
||
| Insurance | 4 | $225B |
|
||
| Telecommunications | 2 | $144B |
|
||
| Pharmaceuticals | 2 | $112B |
|
||
| Media / Entertainment | 2 | $69B |
|
||
Price history
+973.2% since first listed17 events — show timeline
- 2026-04-10 Listed $159,900 WNYREIS
- 2025-02-06 Pending — WNYREIS
- 2025-02-06 Listing Removed — WNYREIS
- 2025-01-28 Price Changed $187,500 WNYREIS
- 2024-12-02 Listed $194,900 WNYREIS
- 2023-09-29 Sold (Public Records) $55,000 Public Records
- 2023-09-29 Sold (MLS) $55,000 WNYREIS
- 2023-08-10 Pending — WNYREIS
- 2023-08-04 Listed $44,900 WNYREIS
- 2023-04-25 Listing Removed — WNYREIS
- 2023-04-07 Listed $49,900 WNYREIS
- 2023-04-03 Sold (Public Records) $33,500 Public Records
- 2019-08-16 Listing Removed — WNYREIS
- 2019-07-31 Listed $72,000 WNYREIS
- 2014-07-31 Sold (Public Records) $15,500 Public Records
- 2006-08-28 Sold (Public Records) $28,000 Public Records
- 2005-08-10 Sold (Public Records) $14,900 Public Records
Property tax history
+1.9%/yrLatest (2025): $247 · +0.0% YoY. Source: county tax records.
Cash-flow waterfall
monthlySold comps — $/sqft
last 12 mo · ≤1 miLoading sold comps…