 🏷️ Likely Rental
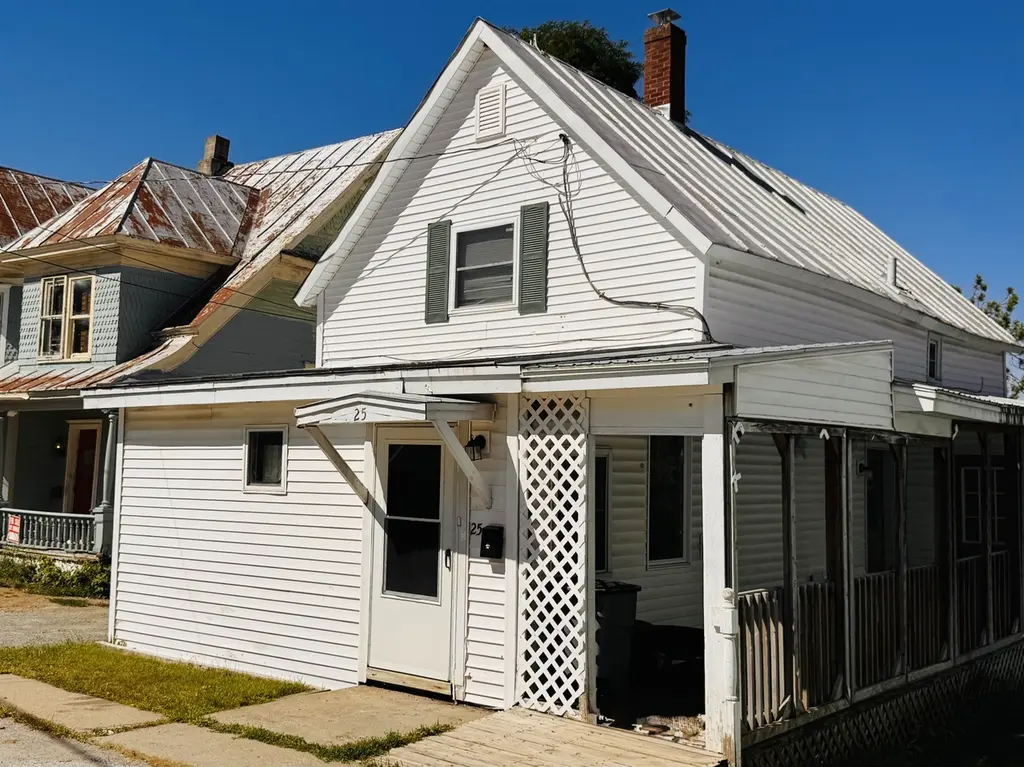
25 Sweat St · Richford, VT
Flood risk No data
- FEMA flood zone
- —
- Chance of flooding over 30 yrs
- —
- Est. flood insurance / yr
- —
Fire risk No data
- Est. fire insurance / yr
- —
Heat risk No data
- Hot days now (above threshold)
- —
- Hot days in 30 yrs
- —
Wind risk No data
- Chance of severe wind over 30 yrs
- —
Air-quality risk No data
- Unhealthy air days now
- —
- Unhealthy air days in 30 yrs
- —
Risk factors via First Street. Map © Google.
Why this score? — see what drove the B grade
The composite is a weighted blend of 9 inputs, each scored 0–100. Each bar is that input's sub-score; the figure is the points it added to the 100-point composite (weight × sub-score).
- Cash flow +24.9/30.0
- ARV discount +15.0/15.0
- DSCR +8.1/10.0
- 1% rule +5.8/10.0
- Appreciation +5.5/10.0
- Schools +5.0/10.0
- Livability +3.4/5.0
- Rent growth +2.5/5.0
- Condition / age +2.5/5.0
$149,300
🖨 Deal sheet 📄 Offer letter ✓ Due diligence
Listing remarks MLS
Great investment opportunity in Richford, Vermont! Located on a quiet hilltop where Sweat Street and Highland Avenue meet, this offering includes two adjoining lots with versatility. At 25 Sweat Street sits an updated 3-bedroom, 2-bath home featuring a bright living room, dining area, walk-through kitchen, three bedrooms, two baths, and a flexible sitting room or office. Dedicated off-street parking adds convenience, while mature trees, a crabapple, and blackberry bushes enhance the natural setting. The adjoining lot at 62 Highland Ave. connects to the parking area and offers exciting options: it could possibly accommodate a small home or trailer, generate additional income, or simply serve as extra outdoor living space. Restaurants, grocery store, and medical services are within walking distance, while the Missisquoi River runs through the village, offering kayaking and community activities. Local trails for walking, biking, snowmobiling are nearby, and Jay Peak Resort is just 30 minutes away. St. Albans is a 40-minute drive, and Burlington is just over an hour, making it easy to balance city amenities with small-town charm. Investment potential is strong: the home is currently tenant-occupied with a lease through Feb. 2026, generating $2,426 per month, including propane heat. Seller is open to selling 25 Sweat Street alone if the additional lot at 62 Highland Ave. is not desired. This is a rare chance to secure both immediate income and future possibilities in northern VT!
Key facts
- Quiet hilltop
- Two adjoining lots
- Blackberry bushes
Tags
Neighborhood map
What this means for you Summary
Snapshot
- This is a 3-bed/2.0-bath other listed at $149k.
Deal economics
- At list price, monthly cash flow is $318 ($4k/yr) — positive.
- The deal already cash-flows at list — no discount required.
- Meets the 1% rule at list price ($2k rent vs $149k).
- Recommended offer: $131k (12.0% below list) — sets the bar for market timing.
Location & tenants
- Location reads 68/100 on livability (#41 in VT) — a middle-class / working-renter tenant base. Strengths: crime A+, cost of living A+, housing A+; Watch: employment D, schools F, amenities F.
- Market conditions: 22 active listings in the ZIP; 200 units permitted in Franklin County in 2024 (25 in 5+ unit buildings).
Forward outlook
- In year one you build about $2k of equity ($1k loan paydown + $1k appreciation (1.0% local appreciation)).
- Franklin County population projected to shrink 3% by 2050 — rents likely to lag national; underwrite the cash flow, not the appreciation.
- At projected returns (1.0% appreciation + 3.0% rent growth), your $42k cash investment doubles in ~6 years — after that, you're playing with house money.
Negotiation context
- It's been on market 306 days — a 12% lower offer ($131k) is reasonable based on typical stale-listing flexibility.
- 3 sale attempts since 23y ago with the ask held roughly flat each time — persistent listings suggest the price (not the market) is what's stuck; bring a comps-based counter.
- Current owner paid $30k; list at $149k implies a 398% gain — meaningful room to come down on a strong offer.
Risks & watch-outs
- Watch-outs: built in 1895 — expect roof / HVAC / electrical / plumbing capex.
Questions for the listing agent
- It's been on market 306 days. Have you received any prior offers? Is the seller open to a 12% concession, seller financing, or rate buy-down credit?
- Built in 1895 — when were the roof, HVAC, electrical panel, plumbing, and water heater last replaced?
- Why hasn't it sold? Are there any deal-killer items the seller is aware of (foundation, flood, title, zoning, code violations)?
- Is there a deadline driving the sale (1031 exchange, divorce, estate, relocation)? That informs how much negotiation room exists.
- Schools are F-rated, which usually means shorter tenancies and higher turnover. Who's the typical renter profile here, and what's been the actual vacancy rate?
- What's the average days-on-market for RENTAL listings here right now (not sales)? A rising rental-DOM trend means longer vacancies and softer asking-rent achievability than the comps imply.
- What's the recent tenant-quality profile in this submarket — average credit score on applications, eviction rate, late-payment / NSF rate, and stable-employment percentage? A property-management company in the area should have these aggregated.
- How much new for-sale + rental construction is in the pipeline within 1–3 miles? Heavy new supply typically softens prices + rents 12–24 months out; constrained supply supports both.
Investment metrics
- 1% rule
- 1.08% ✓
- Cap rate
- 8.85%
- Cash-on-cash
- 9.14%
- DSCR
- 1.41
- GRM
- 7.7
CMA / ARV
- ARV (median comp)
- $190,966
- List price
- $149,300
- Delta
- -21.82%
- Verdict
- UNDERPRICED
- Comps
- 20 within 1.0 mi
Projected returns pro-forma
0.97% appreciation · 3.0% rent growth · sell at horizon
- IRR
- 10.8%
- Equity multiple
- 1.55×
- Total profit
- $22,842
- Equity at exit
- $50,752
- IRR
- 14.6%
- Equity multiple
- 2.76×
- Total profit
- $73,697
- Equity at exit
- $67,278
Cash invested: $41,804 (down + closing). Projections, not guarantees.
Landlord ↔ Tenant lean methodology
- Overall (STATE)
- 41 Moderately Tenant-Leaning
- State Vermont
- 41 Moderately Tenant-Leaning · D+15
- County
- — inherits STATE
- City
- — inherits STATE
ZIP-level market 05476
- Home prices YoY
- 0.3%
- Active inventory
- 22
- Price-to-rent
- 7.7×
Monthly cashflow live
- Estimated rent
- $1,614 medium interval (Pro) →
- Mortgage (P&I)
- −$783
- Tax from tax record
- −$112 /mo · $1,343/yr
- Insurance
- −$62
- HOA
- −$0
- Vacancy / Maint / Mgmt
- −$339
- Net cashflow
- $318
Break-even live
UW: 25.0% down · 7.5% · 30yr · 1.5% tax · 5.0% vac · 8.0% maint · 8.0% mgmt
Financing live
Cash to close
- Down payment
- $37,325
- Closing costs
- $4,479
- Reserves months
- —
- Total cash needed
- —
Loan-product check · same deal, 3 products live
Conventional
25% down · 7.5% · 30yr
- Down + closing
- —
- Monthly P&I
- —
- Monthly cashflow
- —
- DSCR
- —
- Eligible?
- —
Personal DTI + credit; lowest rate.
DSCR
20% down · 8.5% · 30yr
- Down + closing
- —
- Monthly P&I
- —
- Monthly cashflow
- —
- DSCR
- —
- Eligible?
- —
No personal income docs; deal must DSCR.
Hard money
10% down · 12.0% · 12mo
- Down + closing
- —
- Monthly P&I
- —
- Monthly cashflow
- —
- DSCR
- —
- Eligible?
- —
Short-term bridge; refi at stabilization.
Listing history 26 events
-
2026-06-18days on market $149,300 Active 306 DOM
-
2026-06-17days on market $149,300 Active 305 DOM
-
2026-06-16days on market $149,300 Active 304 DOM
-
2026-06-15days on market $149,300 Active 303 DOM
-
2026-06-15days on market $149,300 Active 302 DOM
-
2026-06-13days on market $149,300 Active 301 DOM
-
2026-06-12days on market $149,300 Active 300 DOM
-
2026-06-09days on market $149,300 Active 297 DOM
-
2026-06-08days on market $149,300 Active 296 DOM
-
2026-06-08days on market $149,300 Active 295 DOM
-
2026-06-07days on market $149,300 Active 294 DOM
-
2026-06-03days on market $149,300 Active 291 DOM
-
2026-06-02days on market $149,300 Active 290 DOM
-
2026-06-01days on market $149,300 Active 289 DOM
-
2026-05-31days on market $149,300 Active 288 DOM
-
2025-08-15$149,300 Active 1499-char remark
Show marketing remark (1499 chars)
Great investment opportunity in Richford, Vermont! Located on a quiet hilltop where Sweat Street and Highland Avenue meet, this offering includes two adjoining lots with versatility. At 25 Sweat Street sits an updated 3-bedroom, 2-bath home featuring a bright living room, dining area, walk-through kitchen, three bedrooms, two baths, and a flexible sitting room or office. Dedicated off-street parking adds convenience, while mature trees, a crabapple, and blackberry bushes enhance the natural setting. The adjoining lot at 62 Highland Ave. connects to the parking area and offers exciting options: it could possibly accommodate a small home or trailer, generate additional income, or simply serve as extra outdoor living space. Restaurants, grocery store, and medical services are within walking distance, while the Missisquoi River runs through the village, offering kayaking and community activities. Local trails for walking, biking, snowmobiling are nearby, and Jay Peak Resort is just 30 minutes away. St. Albans is a 40-minute drive, and Burlington is just over an hour, making it easy to balance city amenities with small-town charm. Investment potential is strong: the home is currently tenant-occupied with a lease through Feb. 2026, generating $2,426 per month, including propane heat. Seller is open to selling 25 Sweat Street alone if the additional lot at 62 Highland Ave. is not desired. This is a rare chance to secure both immediate income and future possibilities in northern VT!
-
2022-11-15price $120,000
-
2022-04-29price $135,000
-
2022-01-10soldstatus $30,000
-
2007-03-19soldstatus $76,000
-
2007-03-15soldstatus $76,000
-
2007-01-09$78,500
-
2004-10-07soldstatus $57,000
-
2004-02-20soldstatus $40,000
-
2004-02-18soldstatus $40,000
-
2003-07-18$55,000
ⓘ Source: listings_history table (triggers on properties + properties_extension) + one-shot
backfill from property_details.listing_events for pre-trigger history.
Tax reassessment forecast VT · Partial reset (capped growth)
- Current annual tax
- $1,343 · $112/mo
- Projected year-2 tax
- $2,090 · $174/mo
- Expected delta
- +$747/yr (+$62/mo · 55.6%)
ⓘ Screening estimate from a state-policy table — verify with the county assessor before closing.
Nearby sold comps map
Loading sold comps map…
Walkable amenities ~0.75 mi
Loading nearby amenities…
Taxation est. · year 1
- Rental income
- $19,373
- − Mortgage interest
- −$8,363
- − Property taxes
- −$1,343
- − Insurance
- −$746
- − Repairs & maintenance
- −$1,550
- − Management
- −$1,550
- − Depreciation
- −$4,343
- Taxable income
- $1,478
- Est. tax owed @ 24.0%
- −$355
- After-tax cash flow
- $3,465/yr
For passive investors: Depreciation is non-cash, so a rental often shows a tax loss while cash-flowing — sheltering income. Rental losses are passive: they offset passive income freely, and up to $25,000/yr can offset ordinary (W-2) income if you actively participate and your MAGI is under $100k (phasing out to $0 by $150k); unused losses carry forward. On sale, claimed depreciation is recaptured at up to 25%, and gains may owe capital-gains tax (a 1031 exchange can defer both). Figures are a year-1 estimate at your 24.0% rate — not tax advice; consult a CPA.
Schools (NCES district)
No district data.
Livability — Richford
- Score
- 68/100
- State rank
- #41
- US rank
- #10038
Category grades
Schools grade is shown separately in the Schools card above.
Census & demographics
- Census place
- Richford, VT
- Population (ZIP)
- 3,217
Population outlook (Franklin County) Hauer SSP2
- Today (2025)
- 50,374 people
- By 2030
- 50,718 · +0.7%
- By 2040
- 50,557 · +0.4%
- By 2050
- 48,832 · -3.1%
- By 2075
- 43,526 · -13.6%
- By 2100
- 33,970 · -32.6%
Race, ethnicity, and origin ACS 2023
- Neighborhood character
- Predominantly White (93%)
- Race & ethnicity
- White 93% Two or more races 4% Hispanic / Latino 2%
- Common ancestry
- Lithuanian 15% German 2% Slovak 2%
- Foreign-born
- 1% · Canada, Dominican Republic
- Languages at home
- 97% English-only · Spanish 2% French/Haitian/Cajun 1%
Political lean MEDSL · Franklin
- 2024 margin
- Toss-up / Even · D 50.0% · R 47.0% · Other 3.0%
- 2008→2024 swing
- -21.8pp toward R · 2008: 24.8pp · 2024: 3.0pp
- All cycles
- 2024: D+3.0 2020: D+9.0 2016: D+3.1 2012: D+23.6 2008: D+24.8
Not yet ingested
- Civics
- —
Market trends
- HPI YoY
- ▲ 0.97%
- Current HPI
- 332.3059
- Rent YoY
- —
- Metro
- —
- State GDP YoY
- —
- F500 in state
- 0
Price history
+171.5% since first listed11 events — show timeline
- 2025-08-15 Listed $149,300 PrimeMLS
- 2022-11-15 Price Changed $120,000 PrimeMLS
- 2022-04-29 Price Changed $135,000 PrimeMLS
- 2022-01-10 Sold (Public Records) $30,000 Public Records
- 2007-03-19 Sold (Public Records) $76,000 Public Records
- 2007-03-15 Sold (MLS) $76,000 PrimeMLS
- 2007-01-09 Listed $78,500 PrimeMLS
- 2004-10-07 Sold (Public Records) $57,000 Public Records
- 2004-02-20 Sold (Public Records) $40,000 Public Records
- 2004-02-18 Sold (MLS) $40,000 PrimeMLS
- 2003-07-18 Listed $55,000 PrimeMLS
Property tax history
-7.1%/yrLatest (2024): $1,343 · +25.6% YoY. Source: county tax records.
Cash-flow waterfall
monthlySold comps — $/sqft
last 12 mo · ≤1 miLoading sold comps…