305 E Madison St · Scottsburg, IN
Flood risk 1/10 · Minimal
- FEMA flood zone
- X (unshaded)
- Chance of flooding over 30 yrs
- 0.0%
- Est. flood insurance / yr
- $507 – $1,088
Fire risk 1/10 · Minimal
- Est. fire insurance / yr
- $717 – $1,331
Heat risk 5/10 · Moderate
- Hot days now (above 105°F)
- 7 days/yr
- Hot days in 30 yrs
- 19 days/yr
Wind risk 2/10 · Minimal
- Chance of severe wind over 30 yrs
- 1.0%
Air-quality risk 2/10 · Minimal
- Unhealthy air days now
- 0 days/yr
- Unhealthy air days in 30 yrs
- 1 days/yr
Risk factors via First Street. Map © Google.
Why this score? — see what drove the B- grade
The composite is a weighted blend of 9 inputs, each scored 0–100. Each bar is that input's sub-score; the figure is the points it added to the 100-point composite (weight × sub-score).
- Cash flow +30.0/30.0
- 1% rule +10.0/10.0
- DSCR +10.0/10.0
- ARV discount +7.5/15.0
- Livability +3.5/5.0
- Schools +3.2/10.0
- Rent growth +2.5/5.0
- Condition / age +2.5/5.0
- Appreciation +0.0/10.0
$46,000
🖨 Deal sheet (PDF) 📄 Offer letter ✓ Due diligence
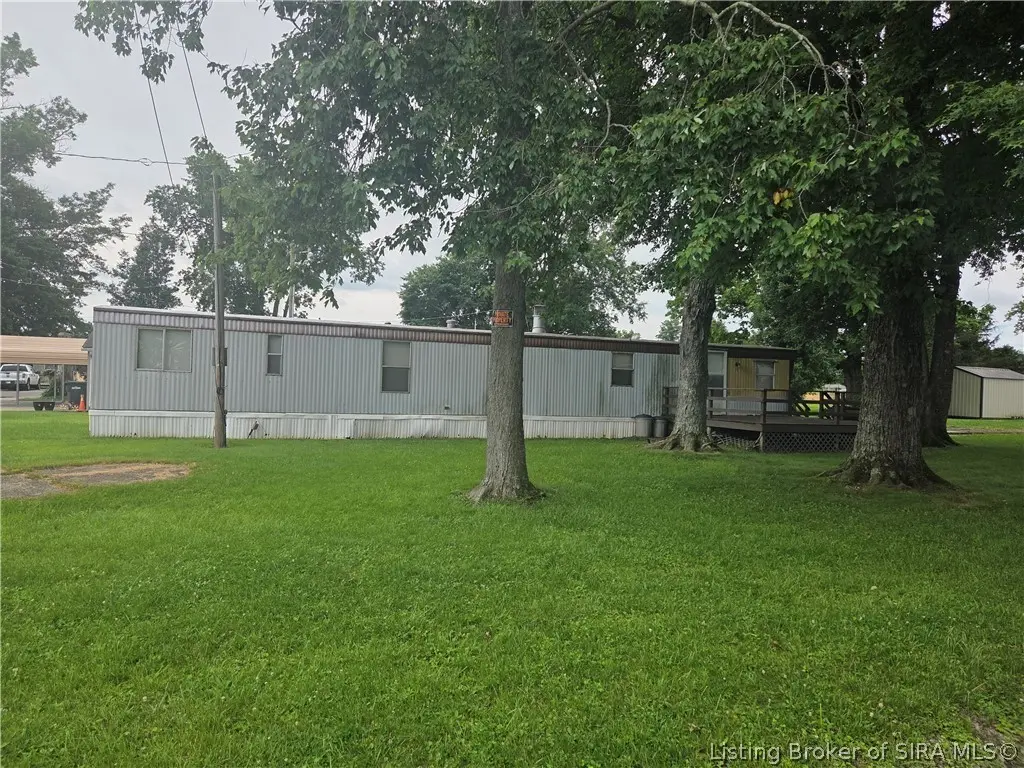
Listing remarks
Investors take notice! Corner lot close to school, park and downtown. Make this your home with some TLC or build a new home on the lot. Singlewide with 3 bedrooms, 1.5 baths, living room and eat-in kitchen.
Key facts
- Close to school
- Close to park
- Corner lot
Tags
Property features AI
Finance
- Other: Zoned residential
Exterior
- Parking: No garage
- Utilities: Public water connection; Public sewer
- Home design: Single-wide mobile home; Single story; Entry level: main level
- Construction: Metal siding; Crawlspace foundation; Built area above grade: 980
- Exterior features: Corner lot; Paved road access
Interior
- Kitchen: Eat-in kitchen
- Bedrooms: Primary bedroom on the main level
- Bathrooms: 1 full bathroom; 1 half bathroom
- Heating & cooling: Forced air heating; Heating present
- Interior features: Eat-in kitchen; Main-level primary bedroom; Utility room
- Laundry & utility: Laundry on the main level; Utility room
Neighborhood map
What this means for you Summary
Snapshot
- This is a 3-bed/1.5-bath manufactured listed at $46k.
Deal economics
- At list price, monthly cash flow is $480 ($6k/yr) — positive.
- The deal already cash-flows at list — no discount required.
- Meets the 1% rule at list price ($951 rent vs $46k).
- Cap rate 18.8% vs local median 4.1% in Scottsburg — top-decile yield for the area; either an underpriced asset or a hidden risk that comps aren't pricing in. Stress-test before assuming the spread holds.
Location & tenants
- Location reads 70/100 on livability (#152 in IN) — a middle-class / working-renter tenant base. Strengths: cost of living A+, health & safety A+, housing A; Watch: amenities F, commute F, employment D-.
- Scott County School District 2 (town): math 33% / reading 43% proficiency, ranked #166 of 301 in IN (top 55%) — families likely to look elsewhere, expect single-tenant / working-renter base with shorter leases.
- Zoned schools: Scottsburg Elem School (math 37% / reading 32%, grade F, #597 of 994 statewide, top 63%, 485 students, 73% FRL); Scottsburg Middle School (math 17% / reading 36%, grade F, #236 of 330 statewide, top 72%, 537 students, 60% FRL); Scottsburg Senior High School (math 32% / reading 62%, grade D-, #143 of 369 statewide, top 44%, 726 students, 56% FRL) — zoned schools average 63% FRL vs 45% district-wide (18 pts higher); higher-poverty schools than district average — tighter screening recommended.
- Market conditions: 106 active listings in the ZIP; 6 comparable units currently listed for rent nearby; rentals at typical pace (median 25d on market — plan ~3-4 weeks tenant-placement turnaround); 73 units permitted in Scott County in 2024 (0 in 5+ unit buildings).
Forward outlook
- Local home prices are declining (-3.0%/yr); year-one equity from $318 of loan paydown is wiped out by about $1k of value loss. Plan a longer hold.
- Scott County population projected at -23% by 2050 — secular population decline; favor cash flow + early exit over multi-decade hold.
- At projected returns (-3.0% appreciation + 3.0% rent growth), your $13k cash investment doubles in ~3 years — after that, you're playing with house money.
Negotiation context
- Only 4 days on market — expect competitive offers; lowballing is unlikely to land.
Risks & watch-outs
- Climate carrying-cost: extreme-heat days projected 7→19/yr by 2055 (HVAC capex compounding) — expect insurance premiums to compound above CPI over the hold.
Questions for the listing agent
- Is there a deadline driving the sale (1031 exchange, divorce, estate, relocation)? That informs how much negotiation room exists.
- What's the average days-on-market for RENTAL listings here right now (not sales)? A rising rental-DOM trend means longer vacancies and softer asking-rent achievability than the comps imply.
- What's the recent tenant-quality profile in this submarket — average credit score on applications, eviction rate, late-payment / NSF rate, and stable-employment percentage? A property-management company in the area should have these aggregated.
- How much new for-sale + rental construction is in the pipeline within 1–3 miles? Heavy new supply typically softens prices + rents 12–24 months out; constrained supply supports both.
Investment metrics
- 1% rule
- 2.07% ✓
- Cap rate
- 18.82%
- Cash-on-cash
- 44.73%
- DSCR
- 2.99
- GRM
- 4.0
CMA / ARV
No comps found within radius.
Projected returns pro-forma
-3.0% appreciation · 3.0% rent growth · sell at horizon
- IRR
- 41.8%
- Equity multiple
- 2.79×
- Total profit
- $23,111
- Equity at exit
- $6,859
- IRR
- 47.9%
- Equity multiple
- 5.62×
- Total profit
- $59,441
- Equity at exit
- $3,977
Cash invested: $12,880 (down + closing). Projections, not guarantees.
Landlord ↔ Tenant lean methodology
- Overall (STATE)
- 90 Strongly Landlord-Friendly
- State Indiana
- 90 Strongly Landlord-Friendly · R+11
- County
- — inherits STATE
- City
- — inherits STATE
ZIP-level market 47170
- Home prices YoY
- -22.3%
- Active inventory
- 106
- Price-to-rent
- 4.0×
Monthly cashflow live
- Estimated rent
- $951 high interval (Pro) →
- Mortgage (P&I)
- −$241
- Tax from tax record
- −$10 /mo · $125/yr
- Insurance
- −$19
- HOA
- −$0
- Vacancy / Maint / Mgmt
- −$200
- Net cashflow
- $480
Break-even live
Sensitivity live
| Price | -10% $506 | -5% $493 | +0% $480 | +5% $467 | +10% $454 |
|---|---|---|---|---|---|
| Rent | -10% $405 | -5% $443 | +0% $480 | +5% $518 | +10% $555 |
| Rate | -1.0pp $503 | -0.5pp $492 | base $480 | +0.5pp $468 | +1.0pp $456 |
UW: 25.0% down · 7.5% · 30yr · 1.5% tax · 5.0% vac · 8.0% maint · 8.0% mgmt
Financing live
Cash to close
- Down payment
- $11,500
- Closing costs
- $1,380
- Reserves months
- —
- Total cash needed
- —
Loan-product check · same deal, 3 products live
Conventional
25% down · 7.5% · 30yr
- Down + closing
- —
- Monthly P&I
- —
- Monthly cashflow
- —
- DSCR
- —
- Eligible?
- —
Personal DTI + credit; lowest rate.
DSCR
20% down · 8.5% · 30yr
- Down + closing
- —
- Monthly P&I
- —
- Monthly cashflow
- —
- DSCR
- —
- Eligible?
- —
No personal income docs; deal must DSCR.
Hard money
10% down · 12.0% · 12mo
- Down + closing
- —
- Monthly P&I
- —
- Monthly cashflow
- —
- DSCR
- —
- Eligible?
- —
Short-term bridge; refi at stabilization.
Rent comps 6 comps
| Address | Beds | Baths | Sqft | Rent | $/sqft | DOM | Units | Dist |
|---|---|---|---|---|---|---|---|---|
| 254 E Davis St Unit D Scottsburg, IN | 2.0 | 1.0 | 750 | $910 | $1.21 | 25d | 1 | 0.15mi |
| 254 E Davis St Unit D Scottsburg, IN | 2.0 | 1.0 | 750 | $825 | $1.10 | 13d | 1 | 0.15mi |
| 280 Harrison St Unit 1 Scottsburg, IN | 2.0 | 1.0 | 750 | $895 | $1.19 | 4d | 1 | 0.16mi |
| 737 Ray St Scottsburg, IN | 3.0 | 1.0 | 989 | $1,475 | $1.49 | 45d | 1 | 0.63mi |
| 854 W Lake Rd W Scottsburg, IN | 2.0 | 1.0 | 794 | $925 | $1.16 | 25d | 1 | 0.99mi |
| 33 S Johns Ct Scottsburg, IN | 3.0 | 2.0 | 1000 | $1,299 | $1.30 | 3d | 3 | 1.00mi |
Listing history 4 events
-
2026-06-21days on market $46,000 Active 4 DOM
-
2026-06-21days on market $46,000 Active 3 DOM
-
2026-06-18remarks 206-char remark
-
2026-06-18$46,000 Active 1 DOM
ⓘ Source: listings_history table (triggers on properties + properties_extension) + one-shot
backfill from property_details.listing_events for pre-trigger history.
Tax reassessment forecast IN · Partial reset (capped growth)
- Current annual tax
- $125 · $10/mo
- Projected year-2 tax
- $258 · $22/mo
- Expected delta
- +$133/yr (+$11/mo · 105.9%)
ⓘ Screening estimate from a state-policy table — verify with the county assessor before closing.
Climate risk First Street
- Flood 1/10 Low FEMA zone X (unshaded) · 0% chance over 30 yrs
- Wildfire 1/10 Low
- Heat 5/10 Major 7 d/yr ≥105°F today · 19 d/yr by 30 yrs out
- Wind 2/10 Low 100% chance of damaging wind over 30 yrs
- Air quality 2/10 Low 0 unhealthy d/yr today · 1 by 30 yrs out
Nearby sold comps map
Loading sold comps map…
Walkable amenities ~0.75 mi
Loading nearby amenities…
Taxation est. · year 1
- Rental income
- $11,407
- − Mortgage interest
- −$2,577
- − Property taxes
- −$125
- − Insurance
- −$230
- − Repairs & maintenance
- −$913
- − Management
- −$913
- − Depreciation
- −$1,338
- Taxable income
- $5,312
- Est. tax owed @ 24.0%
- −$1,275
- After-tax cash flow
- $4,487/yr
For passive investors: Depreciation is non-cash, so a rental often shows a tax loss while cash-flowing — sheltering income. Rental losses are passive: they offset passive income freely, and up to $25,000/yr can offset ordinary (W-2) income if you actively participate and your MAGI is under $100k (phasing out to $0 by $150k); unused losses carry forward. On sale, claimed depreciation is recaptured at up to 25%, and gains may owe capital-gains tax (a 1031 exchange can defer both). Figures are a year-1 estimate at your 24.0% rate — not tax advice; consult a CPA.
Schools (NCES district)
- District
- Scott County School District 2
- NCES district ID
- 1810020
- Math proficiency
- 33% ▼ -10.00%
- Reading proficiency
- 43% ▼ -6.00%
- Median HH income
- $45,529
- Composite
- 32.37/100
- National rank
- #5734
- State rank
- #166 of 301 in IN
Livability — Scottsburg
- Score
- 70/100
- State rank
- #152
- US rank
- #7609
Category grades
Schools grade is shown separately in the Schools card above.
Census & demographics
- Census place
- Scottsburg, IN
- Population (ZIP)
- 15,279
Population outlook (Scott County) Hauer SSP2
- Today (2025)
- 22,525 people
- By 2030
- 21,609 · -4.1%
- By 2040
- 19,536 · -13.3%
- By 2050
- 17,370 · -22.9%
- By 2075
- 12,862 · -42.9%
- By 2100
- 9,340 · -58.5%
Race, ethnicity, and origin ACS 2023
- Neighborhood character
- Predominantly White (92%)
- Race & ethnicity
- White 92% Two or more races 4% Hispanic / Latino 3%
- Common ancestry
- Slovak 2% Lithuanian 1% Italian 1%
- Foreign-born
- 1% · Canada
- Languages at home
- 97% English-only · Spanish 1% Other Indo-European 1%
Political lean MEDSL · Scott
- 2024 margin
- Solid R (+51.5) · D 23.4% · R 74.9% · Other 1.6%
- 2008→2024 swing
- -49.5pp toward R · 2008: -2.0pp · 2024: -51.5pp
- All cycles
- 2024: R+51.5 2020: R+45.6 2016: R+37.9 2012: R+6.2 2008: R+2.0
Not yet ingested
- Civics
- —
Market trends
- HPI YoY
- ▼ -64.30%
- Current HPI
- 223.9909
- Rent YoY
- —
- Metro
- —
- State GDP YoY
- ▲ 2.90%
- F500 in state
- 18
Industry mix (Fortune 500 HQ in IN)
| Industry | F500 HQs | Revenue |
|---|---|---|
| Industrial Machinery | 2 | $37B |
|
||
| Healthcare | 1 | $177B |
|
||
| Pharmaceuticals | 1 | $45B |
|
||
| Metals / Steel | 1 | $18B |
|
||
| Agriculture | 1 | $17B |
|
||
| Packaging | 1 | $12B |
|
||
Price history
1 event — show timeline
- 2026-06-16 Listed $46,000 SIRA
Property tax history
-1.5%/yrLatest (2024): $125 · +7.2% YoY. Source: county tax records.
Cash-flow waterfall
monthlySold comps — $/sqft
last 12 mo · ≤1 miLoading sold comps…