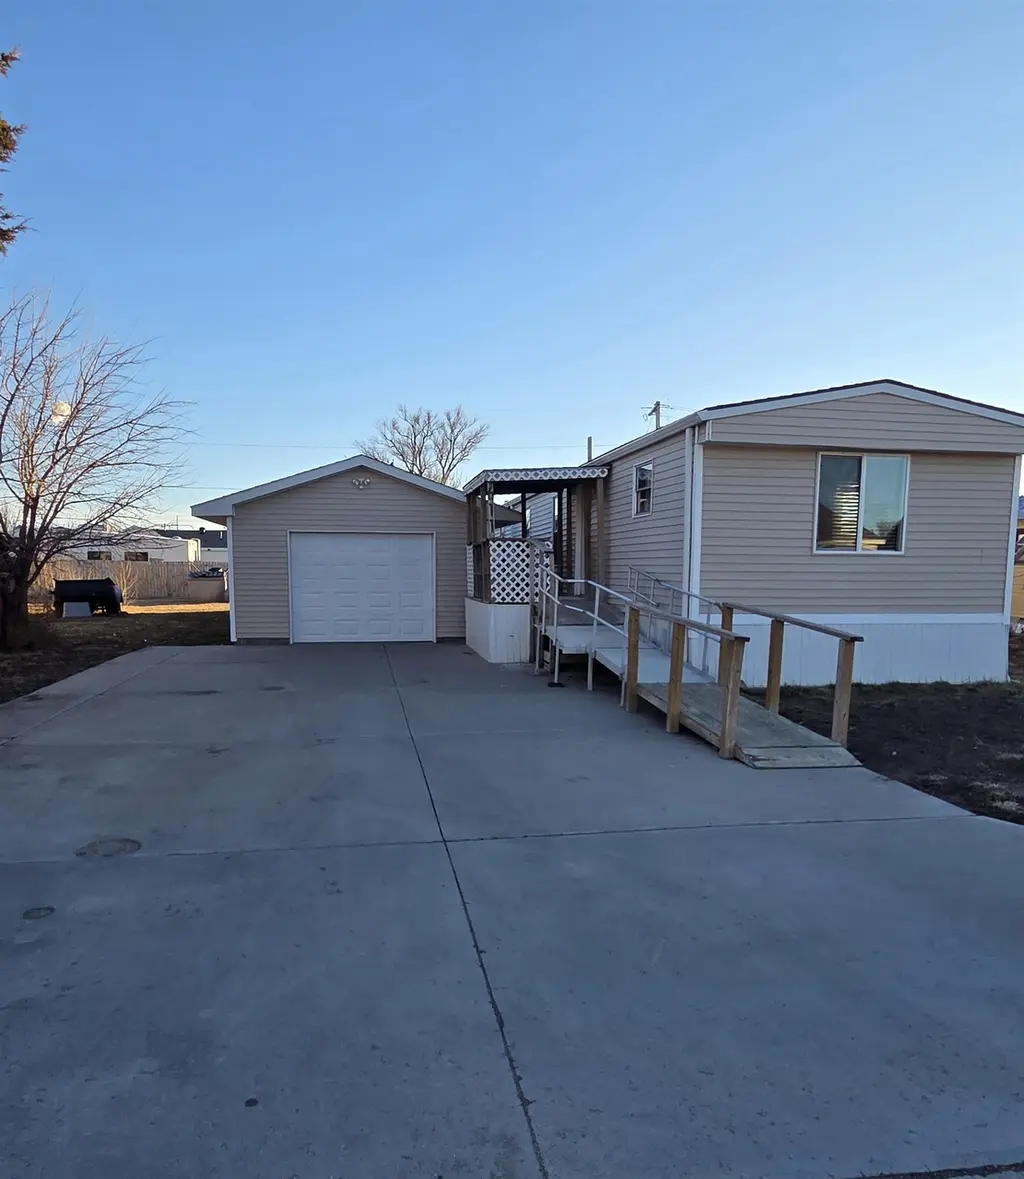
611 E 5th St · Cozad, NE
Flood risk 4/10 · Minor
- FEMA flood zone
- X (unshaded)
- Chance of flooding over 30 yrs
- 0.22%
- Est. flood insurance / yr
- $507 – $1,088
Fire risk 4/10 · Minor
- Est. fire insurance / yr
- $1,161 – $2,155
Heat risk 3/10 · Minor
- Hot days now (above 99°F)
- 7 days/yr
- Hot days in 30 yrs
- 18 days/yr
Wind risk 2/10 · Minimal
- Chance of severe wind over 30 yrs
- —
Air-quality risk 1/10 · Minimal
- Unhealthy air days now
- 0 days/yr
- Unhealthy air days in 30 yrs
- 0 days/yr
Risk factors via First Street. Map © Google.
Why this score? — see what drove the C- grade
The composite is a weighted blend of 9 inputs, each scored 0–100. Each bar is that input's sub-score; the figure is the points it added to the 100-point composite (weight × sub-score).
- Cash flow +22.7/30.0
- ARV discount +7.5/15.0
- DSCR +7.3/10.0
- 1% rule +4.6/10.0
- Livability +4.0/5.0
- Schools +3.6/10.0
- Rent growth +2.5/5.0
- Condition / age +2.5/5.0
- Appreciation +0.0/10.0
$84,900
🖨 Deal sheet (PDF) 📄 Offer letter ✓ Due diligence
Listing remarks MLS
$2,500.00 SELLER CREDIT AT CLOSING This home has been updated with some new windows and flooring, paint, new siding, roof, and tub. Garage is insulated with electric, has a drive through option with doors on each end, and garage door openers and remotes.
Key facts
- Insulated garage
- New siding
- New flooring
Tags
Neighborhood map
What this means for you Summary
Snapshot
- This is a 3-bed/2.0-bath manufactured listed at $85k.
Deal economics
- At list price, monthly cash flow is $146 ($2k/yr) — positive.
- The deal already cash-flows at list — no discount required.
- To meet the 1% rule (rent ≥ 1% of price), the offer needs to be $82k (4.0% below list).
- Recommended offer: $75k (12.0% below list) — sets the bar for market timing.
- Cap rate 8.4% vs local median 3.0% in Cozad — top-decile yield for the area; either an underpriced asset or a hidden risk that comps aren't pricing in. Stress-test before assuming the spread holds.
Location & tenants
- Location reads 80/100 on livability (#22 in NE, #1,638 nationally) — a professional / high-income tenant draw. Strengths: crime A+, cost of living A+, housing A+; Watch: amenities F, commute F.
- Cozad Community Schools (town): math 43% / reading 42% proficiency, ranked #90 of 111 in NE (top 81%) — families likely to look elsewhere, expect single-tenant / working-renter base with shorter leases.
- Zoned schools: Cozad Elementary School (math 42% / reading 42%, grade F, #319 of 502 statewide, top 68%, 428 students, 50% FRL); Cozad Middle School (math 47% / reading 42%, grade D, #65 of 128 statewide, top 53%, 197 students, 55% FRL); Cozad High School (math 37% / reading 42%, grade F, #184 of 261 statewide, top 76%, 260 students, 47% FRL).
- Market conditions: 37 active listings in the ZIP; 61 units permitted in Dawson County in 2024 (36 in 5+ unit buildings).
Forward outlook
- Local home prices are declining (-3.0%/yr); year-one equity from $587 of loan paydown is wiped out by about $3k of value loss. Plan a longer hold.
- Dawson County population projected to shrink 8% by 2050 — rents likely to lag national; underwrite the cash flow, not the appreciation.
Negotiation context
- It's been on market 148 days — a 12% lower offer ($75k) is reasonable based on typical stale-listing flexibility.
Questions for the listing agent
- It's been on market 148 days. Have you received any prior offers? Is the seller open to a 12% concession, seller financing, or rate buy-down credit?
- Why hasn't it sold? Are there any deal-killer items the seller is aware of (foundation, flood, title, zoning, code violations)?
- Is there a deadline driving the sale (1031 exchange, divorce, estate, relocation)? That informs how much negotiation room exists.
- What's the average days-on-market for RENTAL listings here right now (not sales)? A rising rental-DOM trend means longer vacancies and softer asking-rent achievability than the comps imply.
- What's the recent tenant-quality profile in this submarket — average credit score on applications, eviction rate, late-payment / NSF rate, and stable-employment percentage? A property-management company in the area should have these aggregated.
- How much new for-sale + rental construction is in the pipeline within 1–3 miles? Heavy new supply typically softens prices + rents 12–24 months out; constrained supply supports both.
Investment metrics
- 1% rule
- 0.96% ✗
- Cap rate
- 8.36%
- Cash-on-cash
- 7.37%
- DSCR
- 1.33
- GRM
- 8.7
CMA / ARV
No comps found within radius.
Projected returns pro-forma
-3.0% appreciation · 3.0% rent growth · sell at horizon
- IRR
- -5.1%
- Equity multiple
- 0.81×
- Total profit
- $-4,495
- Equity at exit
- $12,659
- IRR
- 4.5%
- Equity multiple
- 1.33×
- Total profit
- $7,896
- Equity at exit
- $7,341
Cash invested: $23,772 (down + closing). Projections, not guarantees.
Landlord ↔ Tenant lean methodology
- Overall (STATE)
- 83 Strongly Landlord-Friendly
- State Nebraska
- 83 Strongly Landlord-Friendly · R+13
- County
- — inherits STATE
- City
- — inherits STATE
ZIP-level market 69130
- Home prices YoY
- -7.4%
- Active inventory
- 37
- Price-to-rent
- 8.7×
Monthly cashflow live
- Estimated rent
- $815 medium interval (Pro) →
- Mortgage (P&I)
- −$445
- Tax from tax record
- −$17 /mo · $206/yr
- Insurance
- −$35
- HOA
- −$0
- Lot rent leased land?
- −$0
- Vacancy / Maint / Mgmt
- −$171
- Net cashflow
- $146
Break-even live
Sensitivity live
| Price | -10% $194 | -5% $170 | +0% $146 | +5% $122 | +10% $98 |
|---|---|---|---|---|---|
| Rent | -10% $82 | -5% $114 | +0% $146 | +5% $178 | +10% $210 |
| Rate | -1.0pp $189 | -0.5pp $168 | base $146 | +0.5pp $124 | +1.0pp $102 |
UW: 25.0% down · 7.5% · 30yr · 1.5% tax · 5.0% vac · 8.0% maint · 8.0% mgmt
Financing live
Cash to close
- Down payment
- $21,225
- Closing costs
- $2,547
- Reserves months
- —
- Total cash needed
- —
Loan-product check · same deal, 3 products live
Conventional
25% down · 7.5% · 30yr
- Down + closing
- —
- Monthly P&I
- —
- Monthly cashflow
- —
- DSCR
- —
- Eligible?
- —
Personal DTI + credit; lowest rate.
DSCR
20% down · 8.5% · 30yr
- Down + closing
- —
- Monthly P&I
- —
- Monthly cashflow
- —
- DSCR
- —
- Eligible?
- —
No personal income docs; deal must DSCR.
Hard money
10% down · 12.0% · 12mo
- Down + closing
- —
- Monthly P&I
- —
- Monthly cashflow
- —
- DSCR
- —
- Eligible?
- —
Short-term bridge; refi at stabilization.
Listing history 7 events
-
2026-06-04days on market $84,900 Active 148 DOM
-
2026-06-02days on market $84,900 Active 147 DOM
-
2026-06-01days on market $84,900 Active 146 DOM
-
2026-05-31days on market $84,900 Active 145 DOM
-
2026-05-31days on market $84,900 Active 144 DOM
-
2026-04-04price $84,900 257-char remark
Show marketing remark (257 chars)
$2,500.00 SELLER CREDIT AT CLOSING This home has been updated with some new windows and flooring, paint, new siding, roof, and tub. Garage is insulated with electric, has a drive through option with doors on each end, and garage door openers and remotes.
-
2026-01-06$89,000 Active 257-char remark
Show marketing remark (257 chars)
$2,500.00 SELLER CREDIT AT CLOSING This home has been updated with some new windows and flooring, paint, new siding, roof, and tub. Garage is insulated with electric, has a drive through option with doors on each end, and garage door openers and remotes.
ⓘ Source: listings_history table (triggers on properties + properties_extension) + one-shot
backfill from property_details.listing_events for pre-trigger history.
Tax reassessment forecast NE · Resets to sale price
- Current annual tax
- $206 · $17/mo
- Projected year-2 tax
- $1,469 · $122/mo
- Expected delta
- +$1,262/yr (+$105/mo · 611.9%)
ⓘ Screening estimate from a state-policy table — verify with the county assessor before closing.
Climate risk First Street
- Flood 4/10 Moderate FEMA zone X (unshaded) · 22% chance over 30 yrs
- Wildfire 4/10 Moderate
- Heat 3/10 Moderate 7 d/yr ≥99°F today · 18 d/yr by 30 yrs out
- Wind 2/10 Low
- Air quality 1/10 Low 0 unhealthy d/yr today · 0 by 30 yrs out
Nearby sold comps map
Loading sold comps map…
Walkable amenities ~0.75 mi
Loading nearby amenities…
Taxation est. · year 1
- Rental income
- $9,781
- − Mortgage interest
- −$4,756
- − Property taxes
- −$206
- − Insurance
- −$424
- − Repairs & maintenance
- −$782
- − Management
- −$782
- − Depreciation
- −$2,470
- Taxable income
- $359
- Est. tax owed @ 24.0%
- −$86
- After-tax cash flow
- $1,667/yr
For passive investors: Depreciation is non-cash, so a rental often shows a tax loss while cash-flowing — sheltering income. Rental losses are passive: they offset passive income freely, and up to $25,000/yr can offset ordinary (W-2) income if you actively participate and your MAGI is under $100k (phasing out to $0 by $150k); unused losses carry forward. On sale, claimed depreciation is recaptured at up to 25%, and gains may owe capital-gains tax (a 1031 exchange can defer both). Figures are a year-1 estimate at your 24.0% rate — not tax advice; consult a CPA.
Schools (NCES district)
- District
- Cozad Community Schools
- NCES district ID
- 3105460
- Math proficiency
- 43% ▬ 0.00%
- Reading proficiency
- 42% ▬ 0.00%
- Median HH income
- $44,563
- Composite
- 36.06/100
- National rank
- #4770
- State rank
- #90 of 111 in NE
Livability — Cozad
- Score
- 80/100
- State rank
- #22
- US rank
- #1638
Category grades
Schools grade is shown separately in the Schools card above.
Census & demographics
- Census place
- Cozad, NE
- Population (ZIP)
- 5,056
Population outlook (Dawson County) Hauer SSP2
- Today (2025)
- 23,318 people
- By 2030
- 22,912 · -1.7%
- By 2040
- 22,097 · -5.2%
- By 2050
- 21,358 · -8.4%
- By 2075
- 19,801 · -15.1%
- By 2100
- 17,647 · -24.3%
Race, ethnicity, and origin ACS 2023
- Neighborhood character
- Predominantly White (86%)
- Race & ethnicity
- White 86% Hispanic / Latino 10% Two or more races 2% Black 2%
- Hispanic origin (detail)
- Mexican 4%
- Common ancestry
- Portuguese 1% Slovak 1% Romanian 1%
- Foreign-born
- 6% · Canada, Vietnam
- Languages at home
- 95% English-only · Spanish 4% Vietnamese 0%
Political lean MEDSL · Dawson
- 2024 margin
- Solid R (+49.6) · D 24.7% · R 74.3%
- 2008→2024 swing
- -11.3pp toward R · 2008: -38.3pp · 2024: -49.6pp
- All cycles
- 2024: R+49.6 2020: R+43.8 2016: R+45.0 2012: R+41.8 2008: R+38.3
Not yet ingested
- Civics
- —
Market trends
- HPI YoY
- ▼ -18.47%
- Current HPI
- 231.4673
- Rent YoY
- —
- Metro
- —
- State GDP YoY
- ▲ 0.68%
- F500 in state
- 2
Industry mix (Fortune 500 HQ in NE)
| Industry | F500 HQs | Revenue |
|---|---|---|
| Conglomerate | 1 | $371B |
|
||
Price history
-4.6% since first listed2 events — show timeline
- 2026-04-04 Price Changed $84,900 GMNMLS
- 2026-01-06 Listed $89,000 GMNMLS
Property tax history
+0.4%/yrLatest (2025): $206 · -3.4% YoY. Source: county tax records.
Cash-flow waterfall
monthlySold comps — $/sqft
last 12 mo · ≤1 miLoading sold comps…