201 E Arrow Hwy #70 · Glendora, CA
Flood risk 3/10 · Minor
- FEMA flood zone
- X (unshaded)
- Chance of flooding over 30 yrs
- 0.2%
- Est. flood insurance / yr
- $507 – $1,088
Fire risk 6/10 · Moderate
- Est. fire insurance / yr
- $659 – $1,223
Heat risk 7/10 · Major
- Hot days now (above 98°F)
- 7 days/yr
- Hot days in 30 yrs
- 20 days/yr
Wind risk 1/10 · Minimal
- Chance of severe wind over 30 yrs
- —
Air-quality risk 7/10 · Major
- Unhealthy air days now
- 15 days/yr
- Unhealthy air days in 30 yrs
- 17 days/yr
Risk factors via First Street. Map © Google.
Why this score? — see what drove the C+ grade
The composite is a weighted blend of 9 inputs, each scored 0–100. Each bar is that input's sub-score; the figure is the points it added to the 100-point composite (weight × sub-score).
- Cash flow +30.0/30.0
- 1% rule +10.0/10.0
- DSCR +10.0/10.0
- Schools +4.7/10.0
- Condition / age +3.8/5.0
- Livability +3.2/5.0
- Rent growth +3.1/5.0
- ARV discount +0.0/15.0
- Appreciation +0.0/10.0
$109,000
🖨 Deal sheet 📄 Offer letter ✓ Due diligence
Listing remarks MLS
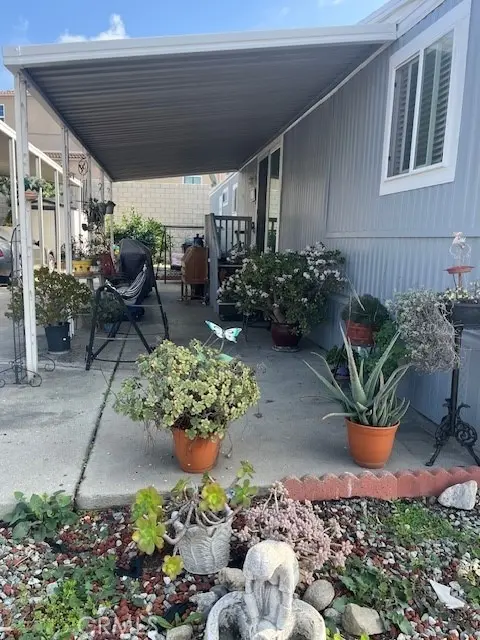
Welcome to Arrowhead Mobile Home Park! This beautiful single level home offers 2 bedrooms, 1 bath, with 672 sqf. Features include: laundry area with washer and dryer, new windows, new AC window units, new exterior paint and spacious patio with potted plants. Community amenities include a clubhouse, fitness center, recreation room, children's playroom, pool and spa. Pet friendly with ample guest parking. This home is move-in ready.
Key facts
- Clubhouse
- Laundry area
- New exterior paint
Tags
Neighborhood map
What this means for you Summary
Snapshot
- This is a 2-bed/1.0-bath manufactured listed at $109k. Condition is rated good.
Deal economics
- At list price, monthly cash flow is $1k ($14k/yr) — positive.
- The deal already cash-flows at list — no discount required.
- Meets the 1% rule at list price ($2k rent vs $109k).
- Recommended offer: $96k (12.0% below list) — sets the bar for market timing.
- Cap rate 19.1% vs local median 2.4% in Glendora — top-decile yield for the area; either an underpriced asset or a hidden risk that comps aren't pricing in. Stress-test before assuming the spread holds.
Location & tenants
- Location reads 65/100 on livability (#373 in CA) — a middle-class / working-renter tenant base. Strengths: commute A+, employment A+, schools B; Watch: amenities F, cost of living F, health & safety F.
- Charter Oak Unified (suburban): math 45% / reading 55% proficiency, ranked #387 of 1,400 in CA (top 28%) — acceptable for families but not a draw, mixed tenant base, ~2y average lease.
- Market conditions: Rents rising (+2.6%/yr); 52 active listings in the ZIP; 8 comparable units currently listed for rent nearby; rentals at typical pace (median 22d on market — plan ~3-4 weeks tenant-placement turnaround); solid renter incomes; 19,697 units permitted in Los Angeles County in 2024 (9,426 in 5+ unit buildings).
Forward outlook
- Local home prices are declining (-3.0%/yr); year-one equity from $754 of loan paydown is wiped out by about $3k of value loss. Plan a longer hold.
- Los Angeles County population projected at +9% by 2050 — modest demand growth; plan on rents tracking national, not racing it.
- At projected returns (-3.0% appreciation + 2.6% rent growth), your $31k cash investment doubles in ~3 years — after that, you're playing with house money.
Negotiation context
- It's been on market 139 days — a 12% lower offer ($96k) is reasonable based on typical stale-listing flexibility.
Risks & watch-outs
- Climate carrying-cost: major wildfire risk; extreme-heat days projected 7→20/yr by 2055 (HVAC capex compounding) — expect insurance premiums to compound above CPI over the hold.
Questions for the listing agent
- It's been on market 139 days. Have you received any prior offers? Is the seller open to a 12% concession, seller financing, or rate buy-down credit?
- Built in 1972 — when were the roof, HVAC, electrical panel, plumbing, and water heater last replaced?
- Why hasn't it sold? Are there any deal-killer items the seller is aware of (foundation, flood, title, zoning, code violations)?
- Is there a deadline driving the sale (1031 exchange, divorce, estate, relocation)? That informs how much negotiation room exists.
- Schools are B-rated — typically a magnet for longer-tenancy family renters. What's the average tenant stay here, and is there a school-zone premium baked into asking?
- What's the average days-on-market for RENTAL listings here right now (not sales)? A rising rental-DOM trend means longer vacancies and softer asking-rent achievability than the comps imply.
- What's the recent tenant-quality profile in this submarket — average credit score on applications, eviction rate, late-payment / NSF rate, and stable-employment percentage? A property-management company in the area should have these aggregated.
- How much new for-sale + rental construction is in the pipeline within 1–3 miles? Heavy new supply typically softens prices + rents 12–24 months out; constrained supply supports both.
Investment metrics
- 1% rule
- 2.23% ✓
- Cap rate
- 19.11%
- Cash-on-cash
- 45.78%
- DSCR
- 3.04
- GRM
- 3.7
CMA / ARV
- ARV (median comp)
- $90,419
- List price
- $109,000
- Delta
- 20.55%
- Verdict
- OVERPRICED
- Comps
- 5 within 1.0 mi
Show comp detail 1 sale within ~0.75 mi
| Address | Dist | Beds/Ba | Sqft | Sold | Price | $/sf | Match |
|---|---|---|---|---|---|---|---|
| 1700 S Glendora Ave Unit SP19 | 0.14mi | 2/1.0 | 672 (0%) | 9mo | $75,000 | $112 | 86 |
Match score weights: distance 35% · size 25% · config 20% · recency 20%. Top-matched comps best support the ARV.
Projected returns pro-forma
-3.0% appreciation · 2.59% rent growth · sell at horizon
- IRR
- 42.5%
- Equity multiple
- 2.82×
- Total profit
- $55,541
- Equity at exit
- $16,252
- IRR
- 48.4%
- Equity multiple
- 5.59×
- Total profit
- $139,953
- Equity at exit
- $9,424
Cash invested: $30,520 (down + closing). Projections, not guarantees.
Landlord ↔ Tenant lean methodology
- Overall (STATE)
- 18 Strongly Tenant-Friendly
- State California
- 18 Strongly Tenant-Friendly · D+13
- County
- — inherits STATE
- City
- — inherits STATE
ZIP-level market 91740
- Rents YoY
- 2.6%
- Active inventory
- 52
- Price-to-rent
- 3.7×
Monthly cashflow live
- Estimated rent
- $2,428 high interval (Pro) →
- Mortgage (P&I)
- −$572
- Tax est. 1.5%
- −$136 /mo · $1,635/yr
- Insurance
- −$45
- HOA
- −$0
- Vacancy / Maint / Mgmt
- −$510
- Net cashflow
- $1,164
Break-even live
UW: 25.0% down · 7.5% · 30yr · 1.5% tax · 5.0% vac · 8.0% maint · 8.0% mgmt
Financing live
Cash to close
- Down payment
- $27,250
- Closing costs
- $3,270
- Reserves months
- —
- Total cash needed
- —
Loan-product check · same deal, 3 products live
Conventional
25% down · 7.5% · 30yr
- Down + closing
- —
- Monthly P&I
- —
- Monthly cashflow
- —
- DSCR
- —
- Eligible?
- —
Personal DTI + credit; lowest rate.
DSCR
20% down · 8.5% · 30yr
- Down + closing
- —
- Monthly P&I
- —
- Monthly cashflow
- —
- DSCR
- —
- Eligible?
- —
No personal income docs; deal must DSCR.
Hard money
10% down · 12.0% · 12mo
- Down + closing
- —
- Monthly P&I
- —
- Monthly cashflow
- —
- DSCR
- —
- Eligible?
- —
Short-term bridge; refi at stabilization.
Rent comps 8 comps
| Address | Beds | Baths | Sqft | Rent | $/sqft | DOM | Units | Dist |
|---|---|---|---|---|---|---|---|---|
| 711 Claraday St Unit A Glendora, CA | 2.0 | 1.0 | 750 | $2,250 | $3.00 | 43d | 1 | 0.61mi |
| 1400 N Grand Ave Covina, CA | 1.0–2.0 | 1.0–2.0 | 846 | $2,720 | $3.22 | 1d | 5 | 0.66mi |
| 440 W Gladstone St Glendora, CA | 1.0–2.0 | 1.0–2.0 | 875 | $2,390 | $2.73 | 1d | 9 | 0.73mi |
| 21042 E Arrow Hwy Covina, CA | 1.0–2.0 | 1.0–2.0 | 803 | $2,875 | $3.58 | 1d | 11 | 0.95mi |
| 1000 S Glendora Ave Glendora, CA | 1.0 | 1.0 | 551 | $1,820 | $3.30 | 1d | 1 | 1.05mi |
| 220 N Valley Center Ave San Dimas, CA | 1.0 | 1.0 | 450 | $1,695 | $3.77 | 22d | 1 | 1.36mi |
| 826 N Barranca Ave Covina, CA | 1.0–2.0 | 1.0–2.0 | 762 | $2,295 | $3.01 | 43d | 2 | 1.41mi |
| 642 Lemar Park Dr Unit 4 Glendora, CA | 1.0 | 1.0 | 680 | $2,000 | $2.94 | 43d | 1 | 1.43mi |
Listing history 16 events
-
2026-06-18days on market $109,000 Active 139 DOM
-
2026-06-17days on market $109,000 Active 138 DOM
-
2026-06-16days on market $109,000 Active 137 DOM
-
2026-06-15days on market $109,000 Active 136 DOM
-
2026-06-13days on market $109,000 Active 134 DOM
-
2026-06-13days on market $109,000 Active 133 DOM
-
2026-06-09days on market $109,000 Active 130 DOM
-
2026-06-08days on market $109,000 Active 129 DOM
-
2026-06-08price $109,000 Active 128 DOM
-
2026-06-07days on market $120,000 Active 128 DOM
-
2026-06-04days on market $120,000 Active 125 DOM
-
2026-06-03days on market $120,000 Active 124 DOM
-
2026-06-02days on market $120,000 Active 123 DOM
-
2026-06-01days on market $120,000 Active 122 DOM
-
2026-05-31days on market $120,000 Active 121 DOM
-
2026-01-30$120,000 Active 435-char remark
Show marketing remark (435 chars)
Welcome to Arrowhead Mobile Home Park! This beautiful single level home offers 2 bedrooms, 1 bath, with 672 sqf. Features include: laundry area with washer and dryer, new windows, new AC window units, new exterior paint and spacious patio with potted plants. Community amenities include a clubhouse, fitness center, recreation room, children's playroom, pool and spa. Pet friendly with ample guest parking. This home is move-in ready.
ⓘ Source: listings_history table (triggers on properties + properties_extension) + one-shot
backfill from property_details.listing_events for pre-trigger history.
Climate risk First Street
- Flood 3/10 Moderate FEMA zone X (unshaded) · 20% chance over 30 yrs
- Wildfire 6/10 Major
- Heat 7/10 Severe 7 d/yr ≥98°F today · 20 d/yr by 30 yrs out
- Wind 1/10 Low
- Air quality 7/10 Severe 15 unhealthy d/yr today · 17 by 30 yrs out
Nearby sold comps map
Loading sold comps map…
Walkable amenities ~0.75 mi
Loading nearby amenities…
Taxation est. · year 1
- Rental income
- $29,130
- − Mortgage interest
- −$6,106
- − Property taxes
- −$1,635
- − Insurance
- −$545
- − Repairs & maintenance
- −$2,330
- − Management
- −$2,330
- − Depreciation
- −$3,171
- Taxable income
- $13,013
- Est. tax owed @ 24.0%
- −$3,123
- After-tax cash flow
- $10,850/yr
For passive investors: Depreciation is non-cash, so a rental often shows a tax loss while cash-flowing — sheltering income. Rental losses are passive: they offset passive income freely, and up to $25,000/yr can offset ordinary (W-2) income if you actively participate and your MAGI is under $100k (phasing out to $0 by $150k); unused losses carry forward. On sale, claimed depreciation is recaptured at up to 25%, and gains may owe capital-gains tax (a 1031 exchange can defer both). Figures are a year-1 estimate at your 24.0% rate — not tax advice; consult a CPA.
Condition & rehab AI · 11 photos
This single-level manufactured home is move-in ready with a good condition score and minimal repairs needed. Upgrades to the exterior, kitchen, HVAC, and landscaping can significantly increase its value.
Value-add opportunities
- Both Painting the exterior and interior walls — Fresh paint can enhance the curb appeal and interior aesthetics.
- Both Updating the kitchen cabinets and countertops — Modernizing the kitchen can increase both resale and rental value.
- Both Upgrading the HVAC system — A new HVAC system can improve comfort and energy efficiency, attracting more buyers and renters.
- Both Landscaping improvements — Enhancing the landscaping can increase curb appeal and attract more potential buyers and renters.
Renovation cost estimate screening
Value-add ROI direction
- Both Painting the exterior and interior walls — Fresh paint can enhance the curb appeal and interior aesthetics. ↑
- Both Updating the kitchen cabinets and countertops — Modernizing the kitchen can increase both resale and rental value. ↑
- Both Upgrading the HVAC system — A new HVAC system can improve comfort and energy efficiency, attracting more buyers and renters. ↑
- Both Landscaping improvements — Enhancing the landscaping can increase curb appeal and attract more potential buyers and renters. ↑
ⓘ Cost ranges are severity-bucket heuristics (US national rule-of-thumb). Get contractor quotes + a written scope before underwriting a rehab budget.
Schools (NCES district)
- District
- Charter Oak Unified
- NCES district ID
- 0608190
- Math proficiency
- 45% ▲ 2.00%
- Reading proficiency
- 55% ▲ 4.00%
- Median HH income
- $72,756
- Composite
- 46.95/100
- National rank
- #5160
- State rank
- #387 of 1400 in CA
Livability — Glendora
- Score
- 65/100
- State rank
- #373
- US rank
- #12710
Category grades
Schools grade is shown separately in the Schools card above.
Census & demographics
- Census place
- Glendora, CA
- County
- Los Angeles County · 9,444,647 people
- City population
- 52,239
- Metro
- Los Angeles-Long Beach-Anaheim, CA
- Population (ZIP)
- 26,168
- Household income
- $99,083
- Rent vs Own
- Severe rent burden
- 1034.0
Population outlook (Los Angeles County) Hauer SSP2
- Today (2025)
- 10,940,515 people
- By 2030
- 11,256,481 · +2.9%
- By 2040
- 11,729,929 · +7.2%
- By 2050
- 11,948,407 · +9.2%
- By 2075
- 11,818,114 · +8.0%
- By 2100
- 10,842,928 · -0.9%
Race, ethnicity, and origin ACS 2023
- Neighborhood character
- Diverse neighborhood (Simpson 0.64)
- Race & ethnicity
- Hispanic / Latino 49% White 33% Two or more races 21% Asian 10% Black 3% Native American 1%
- Hispanic origin (detail)
- Mexican 37% Cuban 1%
- Common ancestry
- Lithuanian 1% Portuguese 1% Romanian 1%
- Foreign-born
- 22% · Canada, China, Vietnam
- Languages at home
- 63% English-only · Spanish 24% Chinese 4% Arabic 3%
Political lean MEDSL · Los Angeles
- 2024 margin
- Solid D (+32.9) · D 64.8% · R 31.9% · Other 3.3%
- 2008→2024 swing
- -7.4pp toward R · 2008: 40.4pp · 2024: 32.9pp
- All cycles
- 2024: D+32.9 2020: D+44.2 2016: D+48.0 2012: D+40.0 2008: D+40.4
Not yet ingested
- Civics
- —
Market trends
- HPI YoY
- ▼ -847.76%
- Current HPI
- 378.3547
- Rent YoY
- ▲ 2.59%
- Metro
- Los Angeles-Long Beach-Anaheim, CA
- State GDP YoY
- ▲ 3.21%
- F500 in state
- 116
Industry mix (Fortune 500 HQ in CA)
| Industry | F500 HQs | Revenue |
|---|---|---|
| Technology | 27 | $1,492B |
|
||
| Financial Services | 3 | $174B |
|
||
| Retail | 3 | $44B |
|
||
| Insurance | 3 | $26B |
|
||
| Media / Entertainment | 2 | $115B |
|
||
| Pharmaceuticals / Biotech | 2 | $62B |
|
||
Price history
1 event — show timeline
- 2026-01-30 Listed $120,000 CRMLS
Property tax history
+7.1%/yrLatest (2025): $208 · +7.1% YoY. Source: county tax records.
Cash-flow waterfall
monthlySold comps — $/sqft
last 12 mo · ≤1 miLoading sold comps…