1701 Clackamette Dr #2 · Oregon City, OR
Flood risk No data
- FEMA flood zone
- —
- Chance of flooding over 30 yrs
- —
- Est. flood insurance / yr
- —
Fire risk No data
- Est. fire insurance / yr
- —
Heat risk No data
- Hot days now (above threshold)
- —
- Hot days in 30 yrs
- —
Wind risk No data
- Chance of severe wind over 30 yrs
- —
Air-quality risk No data
- Unhealthy air days now
- —
- Unhealthy air days in 30 yrs
- —
Risk factors via First Street. Map © Google.
Why this score? — see what drove the C- grade
The composite is a weighted blend of 9 inputs, each scored 0–100. Each bar is that input's sub-score; the figure is the points it added to the 100-point composite (weight × sub-score).
- Cash flow +16.2/30.0
- ARV discount +15.0/15.0
- DSCR +5.0/10.0
- 1% rule +4.4/10.0
- Livability +4.4/5.0
- Condition / age +4.0/5.0
- Rent growth +2.8/5.0
- Schools +2.7/10.0
- Appreciation +0.0/10.0
$299,000
🖨 Deal sheet (PDF) 📄 Offer letter ✓ Due diligence
Listing remarks MLS
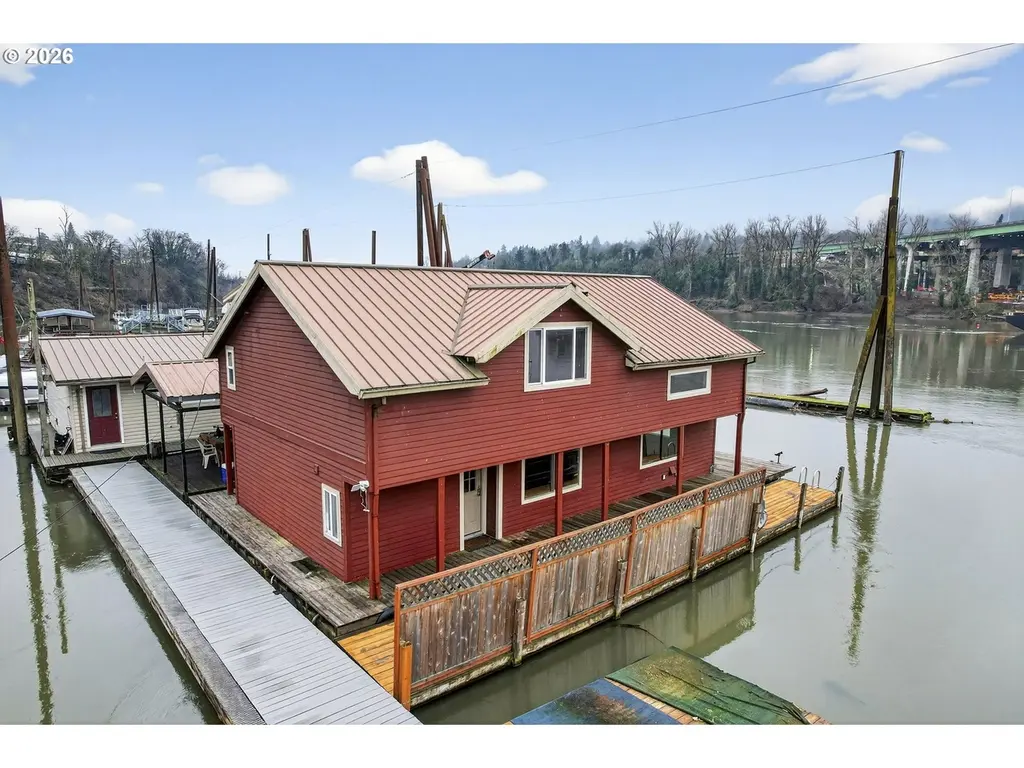
Solid 3 bedroom, 2 bathroom, 1788sf, 2 level floating home with float rated 3+ October 2025 can qualify for loan. New carpet and paint throughout interior January 2026. Pellet Stove in living room keeps home cozy in winter and Portable AC plus wall unit upstairs keeps you cool in the summer! GREAT value waiting for someone to enjoy. This house must be moved, there is slip at Jantzen Beach Moorage @ 239k, McGuire Point @ 300k & Columbia Ridge @ 325 + Harbor One with a $10K move in fee. With accepted deal seller will deliver to any moorage in the Portland Metro - 29' x 52' float find slip & begin living on the River!
Key facts
- Built 1968
- Listed 153 days
Neighborhood map
What this means for you Summary
Snapshot
- This is a 3-bed/2.0-bath single-family listed at $299k. Condition is rated good.
Deal economics
- At list price, monthly cash flow is $159 ($2k/yr) — positive.
- The deal already cash-flows at list — no discount required.
- To meet the 1% rule (rent ≥ 1% of price), the offer needs to be $282k (5.8% below list).
- Recommended offer: $263k (12.0% below list) — sets the bar for market timing.
- Cap rate 6.9% vs local median 2.7% in Oregon City — top-decile yield for the area; either an underpriced asset or a hidden risk that comps aren't pricing in. Stress-test before assuming the spread holds.
Location & tenants
- Location reads 87/100 on livability (#12 in OR, #271 nationally) — a professional / high-income tenant draw. Strengths: amenities A+, commute A+, employment A+; Watch: cost of living F.
- Oregon City SD 62 (suburban): math 18% / reading 40% proficiency, ranked #40 of 58 in OR (top 69%) — low school quality limits family demand, transient renter base, plan for 1-2y turnover.
- Zoned schools: Candy Lane Elementary School (math 24% / reading 24%, grade F, #320 of 412 statewide, top 82%, 388 students, 41% FRL); Gardiner Middle School (math 20% / reading 39%, grade F, #86 of 128 statewide, top 72%, 671 students, 30% FRL); Oregon City Senior High School (math 17% / reading 52%, grade F, #94 of 143 statewide, top 70%, 1,931 students, 25% FRL) — zoned schools at 32% FRL track the district average.
- Market conditions: Rents rising (+1.1%/yr); 416 active listings in the ZIP; 9 comparable units currently listed for rent nearby; rentals at typical pace (median 24d on market — plan ~3-4 weeks tenant-placement turnaround); solid renter incomes; 946 units permitted in Clackamas County in 2024 (188 in 5+ unit buildings).
- This rent runs 33% of the median local income ($104k/yr) — at the standard rent-burdened threshold; future hikes will face affordability resistance.
Forward outlook
- Local home prices are declining (-3.0%/yr); year-one equity from $2k of loan paydown is wiped out by about $9k of value loss. Plan a longer hold.
- Clackamas County population projected at +25% by 2050 — long-run rental-demand tailwind backs the buy-and-hold thesis.
Negotiation context
- It's been on market 153 days — a 12% lower offer ($263k) is reasonable based on typical stale-listing flexibility.
Questions for the listing agent
- It's been on market 153 days. Have you received any prior offers? Is the seller open to a 12% concession, seller financing, or rate buy-down credit?
- Built in 1968 — when were the roof, HVAC, electrical panel, plumbing, and water heater last replaced?
- Why hasn't it sold? Are there any deal-killer items the seller is aware of (foundation, flood, title, zoning, code violations)?
- Is there a deadline driving the sale (1031 exchange, divorce, estate, relocation)? That informs how much negotiation room exists.
- What's the average days-on-market for RENTAL listings here right now (not sales)? A rising rental-DOM trend means longer vacancies and softer asking-rent achievability than the comps imply.
- What's the recent tenant-quality profile in this submarket — average credit score on applications, eviction rate, late-payment / NSF rate, and stable-employment percentage? A property-management company in the area should have these aggregated.
- How much new for-sale + rental construction is in the pipeline within 1–3 miles? Heavy new supply typically softens prices + rents 12–24 months out; constrained supply supports both.
Investment metrics
- 1% rule
- 0.94% ✗
- Cap rate
- 6.93%
- Cash-on-cash
- 2.28%
- DSCR
- 1.10
- GRM
- 8.8
CMA / ARV
- ARV (median comp)
- $455,753
- List price
- $299,000
- Delta
- -34.39%
- Verdict
- UNDERPRICED
- Comps
- 20 within 1.0 mi
Show comp detail 12 sales within ~0.75 mi
| Address | Dist | Beds/Ba | Sqft | Sold | Price | $/sf | Match |
|---|---|---|---|---|---|---|---|
| 1114 Washington St | 0.28mi | 3/1.0 | 1,880 (+5%) | 9mo | $525,000 | $279 | 67 |
| 709 10th St | 0.39mi | 3/2.0 | 1,926 (+8%) | 6mo | $400,000 | $208 | 64 |
| 1220 10th St | 0.62mi | 4/2.0 (+1) | 1,764 (-1%) | 2mo | $549,900 | $312 | 62 |
| 509 JQ Adams St | 0.73mi | 3/1.0 | 1,782 (-0%) | 1mo | $479,000 | $269 | 61 |
| 1615 Van Buren St | 0.57mi | 4/1.0 (+1) | 1,848 (+3%) | 2mo | $415,000 | $225 | 57 |
| 409 3rd St | 0.72mi | 2/1.0 (-1) | 1,794 (+0%) | 3mo | $412,000 | $230 | 55 |
| 515 High St | 0.56mi | 3/2.0 | 1,932 (+8%) | 7mo | $775,000 | $401 | 54 |
| 411 4th St | 0.66mi | 4/2.0 (+1) | 1,717 (-4%) | 6mo | $417,000 | $243 | 52 |
| 916 Harrison St | 0.70mi | 3/2.0 | 1,590 (-11%) | 7mo | $409,000 | $257 | 44 |
| 408 High St | 0.65mi | 3/2.0 | 2,008 (+12%) | 8mo | $410,000 | $204 | 43 |
| 911 9th St | 0.51mi | 2/1.0 (-1) | 1,536 (-14%) | 4mo | $460,000 | $299 | 41 |
| 601 JQ Adams St | 0.68mi | 2/2.0 (-1) | 1,557 (-13%) | 18mo | $410,000 | $263 | 26 |
Match score weights: distance 35% · size 25% · config 20% · recency 20%. Top-matched comps best support the ARV.
Projected returns pro-forma
-3.0% appreciation · 1.12% rent growth · sell at horizon
- IRR
- -14.8%
- Equity multiple
- 0.48×
- Total profit
- $-43,496
- Equity at exit
- $44,582
- IRR
- -9.6%
- Equity multiple
- 0.46×
- Total profit
- $-45,311
- Equity at exit
- $25,852
Cash invested: $83,720 (down + closing). Projections, not guarantees.
Landlord ↔ Tenant lean methodology
- Overall (STATE)
- 28 Tenant-Leaning
- State Oregon
- 28 Tenant-Leaning · D+6
- County
- — inherits STATE
- City
- — inherits STATE
ZIP-level market 97045
- Rents YoY
- 1.1%
- Active inventory
- 416
- Price-to-rent
- 8.8×
Monthly cashflow live
- Estimated rent
- $2,817 high interval (Pro) →
- Mortgage (P&I)
- −$1,568
- Tax est. 1.5%
- −$374 /mo · $4,485/yr
- Insurance
- −$125
- HOA
- −$0
- Vacancy / Maint / Mgmt
- −$592
- Net cashflow
- $159
Break-even live
Sensitivity live
| Price | -10% $366 | -5% $263 | +0% $159 | +5% $56 | +10% $-47 |
|---|---|---|---|---|---|
| Rent | -10% $-63 | -5% $48 | +0% $159 | +5% $271 | +10% $382 |
| Rate | -1.0pp $310 | -0.5pp $235 | base $159 | +0.5pp $82 | +1.0pp $3 |
UW: 25.0% down · 7.5% · 30yr · 1.5% tax · 5.0% vac · 8.0% maint · 8.0% mgmt
Financing live
Cash to close
- Down payment
- $74,750
- Closing costs
- $8,970
- Reserves months
- —
- Total cash needed
- —
Loan-product check · same deal, 3 products live
Conventional
25% down · 7.5% · 30yr
- Down + closing
- —
- Monthly P&I
- —
- Monthly cashflow
- —
- DSCR
- —
- Eligible?
- —
Personal DTI + credit; lowest rate.
DSCR
20% down · 8.5% · 30yr
- Down + closing
- —
- Monthly P&I
- —
- Monthly cashflow
- —
- DSCR
- —
- Eligible?
- —
No personal income docs; deal must DSCR.
Hard money
10% down · 12.0% · 12mo
- Down + closing
- —
- Monthly P&I
- —
- Monthly cashflow
- —
- DSCR
- —
- Eligible?
- —
Short-term bridge; refi at stabilization.
Rent comps 9 comps
| Address | Beds | Baths | Sqft | Rent | $/sqft | DOM | Units | Dist |
|---|---|---|---|---|---|---|---|---|
| 1937 Main St Oregon City, OR | 1.0–3.0 | 1.0–2.0 | 1187 | $3,015 | $2.54 | 0d | 20 | 0.47mi |
| 716 Center St Oregon City, OR | 3.0 | 2.5 | 1500 | $2,595 | $1.73 | 45d | 1 | 0.48mi |
| 22491 Clark St West Linn, OR | 4.0 | 2.5 | 2469 | $3,495 | $1.42 | 45d | 1 | 0.98mi |
| 19416 SE River Rd Portland, OR | 3.0 | 2.5 | 1350 | $2,500 | $1.85 | 23d | 1 | 1.26mi |
| 505 Brighton Ave Oregon City, OR | 3.0 | 2.0 | 1733 | $2,750 | $1.59 | 21d | 1 | 1.28mi |
| 2780 Oxford St West Linn, OR | 3.0 | 2.0 | 1225 | $2,795 | $2.28 | 25d | 1 | 1.33mi |
| 150 Narain Ct Oregon City, OR | 4.0 | 2.0 | 2200 | $3,500 | $1.59 | 25d | 1 | 1.36mi |
| 1335 Windsor Dr Gladstone, OR | 3.0 | 2.0 | 2400 | $2,995 | $1.25 | 5d | 1 | 1.43mi |
| 1335 Windsor Dr Gladstone, OR | 3.0 | 2.0 | 2400 | $2,995 | $1.25 | 12d | 1 | 1.43mi |
Listing history 14 events
-
2026-06-21days on market $299,000 Active 153 DOM
-
2026-06-18days on market $299,000 Active 150 DOM
-
2026-06-17days on market $299,000 Active 149 DOM
-
2026-06-16days on market $299,000 Active 148 DOM
-
2026-06-15days on market $299,000 Active 147 DOM
-
2026-06-13days on market $299,000 Active 145 DOM
-
2026-06-09days on market $299,000 Active 141 DOM
-
2026-06-08days on market $299,000 Active 140 DOM
-
2026-06-07days on market $299,000 Active 139 DOM
-
2026-06-03days on market $299,000 Active 135 DOM
-
2026-06-02days on market $299,000 Active 134 DOM
-
2026-06-01days on market $299,000 Active 133 DOM
-
2026-05-31days on market $299,000 Active 132 DOM
-
2026-01-19$299,000 Active 630-char remark
Show marketing remark (630 chars)
Solid 3 bedroom, 2 bathroom, 1788sf, 2 level floating home with float rated 3+ October 2025 can qualify for loan. New carpet and paint throughout interior January 2026. Pellet Stove in living room keeps home cozy in winter and Portable AC plus wall unit upstairs keeps you cool in the summer! GREAT value waiting for someone to enjoy. This house must be moved, there is slip at Jantzen Beach Moorage @ 239k, McGuire Point @ 300k & Columbia Ridge @ 325 + Harbor One with a $10K move in fee. With accepted deal seller will deliver to any moorage in the Portland Metro - 29' x 52' float find slip & begin living on the River!
ⓘ Source: listings_history table (triggers on properties + properties_extension) + one-shot
backfill from property_details.listing_events for pre-trigger history.
Nearby sold comps map
Loading sold comps map…
Walkable amenities ~0.75 mi
Loading nearby amenities…
Taxation est. · year 1
- Rental income
- $33,806
- − Mortgage interest
- −$16,749
- − Property taxes
- −$4,485
- − Insurance
- −$1,495
- − Repairs & maintenance
- −$2,705
- − Management
- −$2,705
- − Depreciation
- −$8,698
- Taxable loss
- −$3,029
- Est. tax savings @ 24.0%
- +$727
- After-tax cash flow
- $2,638/yr
For passive investors: Depreciation is non-cash, so a rental often shows a tax loss while cash-flowing — sheltering income. Rental losses are passive: they offset passive income freely, and up to $25,000/yr can offset ordinary (W-2) income if you actively participate and your MAGI is under $100k (phasing out to $0 by $150k); unused losses carry forward. On sale, claimed depreciation is recaptured at up to 25%, and gains may owe capital-gains tax (a 1031 exchange can defer both). Figures are a year-1 estimate at your 24.0% rate — not tax advice; consult a CPA.
Condition & rehab AI · 12 photos
This floating home is in good condition with cosmetic updates needed. Fresh paint and a new deck would significantly enhance its curb appeal and value.
Repairs flagged
- Minor Deck — Deck shows some wear
Value-add opportunities
- Resale Paint exterior — Fresh paint enhances curb appeal
- Resale Replace deck — A new deck would improve the home's appearance and functionality
Renovation cost estimate screening
| Repair item | Severity | Est. cost |
|---|---|---|
| Deck · Deck shows some wear | Minor | $500–3,000 |
| Total estimated repair cost · 1 items | $500–3,000 |
Value-add ROI direction
- Resale Paint exterior — Fresh paint enhances curb appeal ↑
- Resale Replace deck — A new deck would improve the home's appearance and functionality ↑
ⓘ Cost ranges are severity-bucket heuristics (US national rule-of-thumb). Get contractor quotes + a written scope before underwriting a rehab budget.
Schools (NCES district)
- District
- Oregon City SD 62
- NCES district ID
- 4109330
- Math proficiency
- 18% ▼ -21.00%
- Reading proficiency
- 40% ▼ -18.00%
- Median HH income
- $64,272
- Composite
- 26.65/100
- National rank
- #7169
- State rank
- #40 of 58 in OR
Livability — Oregon City
- Score
- 87/100
- State rank
- #12
- US rank
- #271
Category grades
Schools grade is shown separately in the Schools card above.
Census & demographics
- Census place
- Oregon City, OR
- County
- Clackamas County · 361,406 people
- City population
- 57,526
- Metro
- Portland-Vancouver-Hillsboro, OR-WA
- Population (ZIP)
- 57,526
- Household income
- $103,573
- Rent vs Own
- Severe rent burden
- 1045.0
Population outlook (Clackamas County) Hauer SSP2
- Today (2025)
- 458,456 people
- By 2030
- 485,185 · +5.8%
- By 2040
- 532,932 · +16.2%
- By 2050
- 574,445 · +25.3%
- By 2075
- 665,497 · +45.2%
- By 2100
- 697,488 · +52.1%
Race, ethnicity, and origin ACS 2023
- Neighborhood character
- Predominantly White (85%)
- Race & ethnicity
- White 85% Two or more races 8% Hispanic / Latino 6% Asian 1% Black 1%
- Hispanic origin (detail)
- Mexican 5%
- Common ancestry
- Portuguese 4% Italian 3% Slovak 3%
- Foreign-born
- 5% · Canada
- Languages at home
- 91% English-only · Spanish 4% Russian/Polish/Slavic 2% Other Indo-European 1%
Political lean MEDSL · Clackamas
- 2024 margin
- Lean D (+9.7) · D 53.4% · R 43.6% · Other 3.0%
- 2008→2024 swing
- -0.6pp no change · 2008: 10.4pp · 2024: 9.7pp
- All cycles
- 2024: D+9.7 2020: D+11.1 2016: D+6.1 2012: D+3.5 2008: D+10.4
Not yet ingested
- Civics
- —
Market trends
- HPI YoY
- ▼ -624.55%
- Current HPI
- 301.9661
- Rent YoY
- ▲ 1.12%
- Metro
- Portland-Vancouver-Hillsboro, OR-WA
- State GDP YoY
- ▲ 2.05%
- F500 in state
- 2
Industry mix (Fortune 500 HQ in OR)
| Industry | F500 HQs | Revenue |
|---|---|---|
| Consumer Goods | 1 | $51B |
|
||
Price history
1 event — show timeline
- 2026-01-19 Listed $299,000 RMLS
Cash-flow waterfall
monthlySold comps — $/sqft
last 12 mo · ≤1 miLoading sold comps…