 🏷️ Likely Rental
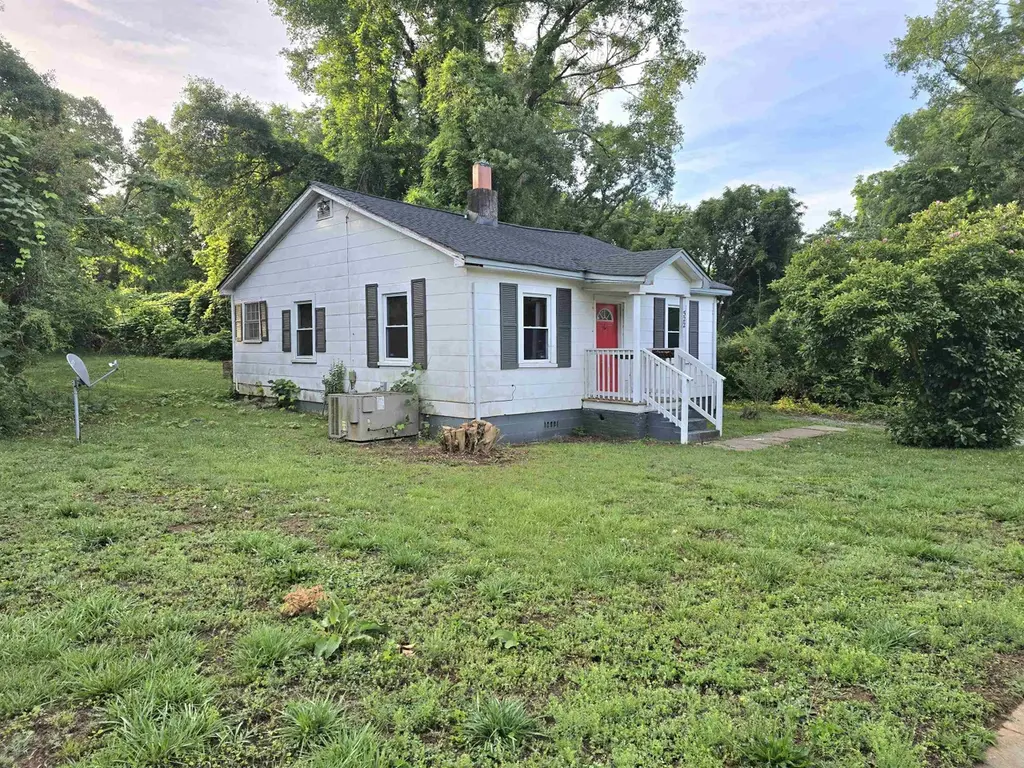
522 Wildwood Dr · Spartanburg, SC
Flood risk 1/10 · Minimal
- FEMA flood zone
- X (unshaded)
- Chance of flooding over 30 yrs
- 0.0%
- Est. flood insurance / yr
- $507 – $1,088
Fire risk 3/10 · Minor
- Est. fire insurance / yr
- $783 – $1,453
Heat risk 6/10 · Moderate
- Hot days now (above 105°F)
- 7 days/yr
- Hot days in 30 yrs
- 16 days/yr
Wind risk 2/10 · Minimal
- Chance of severe wind over 30 yrs
- 2.0%
Air-quality risk 4/10 · Minor
- Unhealthy air days now
- 4 days/yr
- Unhealthy air days in 30 yrs
- 5 days/yr
Risk factors via First Street. Map © Google.
Why this score? — see what drove the B- grade
The composite is a weighted blend of 9 inputs, each scored 0–100. Each bar is that input's sub-score; the figure is the points it added to the 100-point composite (weight × sub-score).
- Cash flow +25.0/30.0
- ARV discount +15.0/15.0
- DSCR +8.1/10.0
- 1% rule +6.4/10.0
- Livability +3.8/5.0
- Rent growth +3.4/5.0
- Schools +3.2/10.0
- Condition / age +2.5/5.0
- Appreciation +0.0/10.0
$104,900
🖨 Deal sheet 📄 Offer letter ✓ Due diligence
Listing remarks MLS
3BR, 1.5 BA house in a convenient location. Would be a great investment property. Tenant occupied, please drive by first to not disturb tenant. Allow 24-48 hours min notice for showings. Rented for $750 for six months starting Dec 1st.
Key facts
- 9,583 sq ft lot
- Built 1935
- Listed 5 days
Property features AI
Exterior
- Security: Smoke detectors
- Utilities: Private water source; Private sewer; Cable available
- Home design: Single-family residence; One story
- Construction: Vinyl siding; Built as a one-level home
- Exterior features: Level lot; Wooded areas; See remarks for additional lot details; Composition roof
Interior
- Flooring: Hardwood
- Bathrooms: 1 full bathroom
- Interior features: Electric water heater; Hardwood floors
- Laundry & utility: Laundry located on the main level
Neighborhood map
What this means for you Summary
Snapshot
- This is a 2-bed/1.0-bath single-family listed at $105k.
Deal economics
- At list price, monthly cash flow is $227 ($3k/yr) — positive.
- The deal already cash-flows at list — no discount required.
- Meets the 1% rule at list price ($1k rent vs $105k).
- Cap rate 8.9% vs local median 3.9% in Spartanburg — top-decile yield for the area; either an underpriced asset or a hidden risk that comps aren't pricing in. Stress-test before assuming the spread holds.
Location & tenants
- Location reads 76/100 on livability (#24 in SC, #3,679 nationally) — a middle-class / working-renter tenant base. Strengths: amenities A+, commute A+, cost of living A+; Watch: crime F, employment F.
- Spartanburg 06 (suburban): math 33% / reading 42% proficiency, ranked #35 of 80 in SC (top 44%) — families likely to look elsewhere, expect single-tenant / working-renter base with shorter leases.
- Zoned schools: Dorman High (math 46% / reading 78%, grade B-, #99 of 196 statewide, top 53%, 3,808 students, 75% FRL) — zoned schools average 75% FRL vs 48% district-wide (26 pts higher); higher-poverty schools than district average — tighter screening recommended.
- Zoned-school proficiency averages 62% at this address vs 38% district-wide (+24 pts) — the actual schools serving this property are materially stronger than the Spartanburg 06 average implies; a family-tenant draw the district grade alone would hide.
- Market conditions: Rents rising (+3.5%/yr); 234 active listings in the ZIP; 12 comparable units currently listed for rent nearby; rentals leasing fast (median 14d on market — plan ~1-2 weeks tenant-placement turnaround); lower-income renter base — watch delinquency; 3,129 units permitted in Spartanburg County in 2024 (40 in 5+ unit buildings).
- This rent runs 35% of the median local income ($41k/yr) — at the standard rent-burdened threshold; future hikes will face affordability resistance.
Forward outlook
- Local home prices are declining (-3.0%/yr); year-one equity from $725 of loan paydown is wiped out by about $3k of value loss. Plan a longer hold.
- Spartanburg County population projected at +18% by 2050 — long-run rental-demand tailwind backs the buy-and-hold thesis.
Negotiation context
- Only 5 days on market — expect competitive offers; lowballing is unlikely to land.
- 3 sale attempts since 8y ago with the ask held roughly flat each time — persistent listings suggest the price (not the market) is what's stuck; bring a comps-based counter.
- Current owner paid $38k; list at $105k implies a 172% gain — meaningful room to come down on a strong offer.
Risks & watch-outs
- Watch-outs: built in 1935 — expect roof / HVAC / electrical / plumbing capex.
- Climate carrying-cost: extreme-heat days projected 7→16/yr by 2055 (HVAC capex compounding) — expect insurance premiums to compound above CPI over the hold.
Questions for the listing agent
- Built in 1935 — when were the roof, HVAC, electrical panel, plumbing, and water heater last replaced?
- Is there a deadline driving the sale (1031 exchange, divorce, estate, relocation)? That informs how much negotiation room exists.
- Schools are D-rated, which usually means shorter tenancies and higher turnover. Who's the typical renter profile here, and what's been the actual vacancy rate?
- Crime grade is F in this area — have there been break-ins, vandalism, or insurance claims at this property in the last 3 years? What carrier currently insures it and at what premium?
- What's the average days-on-market for RENTAL listings here right now (not sales)? A rising rental-DOM trend means longer vacancies and softer asking-rent achievability than the comps imply.
- What's the recent tenant-quality profile in this submarket — average credit score on applications, eviction rate, late-payment / NSF rate, and stable-employment percentage? A property-management company in the area should have these aggregated.
- How much new for-sale + rental construction is in the pipeline within 1–3 miles? Heavy new supply typically softens prices + rents 12–24 months out; constrained supply supports both.
Investment metrics
- 1% rule
- 1.14% ✓
- Cap rate
- 8.89%
- Cash-on-cash
- 9.29%
- DSCR
- 1.41
- GRM
- 7.3
CMA / ARV
- ARV (on-the-fly)
- $164,304
- Comps found
- 12
Show comp detail 12 sales within ~0.75 mi
| Address | Dist | Beds/Ba | Sqft | Sold | Price | $/sf | Match |
|---|---|---|---|---|---|---|---|
| 113 Tyler Ct Ct | 0.32mi | 2/1.0 | 984 (-2%) | 9mo | $160,777 | $163 | 74 |
| 153 White Oak Rd | 0.52mi | 2/1.0 | 981 (-3%) | 7mo | $150,000 | $153 | 65 |
| 504 Hilda St | 0.27mi | 3/1.0 (+1) | 1,075 (+7%) | 9mo | $165,000 | $153 | 64 |
| 510 Hilda St | 0.28mi | 3/1.0 (+1) | 1,088 (+8%) | 7mo | $144,500 | $133 | 63 |
| 126 White Oak Rd | 0.67mi | 2/1.0 | 1,024 (+2%) | 10mo | $170,000 | $166 | 58 |
| 110 Oakleaf Dr | 0.46mi | 2/1.0 | 900 (-11%) | 7mo | $185,000 | $206 | 55 |
| 347 Crestview Dr | 0.52mi | 2/1.0 | 1,116 (+11%) | 4mo | $165,000 | $148 | 54 |
| 217 Briarcliff Rd | 0.49mi | 2/1.0 | 1,154 (+14%) | 2mo | $195,000 | $169 | 51 |
| 115 Rosemary Rd | 0.67mi | 3/1.5 (+1) | 1,044 (+4%) | 6mo | $175,000 | $168 | 51 |
| 110 Rosemary Rd Rd | 0.70mi | 3/1.0 (+1) | 1,026 (+2%) | 14mo | $179,500 | $175 | 47 |
| 112 Tyler Ct | 0.34mi | 3/1.0 (+1) | 1,120 (+11%) | 17mo | $160,000 | $143 | 46 |
| 101 Coldbrook Dr | 0.72mi | 3/1.0 (+1) | 1,134 (+12%) | 11mo | $164,000 | $145 | 32 |
Match score weights: distance 35% · size 25% · config 20% · recency 20%. Top-matched comps best support the ARV.
Projected returns pro-forma
-3.0% appreciation · 3.46% rent growth · sell at horizon
- IRR
- -1.7%
- Equity multiple
- 0.93×
- Total profit
- $-1,946
- Equity at exit
- $15,641
- IRR
- 8.4%
- Equity multiple
- 1.66×
- Total profit
- $19,308
- Equity at exit
- $9,070
Cash invested: $29,372 (down + closing). Projections, not guarantees.
Landlord ↔ Tenant lean methodology
- Overall (STATE)
- 90 Strongly Landlord-Friendly
- State South Carolina
- 90 Strongly Landlord-Friendly · R+6
- County
- — inherits STATE
- City
- — inherits STATE
ZIP-level market 29306
- Home prices YoY
- -29.9%
- Rents YoY
- 3.5%
- Active inventory
- 234
- Price-to-rent
- 7.3×
Monthly cashflow live
- Estimated rent
- $1,194 high interval (Pro) →
- Mortgage (P&I)
- −$550
- Tax from tax record
- −$122 /mo · $1,468/yr
- Insurance
- −$44
- HOA
- −$0
- Vacancy / Maint / Mgmt
- −$251
- Net cashflow
- $227
Break-even live
UW: 25.0% down · 7.5% · 30yr · 1.5% tax · 5.0% vac · 8.0% maint · 8.0% mgmt
Financing live
Cash to close
- Down payment
- $26,225
- Closing costs
- $3,147
- Reserves months
- —
- Total cash needed
- —
Loan-product check · same deal, 3 products live
Conventional
25% down · 7.5% · 30yr
- Down + closing
- —
- Monthly P&I
- —
- Monthly cashflow
- —
- DSCR
- —
- Eligible?
- —
Personal DTI + credit; lowest rate.
DSCR
20% down · 8.5% · 30yr
- Down + closing
- —
- Monthly P&I
- —
- Monthly cashflow
- —
- DSCR
- —
- Eligible?
- —
No personal income docs; deal must DSCR.
Hard money
10% down · 12.0% · 12mo
- Down + closing
- —
- Monthly P&I
- —
- Monthly cashflow
- —
- DSCR
- —
- Eligible?
- —
Short-term bridge; refi at stabilization.
Rent comps 12 comps
| Address | Beds | Baths | Sqft | Rent | $/sqft | DOM | Units | Dist |
|---|---|---|---|---|---|---|---|---|
| 180 S Pine Lake Dr Spartanburg, SC | 1.0–3.0 | 1.0 | 796 | $949 | $1.19 | 13d | 3 | 0.24mi |
| 106 Kensington Dr Apt 308 Spartanburg, SC | 2.0 | 1.0 | 912 | $1,029 | $1.13 | 13d | 1 | 0.61mi |
| 300 Amherst Dr Spartanburg, SC | 2.0 | 1.0 | 763 | $975 | $1.28 | 13d | 1 | 0.84mi |
| 522 Pennwood Dr Spartanburg, SC | 3.0 | 1.0 | 1153 | $1,400 | $1.21 | 21d | 1 | 0.91mi |
| 110 Southport Rd Spartanburg, SC | 1.0–3.0 | 1.0–2.0 | 1044 | $1,412 | $1.35 | 13d | 18 | 1.01mi |
| 624 Crescent Ave Unit 1 Spartanburg, SC | 2.0 | 1.0 | 819 | $1,000 | $1.22 | 21d | 1 | 1.10mi |
| 235 Vanderbilt Rd Spartanburg, SC | 3.0 | 2.5 | 1300 | $1,844 | $1.42 | 21d | 1 | 1.23mi |
| 267 Vanderbilt Rd Spartanburg, SC | 3.0 | 2.5 | 1300 | $1,795 | $1.38 | 21d | 1 | 1.25mi |
| 275 Vanderbilt Spartanburg, SC | 3.0 | 2.5 | 1300 | $1,495 | $1.15 | 13d | 1 | 1.25mi |
| 100 Vanderbilt Ln Spartanburg, SC | 1.0–2.0 | 1.0–2.0 | 787 | $1,195 | $1.52 | 21d | 1 | 1.30mi |
| 100 Pinebrook Rd Unit A Spartanburg, SC | 2.0 | 2.0 | 1000 | $1,050 | $1.05 | 13d | 1 | 1.31mi |
| 201 Powell Mill Rd Spartanburg, SC | 1.0–3.0 | 1.0–2.0 | 1426 | $1,038 | $0.73 | 13d | 23 | 1.50mi |
Listing history 12 events
-
2026-06-03status $104,900 Pending 5 DOM
-
2026-06-02days on market $104,900 Active 5 DOM
-
2026-06-01days on market $104,900 Active 4 DOM
-
2026-05-31days on market $104,900 Active 3 DOM
-
2026-05-30days on market $104,900 Active 2 DOM
-
2026-05-28$104,900 Active
-
2022-05-19price $1,100
-
2019-02-06soldstatus $38,500 Sold 239-char remark
Show marketing remark (239 chars)
3BR, 1.5 BA house in a convenient location. Would be a great investment property. Tenant occupied, please drive by first to not disturb tenant. Allow 24-48 hours min notice for showings. Rented for $750 for six months starting Dec 1st.
-
2019-01-17status Pending 239-char remark
Show marketing remark (239 chars)
3BR, 1.5 BA house in a convenient location. Would be a great investment property. Tenant occupied, please drive by first to not disturb tenant. Allow 24-48 hours min notice for showings. Rented for $750 for six months starting Dec 1st.
-
2019-01-03historical
-
2018-11-06$42,000 Active 239-char remark
Show marketing remark (239 chars)
3BR, 1.5 BA house in a convenient location. Would be a great investment property. Tenant occupied, please drive by first to not disturb tenant. Allow 24-48 hours min notice for showings. Rented for $750 for six months starting Dec 1st.
-
2018-05-14$42,000 Active
ⓘ Source: listings_history table (triggers on properties + properties_extension) + one-shot
backfill from property_details.listing_events for pre-trigger history.
Tax reassessment forecast SC · Resets to sale price
- Current annual tax
- $1,468 · $122/mo
- Projected year-2 tax
- $1,468 · $122/mo
- Expected delta
- $0/yr ($0/mo · 0.0%)
ⓘ Screening estimate from a state-policy table — verify with the county assessor before closing.
Climate risk First Street
- Flood 1/10 Low FEMA zone X (unshaded) · 0% chance over 30 yrs
- Wildfire 3/10 Moderate
- Heat 6/10 Major 7 d/yr ≥105°F today · 16 d/yr by 30 yrs out
- Wind 2/10 Low 2% chance of damaging wind over 30 yrs
- Air quality 4/10 Moderate 4 unhealthy d/yr today · 5 by 30 yrs out
Nearby sold comps map
Loading sold comps map…
Walkable amenities ~0.75 mi
Loading nearby amenities…
Taxation est. · year 1
- Rental income
- $14,333
- − Mortgage interest
- −$5,876
- − Property taxes
- −$1,468
- − Insurance
- −$524
- − Repairs & maintenance
- −$1,147
- − Management
- −$1,147
- − Depreciation
- −$3,052
- Taxable income
- $1,119
- Est. tax owed @ 24.0%
- −$269
- After-tax cash flow
- $2,460/yr
For passive investors: Depreciation is non-cash, so a rental often shows a tax loss while cash-flowing — sheltering income. Rental losses are passive: they offset passive income freely, and up to $25,000/yr can offset ordinary (W-2) income if you actively participate and your MAGI is under $100k (phasing out to $0 by $150k); unused losses carry forward. On sale, claimed depreciation is recaptured at up to 25%, and gains may owe capital-gains tax (a 1031 exchange can defer both). Figures are a year-1 estimate at your 24.0% rate — not tax advice; consult a CPA.
Schools (NCES district)
- District
- Spartanburg 06
- NCES district ID
- 4503630
- Math proficiency
- 33% ▼ -8.00%
- Reading proficiency
- 42% ▼ -2.00%
- Median HH income
- $46,110
- Composite
- 32.02/100
- National rank
- #5827
- State rank
- #35 of 80 in SC
Livability — Spartanburg
- Score
- 76/100
- State rank
- #24
- US rank
- #3679
Category grades
Schools grade is shown separately in the Schools card above.
Census & demographics
- Census place
- Spartanburg, SC
- County
- Spartanburg County · 258,607 people
- City population
- 120,406
- Metro
- Spartanburg, SC
- Population (ZIP)
- 16,714
- Household income
- $41,356
- Rent vs Own
- Severe rent burden
- 1064.0
Population outlook (Spartanburg County) Hauer SSP2
- Today (2025)
- 325,495 people
- By 2030
- 338,800 · +4.1%
- By 2040
- 363,471 · +11.7%
- By 2050
- 384,156 · +18.0%
- By 2075
- 430,137 · +32.1%
- By 2100
- 442,733 · +36.0%
Race, ethnicity, and origin ACS 2023
- Neighborhood character
- Diverse neighborhood (Simpson 0.61)
- Race & ethnicity
- Black 50% White 36% Hispanic / Latino 10% Two or more races 9% Asian 1%
- Hispanic origin (detail)
- Mexican 7% Puerto Rican 2%
- Common ancestry
- Slovak 1% Serbian 1% Iranian 1%
- Foreign-born
- 7% · Canada
- Languages at home
- 90% English-only · Spanish 7% Other Indo-European 2%
Political lean MEDSL · Spartanburg
- 2024 margin
- Solid R (+33.6) · D 32.6% · R 66.2% · Other 1.2%
- 2008→2024 swing
- -12.0pp toward R · 2008: -21.6pp · 2024: -33.6pp
- All cycles
- 2024: R+33.6 2020: R+27.3 2016: R+30.0 2012: R+23.1 2008: R+21.6
Not yet ingested
- Civics
- —
Market trends
- HPI YoY
- ▼ -90.67%
- Current HPI
- 213.1266
- Rent YoY
- ▲ 3.46%
- Metro
- Spartanburg, SC
- State GDP YoY
- ▲ 4.51%
- F500 in state
- 2
Industry mix (Fortune 500 HQ in SC)
| Industry | F500 HQs | Revenue |
|---|---|---|
| Packaging | 1 | $7B |
|
||
Price history
+149.8% since first listed7 events — show timeline
- 2026-05-28 Listed $104,900 SPMLS
- 2022-05-19 Price Changed $1,100 RENT.
- 2019-02-06 Sold (MLS) $38,500 Greater Greenville MLS
- 2019-01-17 Pending — Greater Greenville MLS
- 2019-01-03 Delisted — SPMLS
- 2018-11-06 Listed $42,000 Greater Greenville MLS
- 2018-05-14 Listed $42,000 SPMLS
Property tax history
+3.6%/yrLatest (2025): $1,468 · +7.8% YoY. Source: county tax records.
Cash-flow waterfall
monthlySold comps — $/sqft
last 12 mo · ≤1 miLoading sold comps…