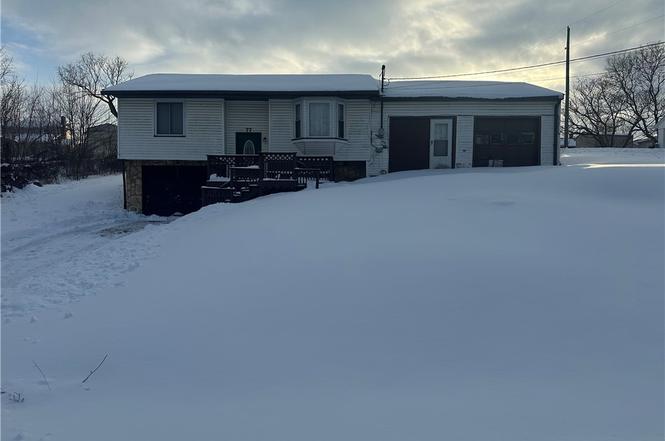
77 North St · Rayland, OH
Flood risk No data
- FEMA flood zone
- —
- Chance of flooding over 30 yrs
- —
- Est. flood insurance / yr
- —
Fire risk No data
- Est. fire insurance / yr
- —
Heat risk No data
- Hot days now (above threshold)
- —
- Hot days in 30 yrs
- —
Wind risk No data
- Chance of severe wind over 30 yrs
- —
Air-quality risk No data
- Unhealthy air days now
- —
- Unhealthy air days in 30 yrs
- —
Risk factors via First Street. Map © Google.
Why this score? — see what drove the C grade
The composite is a weighted blend of 9 inputs, each scored 0–100. Each bar is that input's sub-score; the figure is the points it added to the 100-point composite (weight × sub-score).
- Cash flow +21.8/30.0
- ARV discount +7.5/15.0
- DSCR +7.0/10.0
- Appreciation +5.8/10.0
- 1% rule +5.7/10.0
- Schools +4.1/10.0
- Livability +3.3/5.0
- Rent growth +2.5/5.0
- Condition / age +2.2/5.0
$99,000
🖨 Deal sheet (PDF) 📄 Offer letter ✓ Due diligence
Listing remarks
This 2-bedroom home is located in a quiet residential neighborhood. The property features a functional layout with a living area, kitchen, and two bedrooms. A long-term tenant is currently in place, offering rental income, with potential for future occupancy subject to lease terms. The setting provides a residential environment suitable for a variety of buyers. An option for investors or purchasers considering future owner occupancy. Home being sold AS IS
Key facts
- 7,405 sq ft lot
- 2 garage spots
- Built 1980
Property features AI
Exterior
- Parking: Attached garage with 2 spaces; Direct access garage; Unpaved parking area
- Utilities: Public water; Public sewer
- Home design: 2-story home; Above-grade finished area about 1,460
- Construction: Built (year source: public records); Asphalt/fiberglass roof
- Exterior features: Vinyl siding; Lot size approximately 0.17 acres
Interior
- Bedrooms: 2 main-level bedrooms
- Bathrooms: 1 full bathroom; 1 half bathroom; 1 main-level bathroom
- Heating & cooling: Electric baseboard heating; Wall/window cooling unit(s)
- Interior features: Finished common basement
Neighborhood map
What this means for you Summary
Snapshot
- This is a 2-bed/1.5-bath single-family listed at $99k. Condition is rated fair.
Deal economics
- At list price, monthly cash flow is $155 ($2k/yr) — positive.
- The deal already cash-flows at list — no discount required.
- Meets the 1% rule at list price ($1k rent vs $99k).
- Recommended offer: $87k (12.0% below list) — sets the bar for market timing.
Location & tenants
- Location reads 66/100 on livability (#635 in OH) — a middle-class / working-renter tenant base. Strengths: cost of living A+, housing A+; Watch: employment C-, crime D+, amenities F.
- Buckeye Local (rural): math 44% / reading 53% proficiency, ranked #471 of 656 in OH (top 72%) — families likely to look elsewhere, expect single-tenant / working-renter base with shorter leases.
- Zoned schools: Buckeye North Elementary School (math 47% / reading 57%, grade C-, #851 of 1,584 statewide, top 56%, 273 students, 65% FRL); Buckeye Local Junior High (math 33% / reading 51%, grade D-, #499 of 654 statewide, top 77%, 209 students, 56% FRL); Buckeye Local High School (388 students, 54% FRL).
- Market conditions: 9 active listings in the ZIP; 2 units permitted in Jefferson County in 2024 (0 in 5+ unit buildings).
Forward outlook
- In year one you build about $2k of equity ($684 loan paydown + $2k appreciation (1.6% local appreciation)).
- Jefferson County population projected at -19% by 2050 — secular population decline; favor cash flow + early exit over multi-decade hold.
- At projected returns (1.6% appreciation + 3.0% rent growth), your $28k cash investment doubles in ~6 years — after that, you're playing with house money.
Negotiation context
- It's been on market 143 days — a 12% lower offer ($87k) is reasonable based on typical stale-listing flexibility.
Questions for the listing agent
- It's been on market 143 days. Have you received any prior offers? Is the seller open to a 12% concession, seller financing, or rate buy-down credit?
- Have any recent inspections been done? Can we get a copy of the seller's disclosures and any deferred-maintenance estimates?
- Why hasn't it sold? Are there any deal-killer items the seller is aware of (foundation, flood, title, zoning, code violations)?
- Is there a deadline driving the sale (1031 exchange, divorce, estate, relocation)? That informs how much negotiation room exists.
- Crime grade is D in this area — have there been break-ins, vandalism, or insurance claims at this property in the last 3 years? What carrier currently insures it and at what premium?
- What's the average days-on-market for RENTAL listings here right now (not sales)? A rising rental-DOM trend means longer vacancies and softer asking-rent achievability than the comps imply.
- What's the recent tenant-quality profile in this submarket — average credit score on applications, eviction rate, late-payment / NSF rate, and stable-employment percentage? A property-management company in the area should have these aggregated.
- How much new for-sale + rental construction is in the pipeline within 1–3 miles? Heavy new supply typically softens prices + rents 12–24 months out; constrained supply supports both.
Investment metrics
- 1% rule
- 1.07% ✓
- Cap rate
- 8.17%
- Cash-on-cash
- 6.70%
- DSCR
- 1.30
- GRM
- 7.8
CMA / ARV
No comps found within radius.
Projected returns pro-forma
1.58% appreciation · 3.0% rent growth · sell at horizon
- IRR
- 10.0%
- Equity multiple
- 1.53×
- Total profit
- $14,584
- Equity at exit
- $36,843
- IRR
- 13.3%
- Equity multiple
- 2.72×
- Total profit
- $47,657
- Equity at exit
- $51,409
Cash invested: $27,720 (down + closing). Projections, not guarantees.
Landlord ↔ Tenant lean methodology
- Overall (STATE)
- 73 Landlord-Friendly
- State Ohio
- 73 Landlord-Friendly · R+6
- County
- — inherits STATE
- City
- — inherits STATE
ZIP-level market 43943
- Home prices YoY
- 1.1%
- Active inventory
- 9
- Price-to-rent
- 7.8×
Monthly cashflow live
- Estimated rent
- $1,062 medium interval (Pro) →
- Mortgage (P&I)
- −$519
- Tax est. 1.5%
- −$124 /mo · $1,485/yr
- Insurance
- −$41
- HOA
- −$0
- Vacancy / Maint / Mgmt
- −$223
- Net cashflow
- $155
Break-even live
Sensitivity live
| Price | -10% $223 | -5% $189 | +0% $155 | +5% $121 | +10% $86 |
|---|---|---|---|---|---|
| Rent | -10% $71 | -5% $113 | +0% $155 | +5% $197 | +10% $239 |
| Rate | -1.0pp $205 | -0.5pp $180 | base $155 | +0.5pp $129 | +1.0pp $103 |
UW: 25.0% down · 7.5% · 30yr · 1.5% tax · 5.0% vac · 8.0% maint · 8.0% mgmt
Financing live
Cash to close
- Down payment
- $24,750
- Closing costs
- $2,970
- Reserves months
- —
- Total cash needed
- —
Loan-product check · same deal, 3 products live
Conventional
25% down · 7.5% · 30yr
- Down + closing
- —
- Monthly P&I
- —
- Monthly cashflow
- —
- DSCR
- —
- Eligible?
- —
Personal DTI + credit; lowest rate.
DSCR
20% down · 8.5% · 30yr
- Down + closing
- —
- Monthly P&I
- —
- Monthly cashflow
- —
- DSCR
- —
- Eligible?
- —
No personal income docs; deal must DSCR.
Hard money
10% down · 12.0% · 12mo
- Down + closing
- —
- Monthly P&I
- —
- Monthly cashflow
- —
- DSCR
- —
- Eligible?
- —
Short-term bridge; refi at stabilization.
Listing history 18 events
-
2026-06-21days on market $99,000 Active 143 DOM
-
2026-06-21days on market $99,000 Active 142 DOM
-
2026-06-18status $99,000 Active 140 DOM
-
2026-06-18days on market $99,000 Contingent 140 DOM
-
2026-06-17days on market $99,000 Contingent 139 DOM
-
2026-06-16days on market $99,000 Contingent 138 DOM
-
2026-06-15days on market $99,000 Contingent 137 DOM
-
2026-06-13days on market $99,000 Contingent 135 DOM
-
2026-06-12days on market $99,000 Contingent 134 DOM
-
2026-06-09days on market $99,000 Contingent 131 DOM
-
2026-06-08days on market $99,000 Contingent 130 DOM
-
2026-06-07days on market $99,000 Contingent 129 DOM
-
2026-06-07days on market $99,000 Contingent 128 DOM
-
2026-06-04days on market $99,000 Contingent 125 DOM
-
2026-06-02days on market $99,000 Contingent 124 DOM
-
2026-06-01days on market $99,000 Contingent 123 DOM
-
2026-05-31remarks 459-char remark
-
2026-05-31$99,000 Contingent 122 DOM
ⓘ Source: listings_history table (triggers on properties + properties_extension) + one-shot
backfill from property_details.listing_events for pre-trigger history.
Nearby sold comps map
Loading sold comps map…
Walkable amenities ~0.75 mi
Loading nearby amenities…
Taxation est. · year 1
- Rental income
- $12,742
- − Mortgage interest
- −$5,546
- − Property taxes
- −$1,485
- − Insurance
- −$495
- − Repairs & maintenance
- −$1,019
- − Management
- −$1,019
- − Depreciation
- −$2,880
- Taxable income
- $298
- Est. tax owed @ 24.0%
- −$72
- After-tax cash flow
- $1,785/yr
For passive investors: Depreciation is non-cash, so a rental often shows a tax loss while cash-flowing — sheltering income. Rental losses are passive: they offset passive income freely, and up to $25,000/yr can offset ordinary (W-2) income if you actively participate and your MAGI is under $100k (phasing out to $0 by $150k); unused losses carry forward. On sale, claimed depreciation is recaptured at up to 25%, and gains may owe capital-gains tax (a 1031 exchange can defer both). Figures are a year-1 estimate at your 24.0% rate — not tax advice; consult a CPA.
Condition & rehab AI · 2 photos
This 2-bedroom home requires significant repairs and maintenance, including a new roof, exterior siding and paint, HVAC replacement, and landscaping improvements. These updates would significantly increase its resale and rental value.
Repairs flagged
- Major roof — Signs of wear and discoloration suggest significant damage.
- Major siding — Peeling paint and chipping paint indicate severe wear.
- Major flooring — Visible wear and tear suggest the need for replacement.
- Major HVAC unit — The unit appears old and may need maintenance or replacement.
- Major windows — Old windows may need replacement or repair for energy efficiency and appearance.
- Major interior walls/paint — Wear and tear on walls and paint suggest a need for repainting or replacement.
- Major landscaping — Minimal landscaping and low curb appeal suggest a need for improvement to enhance the property's value.
- Minor foundation — No visible structural issues, but may need minor repairs or maintenance.
Value-add opportunities
- Resale roof replacement — A new roof would significantly improve the home's appearance and value.
- Resale exterior siding and paint — New siding and paint would enhance the home's curb appeal and value.
- Both HVAC replacement — A new HVAC system would improve comfort and energy efficiency, benefiting both resale and rental value.
- Both landscaping and curb appeal — Improved landscaping would enhance the home's curb appeal and attract more buyers or renters.
- Resale interior painting — Fresh paint would improve the home's appearance and value.
- Both window replacement — New windows would improve energy efficiency and the home's overall appearance, benefiting both resale and rental value.
Renovation cost estimate screening
| Repair item | Severity | Est. cost |
|---|---|---|
| roof · Signs of wear and discoloration suggest significant damage. | Major | $15,000–50,000 |
| siding · Peeling paint and chipping paint indicate severe wear. | Major | $15,000–50,000 |
| flooring · Visible wear and tear suggest the need for replacement. | Major | $15,000–50,000 |
| HVAC unit · The unit appears old and may need maintenance or replacement. | Major | $15,000–50,000 |
| windows · Old windows may need replacement or repair for energy efficiency and appearance. | Major | $15,000–50,000 |
| interior walls/paint · Wear and tear on walls and paint suggest a need for repainting or replacement. | Major | $15,000–50,000 |
| landscaping · Minimal landscaping and low curb appeal suggest a need for improvement to enhance the property's value. | Major | $15,000–50,000 |
| foundation · No visible structural issues, but may need minor repairs or maintenance. | Minor | $500–3,000 |
| Total estimated repair cost · 8 items | $105,500–353,000 |
Value-add ROI direction
- Resale roof replacement — A new roof would significantly improve the home's appearance and value. ↑
- Resale exterior siding and paint — New siding and paint would enhance the home's curb appeal and value. ↑
- Both HVAC replacement — A new HVAC system would improve comfort and energy efficiency, benefiting both resale and rental value. ↑
- Both landscaping and curb appeal — Improved landscaping would enhance the home's curb appeal and attract more buyers or renters. ↑
- Resale interior painting — Fresh paint would improve the home's appearance and value. ↑
- Both window replacement — New windows would improve energy efficiency and the home's overall appearance, benefiting both resale and rental value. ↑
ⓘ Cost ranges are severity-bucket heuristics (US national rule-of-thumb). Get contractor quotes + a written scope before underwriting a rehab budget.
Schools (NCES district)
- District
- Buckeye Local
- NCES district ID
- 3904778
- Math proficiency
- 44% ▼ -18.00%
- Reading proficiency
- 53% ▼ -10.00%
- Median HH income
- $41,332
- Composite
- 40.68/100
- National rank
- #3673
- State rank
- #471 of 656 in OH
Livability — Rayland
- Score
- 66/100
- State rank
- #635
- US rank
- #11212
Category grades
Schools grade is shown separately in the Schools card above.
Census & demographics
- County
- Jefferson · 64,369 people
- Metro
- Weirton-Steubenville, WV-OH
- Population (ZIP)
- 3,288
- Household income
- $49,569
- Rent vs Own
- Severe rent burden
- 5.9
Population outlook (Jefferson County) Hauer SSP2
- Today (2025)
- 63,481 people
- By 2030
- 61,067 · -3.8%
- By 2040
- 55,860 · -12.0%
- By 2050
- 51,236 · -19.3%
- By 2075
- 41,804 · -34.1%
- By 2100
- 32,344 · -49.0%
Race, ethnicity, and origin ACS 2023
- Neighborhood character
- Predominantly White (97%)
- Race & ethnicity
- White 97% Two or more races 1%
- Common ancestry
- Romanian 15% Polish 2% Serbian 1%
- Foreign-born
- 0%
- Languages at home
- 98% English-only · Other Indo-European 1%
Political lean MEDSL · Jefferson
- 2024 margin
- Solid R (+43.9) · D 27.5% · R 71.4% · Other 1.1%
- 2008→2024 swing
- -44.1pp toward R · 2008: 0.2pp · 2024: -43.9pp
- All cycles
- 2024: R+43.9 2020: R+38.4 2016: R+35.7 2012: R+5.5 2008: D+0.2
Not yet ingested
- Civics
- —
Market trends
- HPI YoY
- ▲ 1.58%
- Current HPI
- 138.7959
- Rent YoY
- —
- Metro
- —
- State GDP YoY
- ▲ 1.98%
- F500 in state
- 48
Industry mix (Fortune 500 HQ in OH)
| Industry | F500 HQs | Revenue |
|---|---|---|
| Insurance | 3 | $145B |
|
||
| Industrial Machinery | 3 | $49B |
|
||
| Financial Services | 3 | $24B |
|
||
| Consumer Goods | 2 | $93B |
|
||
| Aerospace / Defense | 2 | $47B |
|
||
| Utilities | 2 | $33B |
|
||
Price history
2 events — show timeline
- 2026-02-06 Contingent — MLSNOW
- 2026-01-27 Listed $99,000 MLSNOW
Cash-flow waterfall
monthlySold comps — $/sqft
last 12 mo · ≤1 miLoading sold comps…