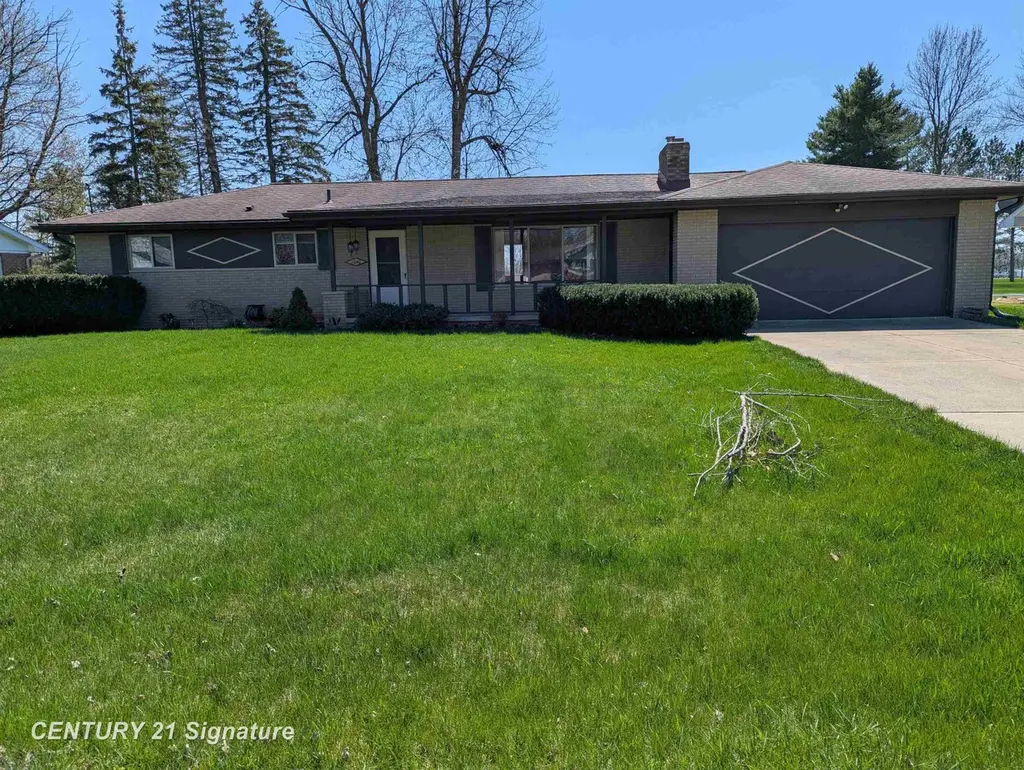
1040 Wheelock St · Freeland, MI
Flood risk 1/10 · Minimal
- FEMA flood zone
- X (unshaded)
- Chance of flooding over 30 yrs
- 0.0%
- Est. flood insurance / yr
- $473 – $860
Fire risk 1/10 · Minimal
- Est. fire insurance / yr
- $784 – $1,456
Heat risk 2/10 · Minimal
- Hot days now (above 98°F)
- 7 days/yr
- Hot days in 30 yrs
- 14 days/yr
Wind risk 1/10 · Minimal
- Chance of severe wind over 30 yrs
- —
Air-quality risk 2/10 · Minimal
- Unhealthy air days now
- 1 days/yr
- Unhealthy air days in 30 yrs
- 1 days/yr
Risk factors via First Street. Map © Google.
Why this score? — see what drove the B+ grade
The composite is a weighted blend of 9 inputs, each scored 0–100. Each bar is that input's sub-score; the figure is the points it added to the 100-point composite (weight × sub-score).
- Cash flow +30.0/30.0
- ARV discount +15.0/15.0
- 1% rule +10.0/10.0
- DSCR +10.0/10.0
- Schools +5.1/10.0
- Livability +3.6/5.0
- Rent growth +2.5/5.0
- Condition / age +2.5/5.0
- Appreciation +0.0/10.0
$126,000
🖨 Deal sheet 📄 Offer letter ✓ Due diligence
Listing remarks MLS
Great potential in Freeland. Three bedroom, one and a half bath ranch home. Subject to 3rd party approval.
Key facts
- 0.24 acre lot
- 2 garage spots
- Built 1962
Property features AI
Finance
- Other: Subdivision: GUSTAV O ROESER NO 2; Cross streets near 7th and 10th
- HOA & community: Homeowners association present
Exterior
- Parking: Attached 2-car garage
- Utilities: Public water; Public sewer
- Home design: Single-family residence; One level
- Construction: Brick construction; Block foundation; Built with a shingle roof (not explicitly listed)
- Exterior features: Brick exterior; Yard includes shed(s); Publicly maintained road access; Lot roughly 90 x 120 (0.24 acre)
Interior
- Bathrooms: 1 full bathroom; 1 half bathroom
- Heating & cooling: Forced air heating (natural gas); No central cooling
- Interior features: Living room fireplace; Basement with block foundation; Total of 7 rooms
Neighborhood map
What this means for you Summary
Snapshot
- This is a 3-bed/1.5-bath single-family listed at $126k.
Deal economics
- At list price, monthly cash flow is $2k ($19k/yr) — positive.
- The deal already cash-flows at list — no discount required.
- Meets the 1% rule at list price ($3k rent vs $126k).
- Recommended offer: $122k (3.0% below list) — sets the bar for market timing.
- Cap rate 21.4% vs local median 3.2% in Freeland — top-decile yield for the area; either an underpriced asset or a hidden risk that comps aren't pricing in. Stress-test before assuming the spread holds.
Location & tenants
- Location reads 72/100 on livability (#230 in MI) — a middle-class / working-renter tenant base. Strengths: employment A+, cost of living A+, housing A+; Watch: health & safety C-, amenities F, commute F.
- Freeland Community School District (suburban): math 54% / reading 61% proficiency, ranked #46 of 540 in MI (top 8%) — acceptable for families but not a draw, mixed tenant base, ~2y average lease; only 15% free/reduced lunch — higher-income household profile.
- Market conditions: 94 active listings in the ZIP; 1 comparable units currently listed for rent nearby; 154 units permitted in Saginaw County in 2024 (0 in 5+ unit buildings).
Forward outlook
- Local home prices are declining (-3.0%/yr); year-one equity from $871 of loan paydown is wiped out by about $4k of value loss. Plan a longer hold.
- Saginaw County population projected at -25% by 2050 — secular population decline; favor cash flow + early exit over multi-decade hold.
- At projected returns (-3.0% appreciation + 3.0% rent growth), your $35k cash investment doubles in ~3 years — after that, you're playing with house money.
Negotiation context
- It's been on market 57 days — a 3% lower offer ($122k) is reasonable based on typical stale-listing flexibility.
- 12 sale attempts since 6y ago with the ask held roughly flat each time — persistent listings suggest the price (not the market) is what's stuck; bring a comps-based counter.
Questions for the listing agent
- It's been on market 57 days. Have you received any prior offers? Is the seller open to a 3% concession, seller financing, or rate buy-down credit?
- Built in 1962 — when were the roof, HVAC, electrical panel, plumbing, and water heater last replaced?
- Is there a deadline driving the sale (1031 exchange, divorce, estate, relocation)? That informs how much negotiation room exists.
- What's the average days-on-market for RENTAL listings here right now (not sales)? A rising rental-DOM trend means longer vacancies and softer asking-rent achievability than the comps imply.
- What's the recent tenant-quality profile in this submarket — average credit score on applications, eviction rate, late-payment / NSF rate, and stable-employment percentage? A property-management company in the area should have these aggregated.
- How much new for-sale + rental construction is in the pipeline within 1–3 miles? Heavy new supply typically softens prices + rents 12–24 months out; constrained supply supports both.
Investment metrics
- 1% rule
- 2.38% ✓
- Cap rate
- 21.45%
- Cash-on-cash
- 54.12%
- DSCR
- 3.41
- GRM
- 3.5
CMA / ARV
- ARV (median comp)
- $216,143
- List price
- $126,000
- Delta
- -41.71%
- Verdict
- UNDERPRICED
- Comps
- 20 within 1.0 mi
Show comp detail 11 sales within ~0.75 mi
| Address | Dist | Beds/Ba | Sqft | Sold | Price | $/sf | Match |
|---|---|---|---|---|---|---|---|
| 9855 Elmwood Dr | 0.42mi | 3/1.5 | 1,440 (0%) | 1mo | $205,000 | $142 | 80 |
| 942 Wheelock St | 0.07mi | 4/1.5 (+1) | 1,532 (+6%) | 11mo | $200,000 | $131 | 72 |
| 1141 N Dawn Dr | 0.12mi | 3/1.5 | 1,624 (+13%) | 8mo | $220,000 | $135 | 66 |
| 8081 Webster Rd | 0.40mi | 4/1.5 (+1) | 1,536 (+7%) | 0mo | $220,000 | $143 | 65 |
| 400 S Seventh St | 0.18mi | 3/2.5 | 1,550 (+8%) | 14mo | $236,900 | $153 | 63 |
| 415 E Washington St | 0.48mi | 3/1.0 | 1,390 (-4%) | 12mo | $165,500 | $119 | 60 |
| 273 Church St | 0.50mi | 3/2.0 | 1,562 (+8%) | 9mo | $215,900 | $138 | 53 |
| 571 E Dawn Dr | 0.18mi | 3/2.0 | 1,609 (+12%) | 21mo | $233,600 | $145 | 52 |
| 8326 Waxwing Dr | 0.65mi | 3/2.0 | 1,335 (-7%) | 7mo | $297,000 | $222 | 50 |
| 180 S Sixth St | 0.32mi | 3/1.0 | 1,288 (-11%) | 19mo | $165,000 | $128 | 49 |
| 8407 Waxwing Dr | 0.73mi | 3/2.0 | 1,615 (+12%) | 20mo | $315,000 | $195 | 27 |
Match score weights: distance 35% · size 25% · config 20% · recency 20%. Top-matched comps best support the ARV.
Projected returns pro-forma
-3.0% appreciation · 3.0% rent growth · sell at horizon
- IRR
- 52.3%
- Equity multiple
- 3.29×
- Total profit
- $80,905
- Equity at exit
- $18,787
- IRR
- 57.5%
- Equity multiple
- 6.69×
- Total profit
- $200,888
- Equity at exit
- $10,894
Cash invested: $35,280 (down + closing). Projections, not guarantees.
Landlord ↔ Tenant lean methodology
- Overall (STATE)
- 62 Landlord-Friendly
- State Michigan
- 62 Landlord-Friendly · EVEN
- County
- — inherits STATE
- City
- — inherits STATE
ZIP-level market 48623
- Home prices YoY
- -26.7%
- Active inventory
- 94
- Price-to-rent
- 3.5×
Monthly cashflow live
- Estimated rent
- $3,000 medium interval (Pro) →
- Mortgage (P&I)
- −$661
- Tax from tax record
- −$66 /mo · $789/yr
- Insurance
- −$52
- HOA
- −$0
- Vacancy / Maint / Mgmt
- −$630
- Net cashflow
- $1,591
Break-even live
UW: 25.0% down · 7.5% · 30yr · 1.5% tax · 5.0% vac · 8.0% maint · 8.0% mgmt
Financing live
Cash to close
- Down payment
- $31,500
- Closing costs
- $3,780
- Reserves months
- —
- Total cash needed
- —
Loan-product check · same deal, 3 products live
Conventional
25% down · 7.5% · 30yr
- Down + closing
- —
- Monthly P&I
- —
- Monthly cashflow
- —
- DSCR
- —
- Eligible?
- —
Personal DTI + credit; lowest rate.
DSCR
20% down · 8.5% · 30yr
- Down + closing
- —
- Monthly P&I
- —
- Monthly cashflow
- —
- DSCR
- —
- Eligible?
- —
No personal income docs; deal must DSCR.
Hard money
10% down · 12.0% · 12mo
- Down + closing
- —
- Monthly P&I
- —
- Monthly cashflow
- —
- DSCR
- —
- Eligible?
- —
Short-term bridge; refi at stabilization.
Rent comps 1 comps
| Address | Beds | Baths | Sqft | Rent | $/sqft | DOM | Units | Dist |
|---|---|---|---|---|---|---|---|---|
| 8441 Cottonwood Dr Freeland, MI | 3.0 | 2.0 | 1600 | $3,000 | $1.88 | 43d | 1 | 0.86mi |
Listing history 50 events
-
2026-06-19days on market $126,000 Active 57 DOM
-
2026-06-18days on market $126,000 Active 56 DOM
-
2026-06-17days on market $126,000 Active 55 DOM
-
2026-06-16days on market $126,000 Active 54 DOM
-
2026-06-15days on market $126,000 Active 53 DOM
-
2026-06-14days on market $126,000 Active 51 DOM
-
2026-06-12days on market $126,000 Active 50 DOM
-
2026-06-09days on market $126,000 Active 47 DOM
-
2026-06-08days on market $126,000 Active 46 DOM
-
2026-06-07days on market $126,000 Active 45 DOM
-
2026-06-05days on market $126,000 Active 42 DOM
-
2026-06-02days on market $126,000 Active 40 DOM
-
2026-06-01days on market $126,000 Active 39 DOM
-
2026-05-31days on market $126,000 Active 38 DOM
-
2026-05-30days on market $126,000 Active 37 DOM
-
2026-04-23$126,000 Active 106-char remark
Show marketing remark (106 chars)
Great potential in Freeland. Three bedroom, one and a half bath ranch home. Subject to 3rd party approval.
-
2026-04-23$126,000 Active 106-char remark
Show marketing remark (106 chars)
Great potential in Freeland. Three bedroom, one and a half bath ranch home. Subject to 3rd party approval.
-
2026-01-22historical
-
2025-11-17price $194,900
-
2025-11-17price $194,900
-
2025-08-26price $199,900
-
2025-08-25price $199,900
-
2025-08-07price $210,000
-
2025-08-06price $210,000
-
2025-08-06status Active
-
2025-08-06status Active
-
2025-07-29historical Active Under Contract
-
2025-07-29historical Accepting Backup Offers
-
2025-07-07status Active
-
2025-07-07status Back on Market
-
2025-06-30status Pending
-
2025-06-30status Pending
-
2025-06-30historical
-
2025-06-01price $215,000
-
2025-06-01price $215,000
-
2025-05-16$225,000 Active
-
2025-05-16$225,000 Active
-
2020-07-21soldstatus $151,000
-
2020-07-13soldstatus $151,000 Sold
-
2020-07-13soldstatus $151,000 Closed
-
2020-07-12status Pending
-
2020-07-12status Pending
-
2020-05-19historical Contingent - Continue To Show
-
2020-05-19historical Keep Showing-Contgcy Appl
-
2020-03-30status Active
-
2020-03-30status Active
-
2020-03-10historical Contingent - Continue To Show
-
2020-03-10historical Keep Showing-Contgcy Appl
-
2020-03-09status Pending
-
2020-03-09status Pending
ⓘ Source: listings_history table (triggers on properties + properties_extension) + one-shot
backfill from property_details.listing_events for pre-trigger history.
Tax reassessment forecast MI · Partial reset (capped growth)
- Current annual tax
- $789 · $66/mo
- Projected year-2 tax
- $1,365 · $114/mo
- Expected delta
- +$576/yr (+$48/mo · 73.0%)
ⓘ Screening estimate from a state-policy table — verify with the county assessor before closing.
Climate risk First Street
- Flood 1/10 Low FEMA zone X (unshaded) · 0% chance over 30 yrs
- Wildfire 1/10 Low
- Heat 2/10 Low 7 d/yr ≥98°F today · 14 d/yr by 30 yrs out
- Wind 1/10 Low
- Air quality 2/10 Low 1 unhealthy d/yr today · 1 by 30 yrs out
Nearby sold comps map
Loading sold comps map…
Walkable amenities ~0.75 mi
Loading nearby amenities…
Taxation est. · year 1
- Rental income
- $36,000
- − Mortgage interest
- −$7,058
- − Property taxes
- −$789
- − Insurance
- −$630
- − Repairs & maintenance
- −$2,880
- − Management
- −$2,880
- − Depreciation
- −$3,665
- Taxable income
- $18,098
- Est. tax owed @ 24.0%
- −$4,344
- After-tax cash flow
- $14,749/yr
For passive investors: Depreciation is non-cash, so a rental often shows a tax loss while cash-flowing — sheltering income. Rental losses are passive: they offset passive income freely, and up to $25,000/yr can offset ordinary (W-2) income if you actively participate and your MAGI is under $100k (phasing out to $0 by $150k); unused losses carry forward. On sale, claimed depreciation is recaptured at up to 25%, and gains may owe capital-gains tax (a 1031 exchange can defer both). Figures are a year-1 estimate at your 24.0% rate — not tax advice; consult a CPA.
Schools (NCES district)
- District
- Freeland Community School District
- NCES district ID
- 2615060
- Math proficiency
- 54% ▼ -4.00%
- Reading proficiency
- 61% ▼ -3.00%
- Median HH income
- $70,875
- Composite
- 50.98/100
- National rank
- #1779
- State rank
- #46 of 540 in MI
Livability — Freeland
- Score
- 72/100
- State rank
- #230
- US rank
- #5824
Category grades
Schools grade is shown separately in the Schools card above.
Census & demographics
- Census place
- Freeland, MI
- City population
- 15,126
- Population (ZIP)
- 15,126
Population outlook (Saginaw County) Hauer SSP2
- Today (2025)
- 180,568 people
- By 2030
- 172,302 · -4.6%
- By 2040
- 153,919 · -14.8%
- By 2050
- 135,519 · -24.9%
- By 2075
- 97,199 · -46.2%
- By 2100
- 65,037 · -64.0%
Race, ethnicity, and origin ACS 2023
- Neighborhood character
- Predominantly White (86%)
- Race & ethnicity
- White 86% Two or more races 5% Black 5% Hispanic / Latino 3%
- Common ancestry
- Romanian 11% Lithuanian 5% Slovak 2%
- Foreign-born
- 0%
- Languages at home
- 97% English-only · Spanish 2%
Political lean MEDSL · Saginaw
- 2024 margin
- Toss-up / Even · D 47.7% · R 51.0% · Other 1.4%
- 2008→2024 swing
- -20.6pp toward R · 2008: 17.3pp · 2024: -3.3pp
- All cycles
- 2024: R+3.3 2020: D+0.3 2016: R+1.1 2012: D+11.9 2008: D+17.3
Not yet ingested
- Civics
- —
Market trends
- HPI YoY
- ▼ -78.02%
- Current HPI
- 213.8908
- Rent YoY
- —
- Metro
- —
- State GDP YoY
- ▲ 1.37%
- F500 in state
- 28
Industry mix (Fortune 500 HQ in MI)
| Industry | F500 HQs | Revenue |
|---|---|---|
| Automotive Parts | 3 | $48B |
|
||
| Automotive | 2 | $372B |
|
||
| Chemicals | 1 | $45B |
|
||
| Automotive Retail | 1 | $29B |
|
||
| Healthcare / Medical Devices | 1 | $23B |
|
||
| Automotive Technology | 1 | $20B |
|
||
Price history
-13.1% since first listed40 events — show timeline
- 2026-04-23 Listed $126,000 MiRealSource-MiMLS
- 2026-04-23 Listed $126,000 REALCOMP
- 2026-01-22 Listing Removed — MiRealSource-MiMLS
- 2025-11-17 Price Changed $194,900 MiRealSource-MiMLS
- 2025-11-17 Price Changed $194,900 REALCOMP
- 2025-08-26 Price Changed $199,900 MiRealSource-MiMLS
- 2025-08-25 Price Changed $199,900 REALCOMP
- 2025-08-07 Price Changed $210,000 MiRealSource-MiMLS
- 2025-08-06 Price Changed $210,000 REALCOMP
- 2025-08-06 Relisted — REALCOMP
- 2025-08-06 Relisted — MiRealSource-MiMLS
- 2025-07-29 Contingent — REALCOMP
- 2025-07-29 Contingent — MiRealSource-MiMLS
- 2025-07-07 Relisted — REALCOMP
- 2025-07-07 Relisted — MiRealSource-MiMLS
- 2025-06-30 Pending — REALCOMP
- 2025-06-30 Pending — MiRealSource-MiMLS
- 2025-06-30 Listing Removed — REALCOMP
- 2025-06-01 Price Changed $215,000 MiRealSource-MiMLS
- 2025-06-01 Price Changed $215,000 REALCOMP
- 2025-05-16 Listed $225,000 REALCOMP
- 2025-05-16 Listed $225,000 MiRealSource-MiMLS
- 2020-07-21 Sold (Public Records) $151,000 Public Records
- 2020-07-13 Sold (MLS) $151,000 MiRealSource-MiMLS
- 2020-07-13 Sold (MLS) $151,000 REALCOMP
- 2020-07-12 Pending — REALCOMP
- 2020-07-12 Pending — MiRealSource-MiMLS
- 2020-05-19 Contingent — REALCOMP
- 2020-05-19 Contingent — MiRealSource-MiMLS
- 2020-03-30 Relisted — REALCOMP
- 2020-03-30 Relisted — MiRealSource-MiMLS
- 2020-03-10 Contingent — REALCOMP
- 2020-03-10 Contingent — MiRealSource-MiMLS
- 2020-03-09 Pending — REALCOMP
- 2020-03-09 Pending — MiRealSource-MiMLS
- 2020-02-24 Contingent — REALCOMP
- 2020-02-24 Contingent — MiRealSource-MiMLS
- 2020-02-24 Pending — MiRealSource-MiMLS
- 2020-01-28 Listed $145,000 MiRealSource-MiMLS
- 2020-01-28 Listed $145,000 REALCOMP
Property tax history
-10.2%/yrLatest (2025): $789 · -71.6% YoY. Source: county tax records.
Cash-flow waterfall
monthlySold comps — $/sqft
last 12 mo · ≤1 miLoading sold comps…