 Duplex
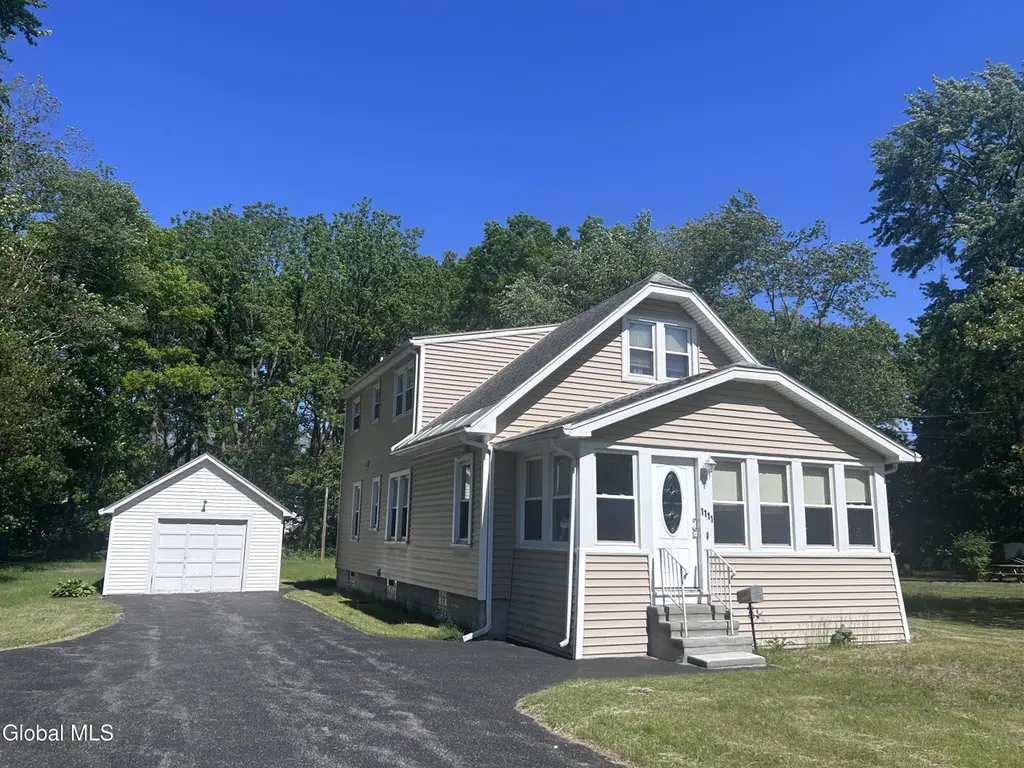
1111 Fort Hunter Rd · Rotterdam, NY
Flood risk 4/10 · Minor
- FEMA flood zone
- X (unshaded)
- Chance of flooding over 30 yrs
- 0.22%
- Est. flood insurance / yr
- $473 – $860
Fire risk 2/10 · Minimal
- Est. fire insurance / yr
- $691 – $1,283
Heat risk 4/10 · Minor
- Hot days now (above 96°F)
- 7 days/yr
- Hot days in 30 yrs
- 16 days/yr
Wind risk 3/10 · Minor
- Chance of severe wind over 30 yrs
- 6.0%
Air-quality risk 1/10 · Minimal
- Unhealthy air days now
- 0 days/yr
- Unhealthy air days in 30 yrs
- 0 days/yr
Risk factors via First Street. Map © Google.
Why this score? — see what drove the D+ grade
The composite is a weighted blend of 9 inputs, each scored 0–100. Each bar is that input's sub-score; the figure is the points it added to the 100-point composite (weight × sub-score).
- Cash flow +23.1/30.0
- DSCR +7.4/10.0
- 1% rule +6.0/10.0
- Schools +4.5/10.0
- Livability +3.9/5.0
- Rent growth +2.5/5.0
- Condition / age +2.5/5.0
- ARV discount +0.0/15.0
- Appreciation +0.0/10.0
$327,900
🖨 Deal sheet (PDF) 📄 Offer letter ✓ Due diligence
Multi-family units
County records classify this as Multi-Family (2-4 Unit). Listing-text estimate: 2 units. confirmed
Listing remarks
Rotterdam two family offering two bedrooms one bath on the first floor. Second floor offers one bedroom one bath with full kitchen and living room. This home sits on almost a half acre with a one car garage. Both units are surprisingly spacious.
Key facts
- 0.49 acre lot
- Garage
- Built 1930
Property features AI
Exterior
- Parking: Off-street paved driveway; 1 garage space (garage); Total of 4 parking spaces
- Utilities: Public water; Septic tank
- Home design: Duplex; 2-unit property
- Construction: Vinyl siding; Asphalt roof
- Exterior features: Enclosed front porch; Other exterior features; Level, landscaped lot
Interior
- Kitchen: Unit 1: 1 kitchen (1st floor); Unit 2: 1 kitchen (2nd floor)
- Bedrooms: Unit 1: 2 bedrooms; Unit 2: 1 bedroom
- Flooring: Hardwood flooring; Laminate flooring
- Bathrooms: 2 full bathrooms (one on the 1st floor, one on the 2nd floor)
- Heating & cooling: Hot water heating; Natural gas heating
- Interior features: Paddle fan; Full basement
- Laundry & utility: Laundry in basement
Neighborhood map
What this means for you Summary
Snapshot
- This is a 2 × 3-bed/1.0-bath units multifamily listed at $328k.
Deal economics
- At list price, monthly cash flow is $586 ($7k/yr) — positive. Per door: $293/mo.
- The deal already cash-flows at list — no discount required.
- Meets the 1% rule at list price ($4k rent vs $328k).
- Recommended offer: $323k (1.5% below list) — sets the bar for market timing.
- Cap rate 8.4% vs local median 3.0% in Rotterdam — top-decile yield for the area; either an underpriced asset or a hidden risk that comps aren't pricing in. Stress-test before assuming the spread holds.
Location & tenants
- Location reads 78/100 on livability (#161 in NY, #2,455 nationally) — a middle-class / working-renter tenant base. Strengths: housing A+, health & safety A+, employment B+; Watch: crime F.
- Rotterdam-Mohonasen Central School District (suburban): math 48% / reading 56% proficiency, ranked #333 of 590 in NY (top 56%) — acceptable for families but not a draw, mixed tenant base, ~2y average lease.
- Zoned schools: Herman L Bradt Elementary School (612 students, 42% FRL); Draper Middle School (math 28% / reading 53%, grade F, #409 of 729 statewide, top 56%, 646 students, 46% FRL); Mohonasen Senior High School (math 94% / reading 75%, grade A, #379 of 1,100 statewide, top 36%, 886 students, 46% FRL) — zoned schools average 45% FRL vs 26% district-wide (19 pts higher); higher-poverty schools than district average — tighter screening recommended.
- Market conditions: 164 active listings in the ZIP; 1 comparable units currently listed for rent nearby; solid renter incomes; 154 units permitted in Schenectady County in 2024 (54 in 5+ unit buildings).
- At $3,623/mo this rent would consume 52% of the median local household income ($84k/yr) (locally 1318% of renters already pay >50% of income on rent) — very limited rent-growth headroom before tenants either downsize or default.
Forward outlook
- Local home prices are declining (-3.0%/yr); year-one equity from $2k of loan paydown is wiped out by about $10k of value loss. Plan a longer hold.
- Schenectady County population projected to shrink 4% by 2050 — rents likely to lag national; underwrite the cash flow, not the appreciation.
Negotiation context
- It's been on market 24 days — a 2% lower offer ($323k) is reasonable based on typical stale-listing flexibility.
Risks & watch-outs
- Watch-outs: built in 1930 — expect roof / HVAC / electrical / plumbing capex.
Questions for the listing agent
- Can we see the unit-by-unit rent roll, current vacancy, and any below-market leases? What's the average tenancy length?
- What capital expenditures (roof, boiler, parking lot, exteriors) have been made in the last 5 years, and what's planned in the next 2?
- Built in 1930 — when were the roof, HVAC, electrical panel, plumbing, and water heater last replaced?
- Is there a deadline driving the sale (1031 exchange, divorce, estate, relocation)? That informs how much negotiation room exists.
- Schools are D-rated, which usually means shorter tenancies and higher turnover. Who's the typical renter profile here, and what's been the actual vacancy rate?
- Crime grade is F in this area — have there been break-ins, vandalism, or insurance claims at this property in the last 3 years? What carrier currently insures it and at what premium?
- The area grade is low — what's the realistic commute time and amenity access for the typical tenant pool here? Any planned neighborhood developments (good or bad) we should know about?
- What's the average days-on-market for RENTAL listings here right now (not sales)? A rising rental-DOM trend means longer vacancies and softer asking-rent achievability than the comps imply.
- What's the recent tenant-quality profile in this submarket — average credit score on applications, eviction rate, late-payment / NSF rate, and stable-employment percentage? A property-management company in the area should have these aggregated.
- How much new apartment / multifamily construction is in the pipeline within 1–3 miles? Heavy new supply (>2% of stock underway) typically softens rents 12–24 months out; light construction supports rent growth.
Investment metrics
- 1% rule
- 1.10% ✓
- Cap rate
- 8.44%
- Cash-on-cash
- 7.66%
- DSCR
- 1.34
- GRM
- 7.5
CMA / ARV
- ARV (on-the-fly)
- $218,652
- Comps found
- 1
Show comp detail 1 sale within ~0.75 mi
| Address | Dist | Beds/Ba | Sqft | Sold | Price | $/sf | Match |
|---|---|---|---|---|---|---|---|
| 2177 Curry Rd | 0.38mi | 3/2.0 | 1,638 (-0%) | 20mo | $217,700 | $133 | 62 |
Match score weights: distance 35% · size 25% · config 20% · recency 20%. Top-matched comps best support the ARV.
Projected returns pro-forma
-3.0% appreciation · 3.0% rent growth · sell at horizon
- IRR
- -4.6%
- Equity multiple
- 0.83×
- Total profit
- $-15,746
- Equity at exit
- $48,891
- IRR
- 5.1%
- Equity multiple
- 1.38×
- Total profit
- $34,599
- Equity at exit
- $28,351
Cash invested: $91,812 (down + closing). Projections, not guarantees.
Landlord ↔ Tenant lean methodology
- Overall (STATE)
- 15 Strongly Tenant-Friendly
- State New York
- 15 Strongly Tenant-Friendly · D+10
- County
- — inherits STATE
- City
- — inherits STATE
ZIP-level market 12303
- Active inventory
- 164
- Price-to-rent
- 15.1×
Monthly cashflow live
- Estimated rent
- $3,623 high interval (Pro) →
- Mortgage (P&I)
- −$1,720
- Tax from tax record
- −$420 /mo · $5,039/yr
- Insurance
- −$137
- HOA
- −$0
- Vacancy / Maint / Mgmt
- −$761
- Net cashflow
- $586
Break-even live
Sensitivity live
| Price | -10% $772 | -5% $679 | +0% $586 | +5% $493 | +10% $400 |
|---|---|---|---|---|---|
| Rent | -10% $300 | -5% $443 | +0% $586 | +5% $729 | +10% $872 |
| Rate | -1.0pp $751 | -0.5pp $669 | base $586 | +0.5pp $501 | +1.0pp $415 |
2-unit breakdown (identical units grouped — click to expand)
| Units | Beds | Baths | Est. rent |
|---|---|---|---|
| 2× units | 3 | 1 | $3,622 |
| #1 | 3 | 1 | $1,811 |
| #2 | 3 | 1 | $1,811 |
| Total (2 units) | $3,623 | ||
UW: 25.0% down · 7.5% · 30yr · 1.5% tax · 5.0% vac · 8.0% maint · 8.0% mgmt
Financing live
Cash to close
- Down payment
- $81,975
- Closing costs
- $9,837
- Reserves months
- —
- Total cash needed
- —
Loan-product check · same deal, 3 products live
Conventional
25% down · 7.5% · 30yr
- Down + closing
- —
- Monthly P&I
- —
- Monthly cashflow
- —
- DSCR
- —
- Eligible?
- —
Personal DTI + credit; lowest rate.
DSCR
20% down · 8.5% · 30yr
- Down + closing
- —
- Monthly P&I
- —
- Monthly cashflow
- —
- DSCR
- —
- Eligible?
- —
No personal income docs; deal must DSCR.
Hard money
10% down · 12.0% · 12mo
- Down + closing
- —
- Monthly P&I
- —
- Monthly cashflow
- —
- DSCR
- —
- Eligible?
- —
Short-term bridge; refi at stabilization.
Rent comps 1 comps
| Address | Beds | Baths | Sqft | Rent | $/sqft | DOM | Units | Dist |
|---|---|---|---|---|---|---|---|---|
| 2971 Hamburg St Schenectady, NY | 3.0 | 2.0 | 1949 | $650 | $0.33 | 25d | 1 | 0.49mi |
Listing history 17 events
-
2026-06-21days on market $327,900 Active 24 DOM
-
2026-06-18days on market $327,900 Active 21 DOM
-
2026-06-17price $327,900 Active 20 DOM
-
2026-06-17days on market $334,900 Active 20 DOM
-
2026-06-16days on market $334,900 Active 19 DOM
-
2026-06-15days on market $334,900 Active 18 DOM
-
2026-06-14days on market $334,900 Active 16 DOM
-
2026-06-10days on market $334,900 Active 13 DOM
-
2026-06-09days on market $334,900 Active 12 DOM
-
2026-06-08days on market $334,900 Active 11 DOM
-
2026-06-07days on market $334,900 Active 10 DOM
-
2026-06-03days on market $334,900 Active 6 DOM
-
2026-06-02days on market $334,900 Active 5 DOM
-
2026-06-01days on market $334,900 Active 4 DOM
-
2026-05-31days on market $334,900 Active 3 DOM
-
2026-05-31days on market $334,900 Active 2 DOM
-
2026-05-28$334,900 Active
ⓘ Source: listings_history table (triggers on properties + properties_extension) + one-shot
backfill from property_details.listing_events for pre-trigger history.
Tax reassessment forecast NY · Partial reset (capped growth)
- Current annual tax
- $5,039 · $420/mo
- Projected year-2 tax
- $5,290 · $441/mo
- Expected delta
- +$251/yr (+$21/mo · 5.0%)
ⓘ Screening estimate from a state-policy table — verify with the county assessor before closing.
Climate risk First Street
- Flood 4/10 Moderate FEMA zone X (unshaded) · 22% chance over 30 yrs
- Wildfire 2/10 Low
- Heat 4/10 Moderate 7 d/yr ≥96°F today · 16 d/yr by 30 yrs out
- Wind 3/10 Moderate 6% chance of damaging wind over 30 yrs
- Air quality 1/10 Low 0 unhealthy d/yr today · 0 by 30 yrs out
Nearby sold comps map
Loading sold comps map…
Walkable amenities ~0.75 mi
Loading nearby amenities…
Taxation est. · year 1
- Rental income
- $43,476
- − Mortgage interest
- −$18,367
- − Property taxes
- −$5,039
- − Insurance
- −$1,640
- − Repairs & maintenance
- −$3,478
- − Management
- −$3,478
- − Depreciation
- −$9,539
- Taxable income
- $1,935
- Est. tax owed @ 24.0%
- −$464
- After-tax cash flow
- $6,568/yr
For passive investors: Depreciation is non-cash, so a rental often shows a tax loss while cash-flowing — sheltering income. Rental losses are passive: they offset passive income freely, and up to $25,000/yr can offset ordinary (W-2) income if you actively participate and your MAGI is under $100k (phasing out to $0 by $150k); unused losses carry forward. On sale, claimed depreciation is recaptured at up to 25%, and gains may owe capital-gains tax (a 1031 exchange can defer both). Figures are a year-1 estimate at your 24.0% rate — not tax advice; consult a CPA.
Schools (NCES district)
- District
- Rotterdam-Mohonasen Central School District
- NCES district ID
- 3600004
- Math proficiency
- 48% ▼ -4.00%
- Reading proficiency
- 56% ▲ 9.00%
- Median HH income
- $59,640
- Composite
- 45.34/100
- National rank
- #2638
- State rank
- #333 of 590 in NY
Livability — Rotterdam
- Score
- 78/100
- State rank
- #161
- US rank
- #2455
Category grades
Schools grade is shown separately in the Schools card above.
Census & demographics
- Census place
- Rotterdam, NY
- County
- Schenectady County · 141,369 people
- Metro
- Albany-Schenectady-Troy, NY
- Population (ZIP)
- 29,360
- Household income
- $84,375
- Rent vs Own
- Severe rent burden
- 1318.0
Population outlook (Schenectady County) Hauer SSP2
- Today (2025)
- 155,046 people
- By 2030
- 154,322 · -0.5%
- By 2040
- 151,796 · -2.1%
- By 2050
- 148,621 · -4.1%
- By 2075
- 141,229 · -8.9%
- By 2100
- 126,014 · -18.7%
Race, ethnicity, and origin ACS 2023
- Neighborhood character
- Predominantly White (66%)
- Race & ethnicity
- White 66% Two or more races 11% Black 10% Hispanic / Latino 9% Asian 4%
- Hispanic origin (detail)
- Mexican 1% Puerto Rican 5%
- Common ancestry
- Romanian 6% Lithuanian 3% Iranian 2%
- Foreign-born
- 10% · Canada, China
- Languages at home
- 90% English-only · Spanish 6% Other Indo-European 2% Chinese 1%
Political lean MEDSL · Schenectady
- 2024 margin
- D (+10.8) · D 55.4% · R 44.6%
- 2008→2024 swing
- -1.8pp toward R · 2008: 12.7pp · 2024: 10.8pp
- All cycles
- 2024: D+10.8 2020: D+15.7 2016: D+5.8 2012: D+15.4 2008: D+12.7
Not yet ingested
- Civics
- —
Market trends
- HPI YoY
- ▼ -151.01%
- Current HPI
- 280.3886
- Rent YoY
- —
- Metro
- Albany-Schenectady-Troy, NY
- State GDP YoY
- ▲ 2.60%
- F500 in state
- 92
Industry mix (Fortune 500 HQ in NY)
| Industry | F500 HQs | Revenue |
|---|---|---|
| Financial Services | 10 | $950B |
|
||
| Consumer Goods | 9 | $162B |
|
||
| Insurance | 4 | $225B |
|
||
| Telecommunications | 2 | $144B |
|
||
| Pharmaceuticals | 2 | $112B |
|
||
| Media / Entertainment | 2 | $69B |
|
||
Price history
1 event — show timeline
- 2026-05-28 Listed $334,900 Global MLS
Property tax history
+0.5%/yrLatest (2025): $5,039 · +1.7% YoY. Source: county tax records.
Cash-flow waterfall
monthlySold comps — $/sqft
last 12 mo · ≤1 miLoading sold comps…