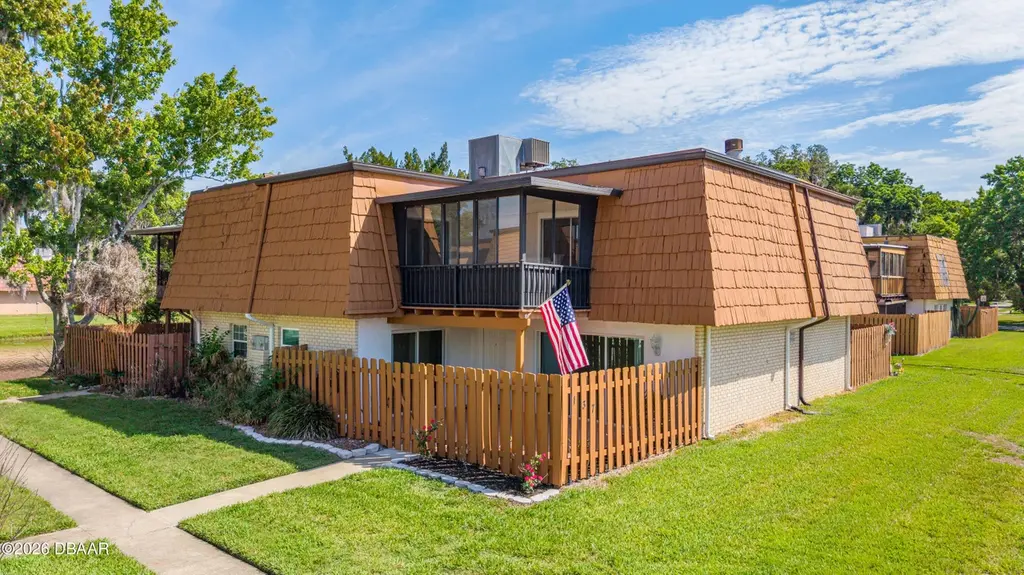
137 Moonstone Ct · Port Orange, FL
Flood risk 6/10 · Moderate
- FEMA flood zone
- X (shaded)
- Chance of flooding over 30 yrs
- 0.71%
- Est. flood insurance / yr
- $507 – $1,088
Fire risk 1/10 · Minimal
- Est. fire insurance / yr
- $947 – $1,759
Heat risk 9/10 · Severe
- Hot days now (above 105°F)
- 7 days/yr
- Hot days in 30 yrs
- 19 days/yr
Wind risk 10/10 · Severe
- Chance of severe wind over 30 yrs
- 99.0%
Air-quality risk 2/10 · Minimal
- Unhealthy air days now
- 1 days/yr
- Unhealthy air days in 30 yrs
- 1 days/yr
Risk factors via First Street. Map © Google.
Why this score? — see what drove the D grade
The composite is a weighted blend of 9 inputs, each scored 0–100. Each bar is that input's sub-score; the figure is the points it added to the 100-point composite (weight × sub-score).
- Cash flow +12.5/30.0
- ARV discount +7.5/15.0
- 1% rule +4.1/10.0
- Livability +4.0/5.0
- Schools +3.9/10.0
- DSCR +3.7/10.0
- Condition / age +2.5/5.0
- Rent growth +1.8/5.0
- Appreciation +0.0/10.0
$189,900
🖨 Deal sheet (PDF) 📄 Offer letter ✓ Due diligence
Listing remarks
BRAND NEW ROOF & GUTTERS! NEWER PORCELAIN TILE THROUGHOUT THE FIRST FLOOR! ENCLOSED SUNROOM! THREE PANEL SLIDING GLASS DOOR IN LIVING ROOM! COVERED PATIO! BOTH BATHROOMS UPDATED W/ TILE! NEW BASEBOARDS UPSTAIRS! MINUTES FROM THE BEACH! Welcome to easy Florida living in this 2 bed, 2 bath Port Orange residence. Enjoy your mornings on the private covered front patio or soak up the sunshine in the enclosed upstairs sunroom filled with natural light. The first floor offers a spacious living area with an expansive 3 panel sliding glass door leading to the patio, dining area, kitchen with beautiful backsplash & its own slider, full bath with upgraded tile shower, and convenient laundr
Key facts
- Brand new roof
- Enclosed sunroom
- Newer porcelain tile
Tags
Property features AI
Finance
- Other: Community in-ground spa/jacuzzi
- HOA & community: Homeowners association with monthly fee of $105; Community amenities include a pool and other community features
Exterior
- Parking: Assigned parking in a parking lot
- Security: Smoke detectors
- Utilities: Public water; Cable available; Electricity available; Sewer available
- Home design: Single family residence (attached); Two levels; Entry level: 1
- Construction: Block, concrete and stucco construction; Shingle and tar/gravel roof; Slab foundation; Built with other materials
- Exterior features: Courtyard; Glass-enclosed patio/porch; Privacy wood fencing; Other exterior features
Interior
- Kitchen: Microwave; Electric range; Dishwasher
- Bedrooms: Total of 4 rooms (includes bedrooms and living spaces)
- Flooring: Carpet; Tile
- Bathrooms: 2 full bathrooms
- Heating & cooling: Central heating; Central air; Ceiling fans
- Interior features: Ceiling fans; His and hers closets; Fireplace; Other interior features
- Laundry & utility: Laundry in unit; Laundry in lower level/basement
Neighborhood map
What this means for you Summary
Snapshot
- This is a 2-bed/2.0-bath single-family listed at $190k.
Deal economics
- At list price, monthly cash flow is $-28 ($-336/yr) — negative.
- To cash-flow at today's rent, offer at most $185k (2.6% below list).
- To meet the 1% rule (rent ≥ 1% of price), the offer needs to be $174k (8.5% below list).
- Recommended offer: $174k (8.5% below list) — sets the bar for 1% rule.
Location & tenants
- Location reads 80/100 on livability (#131 in FL, #1,957 nationally) — a professional / high-income tenant draw. Strengths: housing A+, health & safety A+, cost of living A; Watch: amenities D+, commute D+.
- Volusia (suburban): math 44% / reading 49% proficiency, ranked #47 of 73 in FL (top 64%) — families likely to look elsewhere, expect single-tenant / working-renter base with shorter leases.
- Zoned schools: Sugar Mill Elementary School (math 59% / reading 58%, grade B-, #735 of 2,144 statewide, top 35%, 623 students, 64% FRL); Silver Sands Middle School (math 50% / reading 52%, grade C, #237 of 571 statewide, top 43%, 1,165 students, 54% FRL); Spruce Creek High School (math 37% / reading 61%, grade D, #193 of 667 statewide, top 29%, 2,569 students, 37% FRL) — zoned schools at 52% FRL track the district average.
- Market conditions: Rents soft (-2.7%/yr); 248 active listings in the ZIP; 33 comparable units currently listed for rent nearby; rentals at typical pace (median 23d on market — plan ~3-4 weeks tenant-placement turnaround); 3,402 units permitted in Volusia County in 2024 (681 in 5+ unit buildings).
- This rent runs 31% of the median local income ($68k/yr) — at the standard rent-burdened threshold; future hikes will face affordability resistance.
Forward outlook
- Local home prices are declining (-3.0%/yr); year-one equity from $1k of loan paydown is wiped out by about $6k of value loss. Plan a longer hold.
- Volusia County population projected at +19% by 2050 — long-run rental-demand tailwind backs the buy-and-hold thesis.
Negotiation context
- It's been on market 43 days — a 3% lower offer ($184k) is reasonable based on typical stale-listing flexibility.
- 10 sale attempts since 26y ago with the ask held roughly flat each time — persistent listings suggest the price (not the market) is what's stuck; bring a comps-based counter.
- Current owner paid $80k; list at $190k implies a 136% gain — meaningful room to come down on a strong offer.
Risks & watch-outs
- Climate carrying-cost: major flood risk; severe wind risk, 99% chance of damaging wind over 30y; extreme-heat days projected 7→19/yr by 2055 (HVAC capex compounding) — expect insurance premiums to compound above CPI over the hold.
Questions for the listing agent
- What do current leases actually rent for vs. the listed asking? Can we see a recent rent roll and the last 12 months of T-12 income?
- It's been on market 43 days. Have you received any prior offers? Is the seller open to a 9% concession, seller financing, or rate buy-down credit?
- Built in 1978 — when were the roof, HVAC, electrical panel, plumbing, and water heater last replaced?
- What does the HOA fee cover, when was the last increase, and are there any pending special assessments or reserve-fund shortfalls?
- Is there a deadline driving the sale (1031 exchange, divorce, estate, relocation)? That informs how much negotiation room exists.
- Schools are B-rated — typically a magnet for longer-tenancy family renters. What's the average tenant stay here, and is there a school-zone premium baked into asking?
- The area grade is low — what's the realistic commute time and amenity access for the typical tenant pool here? Any planned neighborhood developments (good or bad) we should know about?
- What's the average days-on-market for RENTAL listings here right now (not sales)? A rising rental-DOM trend means longer vacancies and softer asking-rent achievability than the comps imply.
- What's the recent tenant-quality profile in this submarket — average credit score on applications, eviction rate, late-payment / NSF rate, and stable-employment percentage? A property-management company in the area should have these aggregated.
- How much new for-sale + rental construction is in the pipeline within 1–3 miles? Heavy new supply typically softens prices + rents 12–24 months out; constrained supply supports both.
Investment metrics
- 1% rule
- 0.91% ✗
- Cap rate
- 6.12%
- Cash-on-cash
- -0.63%
- DSCR
- 0.97
- GRM
- 9.1
CMA / ARV
No comps found within radius.
Projected returns pro-forma
-3.0% appreciation · 0.0% rent growth · sell at horizon
- IRR
- -21.0%
- Equity multiple
- 0.29×
- Total profit
- $-37,566
- Equity at exit
- $28,315
- IRR
- -24.1%
- Equity multiple
- -0.02×
- Total profit
- $-54,354
- Equity at exit
- $16,419
Cash invested: $53,172 (down + closing). Projections, not guarantees.
Landlord ↔ Tenant lean methodology
- Overall (STATE)
- 87 Strongly Landlord-Friendly
- State Florida
- 87 Strongly Landlord-Friendly · R+3
- County
- — inherits STATE
- City
- — inherits STATE
ZIP-level market 32129
- Rents YoY
- -2.7%
- Active inventory
- 248
- Price-to-rent
- 9.1×
Monthly cashflow live
- Estimated rent
- $1,737 high interval (Pro) →
- Mortgage (P&I)
- −$996
- Tax from tax record
- −$220 /mo · $2,641/yr
- Insurance
- −$79
- HOA
- −$105
- Vacancy / Maint / Mgmt
- −$365
- Net cashflow
- $-28
Break-even live
Sensitivity live
| Price | -10% $79 | -5% $26 | +0% $-28 | +5% $-82 | +10% $-136 |
|---|---|---|---|---|---|
| Rent | -10% $-165 | -5% $-97 | +0% $-28 | +5% $41 | +10% $109 |
| Rate | -1.0pp $68 | -0.5pp $20 | base $-28 | +0.5pp $-77 | +1.0pp $-127 |
UW: 25.0% down · 7.5% · 30yr · 1.5% tax · 5.0% vac · 8.0% maint · 8.0% mgmt
Financing live
Cash to close
- Down payment
- $47,475
- Closing costs
- $5,697
- Reserves months
- —
- Total cash needed
- —
Loan-product check · same deal, 3 products live
Conventional
25% down · 7.5% · 30yr
- Down + closing
- —
- Monthly P&I
- —
- Monthly cashflow
- —
- DSCR
- —
- Eligible?
- —
Personal DTI + credit; lowest rate.
DSCR
20% down · 8.5% · 30yr
- Down + closing
- —
- Monthly P&I
- —
- Monthly cashflow
- —
- DSCR
- —
- Eligible?
- —
No personal income docs; deal must DSCR.
Hard money
10% down · 12.0% · 12mo
- Down + closing
- —
- Monthly P&I
- —
- Monthly cashflow
- —
- DSCR
- —
- Eligible?
- —
Short-term bridge; refi at stabilization.
Rent comps 33 comps
| Address | Beds | Baths | Sqft | Rent | $/sqft | DOM | Units | Dist |
|---|---|---|---|---|---|---|---|---|
| 190 Moonstone Ct Port Orange, FL | 2.0 | 2.0 | 1400 | $1,650 | $1.18 | 23d | 1 | 0.04mi |
| 104 Moonstone Ct Port Orange, FL | 2.0 | 2.0 | 1400 | $1,950 | $1.39 | 23d | 1 | 0.09mi |
| 86 Springwood Sq Unit 86 Port Orange, FL | 2.0 | 1.5 | 1249 | $1,450 | $1.16 | 23d | 1 | 0.14mi |
| 21 Springwood Sq Unit 23 Port Orange, FL | 2.0 | 1.5 | 1249 | $1,500 | $1.20 | 25d | 1 | 0.21mi |
| 1206 Deer Springs Rd Port Orange, FL | 2.0 | 2.0 | 1064 | $1,625 | $1.53 | 16d | 1 | 0.25mi |
| 3656 Jackson St Unit 1A Port Orange, FL | 2.0 | 1.5 | 1164 | $1,550 | $1.33 | 25d | 1 | 0.26mi |
| 980 Canal View Blvd Port Orange, FL | 2.0 | 1.5 | 1024 | $1,448 | $1.41 | 25d | 2 | 0.45mi |
| 3554 Irish Ln Port Orange, FL | 2.0 | 2.0 | 1470 | $2,000 | $1.36 | 25d | 1 | 0.47mi |
| 1032 W Samms Ave Port Orange, FL | 2.0 | 2.0 | 1176 | $1,650 | $1.40 | 16d | 1 | 0.58mi |
| 1111 Squirrel Nest Ln Port Orange, FL | 2.0 | 2.0 | 1169 | $1,900 | $1.63 | 16d | 1 | 0.66mi |
| 982 Commons Way Port Orange, FL | 3.0 | 2.0 | 1521 | $2,250 | $1.48 | 25d | 1 | 0.72mi |
| 61 Brandy Hills Dr Port Orange, FL | 3.0 | 2.0 | 1192 | $1,895 | $1.59 | 25d | 1 | 0.74mi |
| 488 Autumn Trl Port Orange, FL | 3.0 | 2.0 | 1393 | $1,499 | $1.08 | 25d | 1 | 0.95mi |
| 4211 New Haven Ct Port Orange, FL | 2.0 | 2.0 | 902 | $2,000 | $2.22 | 25d | 1 | 0.96mi |
| 1270 Reed Canal Rd Port Orange, FL | 1.0–3.0 | 1.0–2.0 | 1001 | $1,746 | $1.74 | 13d | 29 | 1.09mi |
| 1154 Ashland Ct Port Orange, FL | 3.0 | 2.0 | 1118 | $1,795 | $1.61 | 16d | 1 | 1.14mi |
| 910 Carey Dr South Daytona, FL | 3.0 | 2.0 | 1529 | $2,500 | $1.64 | 25d | 1 | 1.22mi |
| 3230 S Ridgewood Ave South Daytona, FL | 1.0–3.0 | 1.0–2.0 | 1046 | $1,881 | $1.80 | 13d | 27 | 1.28mi |
| 1200 Floral Springs Blvd Port Orange, FL | 1.0–3.0 | 1.0–2.0 | 1047 | $1,780 | $1.70 | 13d | 81 | 1.29mi |
| 805 Louisville St Unit 2 Port Orange, FL | 2.0 | 2.0 | 1738 | $1,500 | $0.86 | 25d | 1 | 1.32mi |
| 805 Louisville St Unit 7 Port Orange, FL | 2.0 | 2.0 | 1738 | $1,525 | $0.88 | 25d | 1 | 1.32mi |
| 1010 N Swallow Tail Dr Port Orange, FL | 1.0–2.0 | 1.0–2.0 | 893 | $1,574 | $1.76 | 13d | 16 | 1.33mi |
| 3835 Clyde Morris Blvd Port Orange, FL | 1.0–3.0 | 1.0–2.0 | 1013 | $2,012 | $1.99 | 13d | 17 | 1.34mi |
| 1401 Reed Canal Rd Port Orange, FL | 1.0–3.0 | 1.0–2.0 | 1045 | $1,856 | $1.78 | 16d | 25 | 1.34mi |
| 480 Reed Canal Rd #57 South Daytona, FL | 2.0 | 1.5 | 1024 | $1,550 | $1.51 | 25d | 1 | 1.35mi |
| 4514 Alder Dr Port Orange, FL | 3.0 | 2.0 | 1365 | $2,100 | $1.54 | 13d | 1 | 1.35mi |
| 958 Village Trl Port Orange, FL | 1.0–2.0 | 1.0–2.0 | 775 | $1,455 | $1.88 | 13d | 12 | 1.37mi |
| 940 Village Trl Unit 4-306 Port Orange, FL | 2.0 | 2.0 | 1006 | $2,000 | $1.99 | 16d | 1 | 1.40mi |
| 3131 S Ridgewood Ave #203 South Daytona, FL | 2.0 | 2.0 | 1013 | $1,795 | $1.77 | 16d | 1 | 1.42mi |
| 17 Bella Oaks Dr Port Orange, FL | 3.0 | 2.5 | 1624 | $2,150 | $1.32 | 25d | 1 | 1.43mi |
| 53 Bella Oaks Dr Port Orange, FL | 3.0 | 2.5 | 1624 | $2,200 | $1.35 | 25d | 1 | 1.45mi |
| 1063 Wexford Way Port Orange, FL | 3.0 | 2.0 | 1773 | $2,700 | $1.52 | 13d | 1 | 1.49mi |
| 80 Bella Lago Cir Port Orange, FL | 3.0 | 2.5 | 1624 | $2,050 | $1.26 | 25d | 1 | 1.50mi |
HOA detail
- Monthly dues
- $105 · $1,260/yr
Listing history 46 events
-
2026-06-22days on market $189,900 Active 43 DOM
-
2026-06-18days on market $189,900 Active 40 DOM
-
2026-06-17days on market $189,900 Active 39 DOM
-
2026-06-16days on market $189,900 Active 38 DOM
-
2026-06-15days on market $189,900 Active 37 DOM
-
2026-06-14pricedays on market $189,900 Active 35 DOM
-
2026-06-10days on market $197,900 Active 32 DOM
-
2026-06-09days on market $197,900 Active 31 DOM
-
2026-06-08days on market $197,900 Active 30 DOM
-
2026-06-07days on market $197,900 Active 29 DOM
-
2026-06-05days on market $197,900 Active 26 DOM
-
2026-06-03days on market $197,900 Active 25 DOM
-
2026-06-03days on market $197,900 Active 24 DOM
-
2026-06-01days on market $197,900 Active 23 DOM
-
2026-05-31days on market $197,900 Active 22 DOM
-
2026-05-31days on market $197,900 Active 21 DOM
-
2026-05-09$197,900 Active 1079-char remark
-
2026-01-21status Pending
-
2026-01-20historical
-
2025-12-31status Active
-
2025-12-28status Pending
-
2025-10-18price $179,900
-
2025-09-02$184,900 Active
-
2025-04-23historical
-
2025-03-22$194,900 Active
-
2016-12-28soldstatus $80,363
-
2016-12-22soldstatus $80,363 Closed
-
2016-12-22soldstatus $80,363 Closed
-
2016-12-22soldstatus $80,363
-
2016-10-02price $84,900
-
2016-10-02historical Contingent
-
2016-10-02historical Contingent
-
2016-10-01$84,900 Active
-
2016-10-01$184,900 Active
-
2016-10-01$84,900
-
2005-06-28soldstatus $131,900
-
2005-06-17soldstatus $131,900
-
2005-05-18$131,900
-
2002-08-23soldstatus $71,000
-
2002-08-19soldstatus $71,000
-
2002-07-02$72,500
-
2000-03-01soldstatus $55,000
-
2000-02-24soldstatus $55,000
-
2000-01-19$55,000
-
1996-03-05soldstatus $45,000
-
1987-10-01soldstatus $42,900
ⓘ Source: listings_history table (triggers on properties + properties_extension) + one-shot
backfill from property_details.listing_events for pre-trigger history.
Tax reassessment forecast FL · Resets to sale price
- Current annual tax
- $2,641 · $220/mo
- Projected year-2 tax
- $2,641 · $220/mo
- Expected delta
- $0/yr ($0/mo · 0.0%)
ⓘ Screening estimate from a state-policy table — verify with the county assessor before closing.
Climate risk First Street
- Flood 6/10 Major FEMA zone X (shaded) · 71% chance over 30 yrs
- Wildfire 1/10 Low
- Heat 9/10 Extreme 7 d/yr ≥105°F today · 19 d/yr by 30 yrs out
- Wind 10/10 Extreme 99% chance of damaging wind over 30 yrs
- Air quality 2/10 Low 1 unhealthy d/yr today · 1 by 30 yrs out
Nearby sold comps map
Loading sold comps map…
Walkable amenities ~0.75 mi
Loading nearby amenities…
Taxation est. · year 1
- Rental income
- $20,842
- − Mortgage interest
- −$10,637
- − Property taxes
- −$2,641
- − Insurance
- −$950
- − Repairs & maintenance
- −$1,667
- − Management
- −$1,667
- − HOA
- −$1,260
- − Depreciation
- −$5,524
- Taxable loss
- −$3,505
- Est. tax savings @ 24.0%
- +$841
- After-tax cash flow
- $505/yr
For passive investors: Depreciation is non-cash, so a rental often shows a tax loss while cash-flowing — sheltering income. Rental losses are passive: they offset passive income freely, and up to $25,000/yr can offset ordinary (W-2) income if you actively participate and your MAGI is under $100k (phasing out to $0 by $150k); unused losses carry forward. On sale, claimed depreciation is recaptured at up to 25%, and gains may owe capital-gains tax (a 1031 exchange can defer both). Figures are a year-1 estimate at your 24.0% rate — not tax advice; consult a CPA.
Schools (NCES district)
- District
- Volusia
- NCES district ID
- 1201920
- Math proficiency
- 44% ▼ -9.00%
- Reading proficiency
- 49% ▼ -3.00%
- Median HH income
- $42,946
- Composite
- 39.2/100
- National rank
- #4019
- State rank
- #47 of 73 in FL
Livability — Port Orange
- Score
- 80/100
- State rank
- #131
- US rank
- #1957
Category grades
Schools grade is shown separately in the Schools card above.
Census & demographics
- Census place
- Port Orange, FL
- County
- Volusia County · 556,871 people
- City population
- 75,051
- Metro
- Deltona-Daytona Beach-Ormond Beach, FL
- Population (ZIP)
- 23,195
- Household income
- $67,924
- Rent vs Own
- Severe rent burden
- 602.0
Population outlook (Volusia County) Hauer SSP2
- Today (2025)
- 572,749 people
- By 2030
- 598,695 · +4.5%
- By 2040
- 644,880 · +12.6%
- By 2050
- 681,451 · +19.0%
- By 2075
- 759,957 · +32.7%
- By 2100
- 778,902 · +36.0%
Race, ethnicity, and origin ACS 2023
- Neighborhood character
- Predominantly White (80%)
- Race & ethnicity
- White 80% Hispanic / Latino 7% Two or more races 6% Black 6% Asian 3%
- Hispanic origin (detail)
- Mexican 2% Puerto Rican 3%
- Common ancestry
- Lithuanian 4% Iranian 3% Romanian 3%
- Foreign-born
- 9% · Canada, South Korea, China
- Languages at home
- 87% English-only · Spanish 4% German/W. Germanic 3% Arabic 1%
Political lean MEDSL · Volusia
- 2024 margin
- Strong R (+21.8) · D 38.7% · R 60.5%
- 2008→2024 swing
- -27.4pp toward R · 2008: 5.7pp · 2024: -21.8pp
- All cycles
- 2024: R+21.8 2020: R+14.1 2016: R+13.1 2012: R+1.2 2008: D+5.7
Not yet ingested
- Civics
- —
Market trends
- HPI YoY
- ▼ -234.13%
- Current HPI
- 310.0285
- Rent YoY
- ▼ -2.71%
- Metro
- Deltona-Daytona Beach-Ormond Beach, FL
- State GDP YoY
- ▲ 3.28%
- F500 in state
- 36
Industry mix (Fortune 500 HQ in FL)
| Industry | F500 HQs | Revenue |
|---|---|---|
| Industrial Technology | 2 | $29B |
|
||
| Insurance | 2 | $17B |
|
||
| Retail | 1 | $60B |
|
||
| Technology Distribution | 1 | $58B |
|
||
| Homebuilding | 1 | $35B |
|
||
| Technology Manufacturing | 1 | $35B |
|
||
Price history
+342.7% since first listed31 events — show timeline
- 2026-06-11 Price Changed $189,900 Daytona MLS
- 2026-05-09 Listed $197,900 Daytona MLS
- 2026-01-21 Pending — Daytona MLS
- 2026-01-20 Listing Removed — Daytona MLS
- 2025-12-31 Relisted — Daytona MLS
- 2025-12-28 Pending — Daytona MLS
- 2025-10-18 Price Changed $179,900 Daytona MLS
- 2025-09-02 Listed $184,900 Daytona MLS
- 2025-04-23 Listing Removed — Daytona MLS
- 2025-03-22 Listed $194,900 Daytona MLS
- 2016-12-28 Sold (Public Records) $80,363 Public Records
- 2016-12-22 Sold (MLS) $80,363 Stellar MLS as Distributed by MLS Grid
- 2016-12-22 Sold (MLS) $80,363 NSBMLS
- 2016-12-22 Sold (MLS) $80,363 Daytona MLS
- 2016-10-02 Price Changed $84,900 NSBMLS
- 2016-10-02 Contingent — Daytona MLS
- 2016-10-02 Contingent — NSBMLS
- 2016-10-01 Listed $84,900 Daytona MLS
- 2016-10-01 Listed $184,900 NSBMLS
- 2016-10-01 Listed $84,900 Stellar MLS as Distributed by MLS Grid
- 2005-06-28 Sold (Public Records) $131,900 Public Records
- 2005-06-17 Sold (MLS) $131,900 Daytona MLS
- 2005-05-18 Listed $131,900 Daytona MLS
- 2002-08-23 Sold (Public Records) $71,000 Public Records
- 2002-08-19 Sold (MLS) $71,000 Daytona MLS
- 2002-07-02 Listed $72,500 Daytona MLS
- 2000-03-01 Sold (Public Records) $55,000 Public Records
- 2000-02-24 Sold (MLS) $55,000 Daytona MLS
- 2000-01-19 Listed $55,000 Daytona MLS
- 1996-03-05 Sold (Public Records) $45,000 Public Records
- 1987-10-01 Sold (Public Records) $42,900 Public Records
Property tax history
+8.4%/yrLatest (2025): $2,641 · +7.2% YoY. Source: county tax records.
Cash-flow waterfall
monthlySold comps — $/sqft
last 12 mo · ≤1 miLoading sold comps…