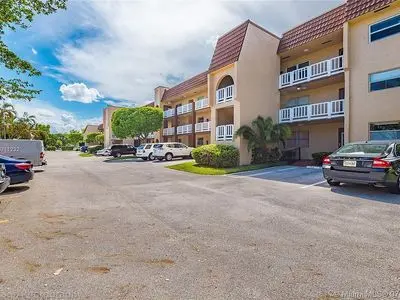
9141 Sunrise Lakes Blvd · Sunrise, FL
Flood risk 1/10 · Minimal
- FEMA flood zone
- X (shaded)
- Chance of flooding over 30 yrs
- 0.0%
- Est. flood insurance / yr
- $507 – $1,088
Fire risk 1/10 · Minimal
- Est. fire insurance / yr
- $947 – $1,759
Heat risk No data
- Hot days now (above threshold)
- —
- Hot days in 30 yrs
- —
Wind risk 10/10 · Severe
- Chance of severe wind over 30 yrs
- 99.0%
Air-quality risk 3/10 · Minor
- Unhealthy air days now
- 2 days/yr
- Unhealthy air days in 30 yrs
- 3 days/yr
Risk factors via First Street. Map © Google.
Why this score? — see what drove the B grade
The composite is a weighted blend of 9 inputs, each scored 0–100. Each bar is that input's sub-score; the figure is the points it added to the 100-point composite (weight × sub-score).
- Cash flow +30.0/30.0
- 1% rule +10.0/10.0
- DSCR +10.0/10.0
- ARV discount +7.5/15.0
- Livability +4.2/5.0
- Schools +4.1/10.0
- Rent growth +2.7/5.0
- Condition / age +2.0/5.0
- Appreciation +0.0/10.0
$95,000
🖨 Deal sheet 📄 Offer letter ✓ Due diligence
Listing remarks
9141 SUNRISE LAKES BLVD #103 SUNRISE FLORIDA 33322 55 AND OVER 1 BEDROOM 1 BATH CONDO FOR SALE- $95,000 MIN. DOWN PAYMENT OF $10,000 OWNER FINANCE 8% INTEREST RATE MONTHLY HOA FEE- $627 PER MONTH INCLUDES WATER AND CABLE SUNRISE LAKES PHASE 3- AMENITIES: CLUB HOUSE WITH RECREATIONAL SPACE, LIBRARY , EVENTS ROOM SWIMMING POOL, JACUZZI, GYM, POND AREA, GRILL SEATING AREA WITH COVERED TIKI HUTS, TENNIS COURT, SHUFFLE BOARD, PICKLE BALL, BILLIARDS, WALKING/JOGGING AREA, LAUUNDRY ROOM, CENRAL AC CONDOMINIUM PROVIDES A & quot; COURTESY BUS& quot; TO LOCAL STOPS AND CLUBHOUSE MONTHLY CALENDER- CONDOMINIUM HOSTS MONTHLY ACTIVITIES OR MORE INFORMATION AND VIEWINGS PLEASE CALL, EM
Key facts
- Swimming pool
- Gym
- Covered tiki huts
Tags
Neighborhood map
What this means for you Summary
Snapshot
- This is a 1-bed/1.0-bath other listed at $95k. Condition is rated fair.
Deal economics
- At list price, monthly cash flow is $733 ($9k/yr) — positive.
- The deal already cash-flows at list — no discount required.
- Meets the 1% rule at list price ($2k rent vs $95k).
- Recommended offer: $92k (3.0% below list) — sets the bar for market timing.
- Cap rate 15.6% vs local median 4.9% in Sunrise — top-decile yield for the area; either an underpriced asset or a hidden risk that comps aren't pricing in. Stress-test before assuming the spread holds.
Location & tenants
- Location reads 83/100 on livability (#56 in FL, #986 nationally) — a professional / high-income tenant draw. Strengths: commute A+, housing A+, health & safety A+; Watch: employment C-, amenities F.
- Broward (suburban): math 42% / reading 53% proficiency, ranked #46 of 73 in FL (top 63%) — families likely to look elsewhere, expect single-tenant / working-renter base with shorter leases.
- Market conditions: Rents flat; 559 active listings in the ZIP; 36 comparable units currently listed for rent nearby; rentals at typical pace (median 24d on market — plan ~3-4 weeks tenant-placement turnaround); 2,111 units permitted in Broward County in 2024 (1,265 in 5+ unit buildings).
Forward outlook
- Local home prices are declining (-3.0%/yr); year-one equity from $657 of loan paydown is wiped out by about $3k of value loss. Plan a longer hold.
- Broward County population projected at +34% by 2050 — long-run rental-demand tailwind backs the buy-and-hold thesis.
- At projected returns (-3.0% appreciation + 0.6% rent growth), your $27k cash investment doubles in ~4 years — after that, you're playing with house money.
Negotiation context
- It's been on market 37 days — a 3% lower offer ($92k) is reasonable based on typical stale-listing flexibility.
Risks & watch-outs
- Climate carrying-cost: severe wind risk, 99% chance of damaging wind over 30y — expect insurance premiums to compound above CPI over the hold.
Questions for the listing agent
- It's been on market 37 days. Have you received any prior offers? Is the seller open to a 3% concession, seller financing, or rate buy-down credit?
- Have any recent inspections been done? Can we get a copy of the seller's disclosures and any deferred-maintenance estimates?
- Built in 1979 — when were the roof, HVAC, electrical panel, plumbing, and water heater last replaced?
- Is there a deadline driving the sale (1031 exchange, divorce, estate, relocation)? That informs how much negotiation room exists.
- What's the average days-on-market for RENTAL listings here right now (not sales)? A rising rental-DOM trend means longer vacancies and softer asking-rent achievability than the comps imply.
- What's the recent tenant-quality profile in this submarket — average credit score on applications, eviction rate, late-payment / NSF rate, and stable-employment percentage? A property-management company in the area should have these aggregated.
- How much new for-sale + rental construction is in the pipeline within 1–3 miles? Heavy new supply typically softens prices + rents 12–24 months out; constrained supply supports both.
Investment metrics
- 1% rule
- 1.85% ✓
- Cap rate
- 15.56%
- Cash-on-cash
- 33.09%
- DSCR
- 2.47
- GRM
- 4.5
CMA / ARV
No comps found within radius.
Projected returns pro-forma
-3.0% appreciation · 0.6% rent growth · sell at horizon
- IRR
- 25.5%
- Equity multiple
- 2.02×
- Total profit
- $27,197
- Equity at exit
- $14,165
- IRR
- 31.7%
- Equity multiple
- 3.55×
- Total profit
- $67,714
- Equity at exit
- $8,214
Cash invested: $26,600 (down + closing). Projections, not guarantees.
Landlord ↔ Tenant lean methodology
- Overall (STATE)
- 87 Strongly Landlord-Friendly
- State Florida
- 87 Strongly Landlord-Friendly · R+3
- County
- — inherits STATE
- City
- — inherits STATE
ZIP-level market 33322
- Home prices YoY
- -33.3%
- Rents YoY
- 0.6%
- Active inventory
- 559
- Price-to-rent
- 4.5×
Monthly cashflow live
- Estimated rent
- $1,759 high interval (Pro) →
- Mortgage (P&I)
- −$498
- Tax est. 1.5%
- −$119 /mo · $1,425/yr
- Insurance
- −$40
- HOA
- −$0
- Vacancy / Maint / Mgmt
- −$369
- Net cashflow
- $733
Break-even live
UW: 25.0% down · 7.5% · 30yr · 1.5% tax · 5.0% vac · 8.0% maint · 8.0% mgmt
Financing live
Cash to close
- Down payment
- $23,750
- Closing costs
- $2,850
- Reserves months
- —
- Total cash needed
- —
Loan-product check · same deal, 3 products live
Conventional
25% down · 7.5% · 30yr
- Down + closing
- —
- Monthly P&I
- —
- Monthly cashflow
- —
- DSCR
- —
- Eligible?
- —
Personal DTI + credit; lowest rate.
DSCR
20% down · 8.5% · 30yr
- Down + closing
- —
- Monthly P&I
- —
- Monthly cashflow
- —
- DSCR
- —
- Eligible?
- —
No personal income docs; deal must DSCR.
Hard money
10% down · 12.0% · 12mo
- Down + closing
- —
- Monthly P&I
- —
- Monthly cashflow
- —
- DSCR
- —
- Eligible?
- —
Short-term bridge; refi at stabilization.
Rent comps 36 comps
| Address | Beds | Baths | Sqft | Rent | $/sqft | DOM | Units | Dist |
|---|---|---|---|---|---|---|---|---|
| 8595 Sunrise Lakes Blvd #207 Sunrise, FL | 1.0 | 1.0 | 640 | $1,700 | $2.66 | 24d | 1 | 0.51mi |
| 8595 Sunrise Lakes Blvd #307 Sunrise, FL | 1.0 | 1.0 | 640 | $1,400 | $2.19 | 1d | 1 | 0.51mi |
| 8590 Sunrise Lakes Blvd #106 Sunrise, FL | 1.0 | 1.0 | 640 | $1,475 | $2.30 | 24d | 1 | 0.51mi |
| 8595 Sunrise Lakes Blvd Sunrise, FL | 1.0 | 1.0 | 640 | $1,550 | $2.42 | 20d | 2 | 0.51mi |
| 9720 NW 24th Pl Unit B Sunrise, FL | 1.0 | 1.0 | 700 | $1,750 | $2.50 | 24d | 1 | 0.60mi |
| 8465 Sunrise Lakes Blvd #106 Sunrise, FL | 1.0 | 1.0 | 640 | $1,450 | $2.27 | 24d | 1 | 0.60mi |
| 8400 Sunrise Lakes Blvd #106 Sunrise, FL | 1.0 | 1.0 | 640 | $1,400 | $2.19 | 24d | 1 | 0.66mi |
| 8400 Sunrise Lakes Blvd #106 Sunrise, FL | 1.0 | 1.0 | 640 | $1,400 | $2.19 | 7d | 1 | 0.66mi |
| 8285 Sunrise Lakes Blvd #208 Sunrise, FL | 1.0 | 1.0 | 640 | $1,400 | $2.19 | 7d | 1 | 0.77mi |
| 8285 Sunrise Lakes Blvd #208 Sunrise, FL | 1.0 | 1.0 | 640 | $1,400 | $2.19 | 24d | 1 | 0.77mi |
| 8798 NW 38th St Sunrise, FL | 1.0–2.0 | 1.0–2.0 | 893 | $1,826 | $2.04 | 7d | 1 | 0.83mi |
| 9968 Nob Hill Ln #9968 Sunrise, FL | 1.0 | 1.0 | 744 | $1,800 | $2.42 | 24d | 1 | 0.88mi |
| 9943 Nob Hill Pl #9943 Sunrise, FL | 1.0 | 1.0 | 744 | $1,875 | $2.52 | 11d | 1 | 0.88mi |
| 9823 Nob Hill Ct #9823 Sunrise, FL | 1.0 | 1.0 | 744 | $1,850 | $2.49 | 12d | 1 | 0.88mi |
| 9934 Nob Hill Pl #9934 Sunrise, FL | 1.0 | 1.0 | 744 | $1,790 | $2.41 | 2d | 1 | 0.88mi |
| 9934 Nob Hill Pl #9934 Sunrise, FL | 1.0 | 1.0 | 744 | $1,850 | $2.49 | 24d | 1 | 0.88mi |
| 8135 Sunrise Lakes Blvd Sunrise, FL | 1.0–2.0 | 1.0–2.0 | 745 | $1,500 | $2.01 | 24d | 2 | 0.89mi |
| 8110 Sunrise Lakes Blvd #307 Sunrise, FL | 1.0 | 1.0 | 640 | $1,500 | $2.34 | 17d | 1 | 0.93mi |
| 8110 Sunrise Lakes Blvd #307 Sunrise, FL | 1.0 | 1.0 | 640 | $1,500 | $2.34 | 2d | 1 | 0.93mi |
| 8100 Sunrise Lakes Blvd Sunrise, FL | 1.0–2.0 | 1.0–2.0 | 745 | $1,380 | $1.85 | 11d | 2 | 0.94mi |
| 3935 NW 87th Ave Sunrise, FL | 1.0 | 1.0 | 595 | $1,600 | $2.69 | 24d | 1 | 0.94mi |
| 4028 NW 87th Ave #4028 Sunrise, FL | 1.0 | 1.0 | 595 | $1,700 | $2.86 | 24d | 1 | 0.95mi |
| 3973 NW 87th Ave #3973 Sunrise, FL | 2.0 | 1.0 | 731 | $1,899 | $2.60 | 24d | 1 | 0.95mi |
| 4072 NW 87th Ave Unit 4072 Sunrise, FL | 1.0 | 1.0 | 595 | $1,690 | $2.84 | 17d | 1 | 0.95mi |
| 8775 NW 39th St #8775 Sunrise, FL | 2.0 | 1.0 | 731 | $1,845 | $2.52 | 14d | 1 | 0.95mi |
| 4071 NW 87th Ave Sunrise, FL | 1.0 | 1.0 | 595 | $1,699 | $2.86 | 24d | 1 | 0.96mi |
| 3968 NW 87th Ave #3968 Sunrise, FL | 1.0 | 1.0 | 595 | $1,625 | $2.73 | 7d | 1 | 0.97mi |
| 3968 NW 87th Ave #3968 Sunrise, FL | 1.0 | 1.0 | 595 | $1,625 | $2.73 | 24d | 1 | 0.97mi |
| 4044 NW 87th Ave #4044 Sunrise, FL | 1.0 | 1.0 | 630 | $1,649 | $2.62 | 24d | 1 | 1.00mi |
| 4096 N Pine Island Rd #2102 Sunrise, FL | 1.0 | 1.0 | 595 | $1,625 | $2.73 | 24d | 1 | 1.02mi |
| 8083-8093 W Oakland Park Blvd Sunrise, FL | 1.0–3.0 | 1.0–2.0 | 1054 | $2,620 | $2.48 | 24d | 37 | 1.11mi |
| 8053 W Oakland Park Blvd Unit 6-307 Sunrise, FL | 1.0 | 1.0 | 727 | $2,618 | $3.60 | 24d | 1 | 1.13mi |
| 8053 W Oakland Park Blvd Unit 1-204 Sunrise, FL | 1.0 | 1.0 | 735 | $2,450 | $3.33 | 24d | 1 | 1.13mi |
| 2347 NW 107th Ave Unit B Sunrise, FL | — | 1.0 | 364 | $1,300 | $3.57 | 24d | 1 | 1.22mi |
| 11135 NW 25th Ct Unit 1 Sunrise, FL | — | 1.0 | 350 | $1,399 | $4.00 | 24d | 1 | 1.44mi |
| 11135 NW 25th Ct Unit 1 Sunrise, FL | — | 1.0 | 350 | $1,000 | $2.86 | 5d | 1 | 1.44mi |
Listing history 13 events
-
2026-06-18days on market $95,000 Active 37 DOM
-
2026-06-17days on market $95,000 Active 36 DOM
-
2026-06-16days on market $95,000 Active 35 DOM
-
2026-06-15days on market $95,000 Active 34 DOM
-
2026-06-13days on market $95,000 Active 32 DOM
-
2026-06-09days on market $95,000 Active 28 DOM
-
2026-06-07days on market $95,000 Active 26 DOM
-
2026-06-04days on market $95,000 Active 23 DOM
-
2026-06-03days on market $95,000 Active 22 DOM
-
2026-06-02days on market $95,000 Active 21 DOM
-
2026-06-01days on market $95,000 Active 20 DOM
-
2026-05-31days on market $95,000 Active 19 DOM
-
2026-05-12$95,000 Active
ⓘ Source: listings_history table (triggers on properties + properties_extension) + one-shot
backfill from property_details.listing_events for pre-trigger history.
Climate risk First Street
- Flood 1/10 Low FEMA zone X (shaded) · 0% chance over 30 yrs
- Wildfire 1/10 Low
- Wind 10/10 Extreme 99% chance of damaging wind over 30 yrs
- Air quality 3/10 Moderate 2 unhealthy d/yr today · 3 by 30 yrs out
Nearby sold comps map
Loading sold comps map…
Walkable amenities ~0.75 mi
Loading nearby amenities…
Taxation est. · year 1
- Rental income
- $21,114
- − Mortgage interest
- −$5,321
- − Property taxes
- −$1,425
- − Insurance
- −$475
- − Repairs & maintenance
- −$1,689
- − Management
- −$1,689
- − Depreciation
- −$2,764
- Taxable income
- $7,750
- Est. tax owed @ 24.0%
- −$1,860
- After-tax cash flow
- $6,941/yr
For passive investors: Depreciation is non-cash, so a rental often shows a tax loss while cash-flowing — sheltering income. Rental losses are passive: they offset passive income freely, and up to $25,000/yr can offset ordinary (W-2) income if you actively participate and your MAGI is under $100k (phasing out to $0 by $150k); unused losses carry forward. On sale, claimed depreciation is recaptured at up to 25%, and gains may owe capital-gains tax (a 1031 exchange can defer both). Figures are a year-1 estimate at your 24.0% rate — not tax advice; consult a CPA.
Condition & rehab AI · 1 photo
This condo is in fair condition with good exterior and interior features. It needs some landscaping and curb appeal improvements to enhance its value.
Value-add opportunities
- Both Landscaping and curb appeal improvements — Enhances the home's curb appeal and can attract more buyers or renters.
- Both Painting interior and exterior — Fresh paint can make the home look more appealing and increase its value.
- Both Landscaping and curb appeal improvements — Enhances the home's curb appeal and can attract more buyers or renters.
Renovation cost estimate screening
Value-add ROI direction
- Both Landscaping and curb appeal improvements — Enhances the home's curb appeal and can attract more buyers or renters. ↑
- Both Painting interior and exterior — Fresh paint can make the home look more appealing and increase its value. ↑
- Both Landscaping and curb appeal improvements — Enhances the home's curb appeal and can attract more buyers or renters. ↑
ⓘ Cost ranges are severity-bucket heuristics (US national rule-of-thumb). Get contractor quotes + a written scope before underwriting a rehab budget.
Schools (NCES district)
- District
- Broward
- NCES district ID
- 1200180
- Math proficiency
- 42% ▼ -18.00%
- Reading proficiency
- 53% ▼ -5.00%
- Median HH income
- $52,139
- Composite
- 40.88/100
- National rank
- #3621
- State rank
- #46 of 73 in FL
Livability — Sunrise
- Score
- 83/100
- State rank
- #56
- US rank
- #986
Category grades
Schools grade is shown separately in the Schools card above.
Census & demographics
- Census place
- Sunrise, FL
- County
- Broward County · 1,963,430 people
- City population
- 77,492
- Metro
- Miami-Fort Lauderdale-Pompano Beach, FL
- Population (ZIP)
- 41,128
- Household income
- $71,755
- Rent vs Own
- Severe rent burden
- 931.0
Population outlook (Broward County) Hauer SSP2
- Today (2025)
- 2,207,033 people
- By 2030
- 2,360,704 · +7.0%
- By 2040
- 2,661,208 · +20.6%
- By 2050
- 2,946,698 · +33.5%
- By 2075
- 3,602,273 · +63.2%
- By 2100
- 3,970,984 · +79.9%
Race, ethnicity, and origin ACS 2023
- Neighborhood character
- Highly diverse neighborhood (Simpson 0.72)
- Race & ethnicity
- Hispanic / Latino 35% White 32% Black 24% Two or more races 22% Asian 4%
- Hispanic origin (detail)
- Puerto Rican 5% Cuban 6% Dominican 2% Salvadoran 1%
- Common ancestry
- Hispanic 5% Romanian 2% Scotch-Irish 2%
- Foreign-born
- 41% · Canada, Jamaica, South Korea
- Languages at home
- 58% English-only · Spanish 30% French/Haitian/Cajun 6% Other Indo-European 1%
Political lean MEDSL · Broward
- 2024 margin
- D (+17.0) · D 58.0% · R 41.0%
- 2008→2024 swing
- -17.8pp toward R · 2008: 34.7pp · 2024: 17.0pp
- All cycles
- 2024: D+17.0 2020: D+29.8 2016: D+35.0 2012: D+34.9 2008: D+34.7
Not yet ingested
- Civics
- —
Market trends
- HPI YoY
- ▼ -203.34%
- Current HPI
- 407.5452
- Rent YoY
- ▲ 0.60%
- Metro
- Miami-Fort Lauderdale-Pompano Beach, FL
- State GDP YoY
- ▲ 3.28%
- F500 in state
- 36
Industry mix (Fortune 500 HQ in FL)
| Industry | F500 HQs | Revenue |
|---|---|---|
| Industrial Technology | 2 | $29B |
|
||
| Insurance | 2 | $17B |
|
||
| Retail | 1 | $60B |
|
||
| Technology Distribution | 1 | $58B |
|
||
| Homebuilding | 1 | $35B |
|
||
| Technology Manufacturing | 1 | $35B |
|
||
Price history
1 event — show timeline
- 2026-05-12 Listed $95,000 FSBO.com
Cash-flow waterfall
monthlySold comps — $/sqft
last 12 mo · ≤1 miLoading sold comps…