 🏷️ Likely Rental
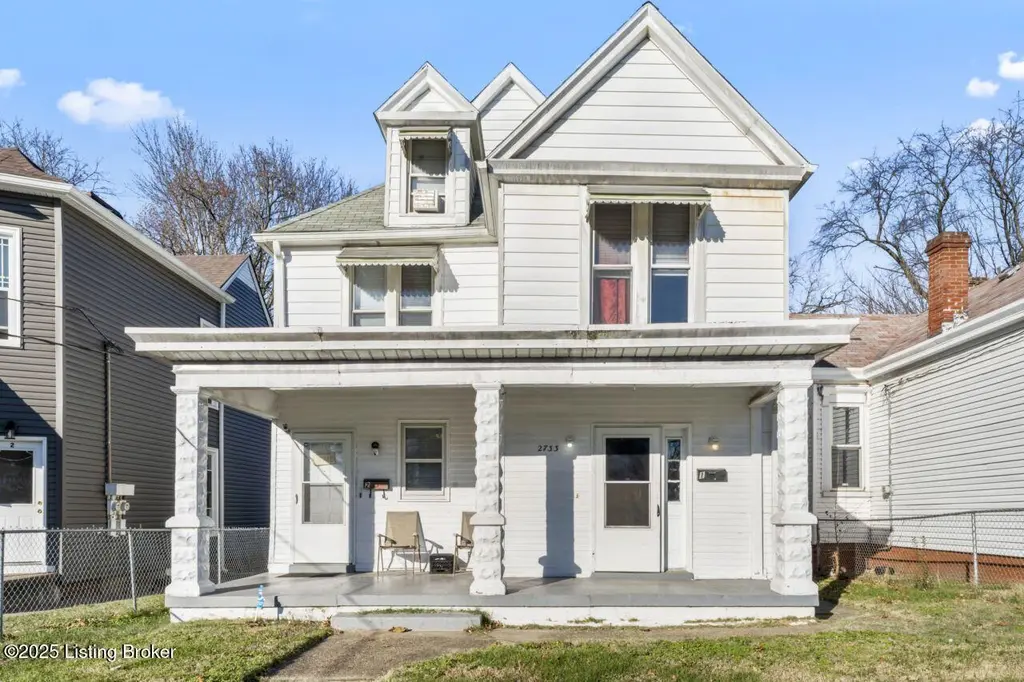
2733 Dumesnil St · Louisville, KY
Flood risk 1/10 · Minimal
- FEMA flood zone
- X (unshaded)
- Chance of flooding over 30 yrs
- 0.0%
- Est. flood insurance / yr
- $473 – $860
Fire risk 1/10 · Minimal
- Est. fire insurance / yr
- $839 – $1,559
Heat risk 5/10 · Moderate
- Hot days now (above 105°F)
- 7 days/yr
- Hot days in 30 yrs
- 19 days/yr
Wind risk 2/10 · Minimal
- Chance of severe wind over 30 yrs
- 1.0%
Air-quality risk 2/10 · Minimal
- Unhealthy air days now
- 1 days/yr
- Unhealthy air days in 30 yrs
- 3 days/yr
Risk factors via First Street. Map © Google.
Why this score? — see what drove the B+ grade
The composite is a weighted blend of 9 inputs, each scored 0–100. Each bar is that input's sub-score; the figure is the points it added to the 100-point composite (weight × sub-score).
- Cash flow +30.0/30.0
- ARV discount +15.0/15.0
- 1% rule +10.0/10.0
- DSCR +10.0/10.0
- Rent growth +3.7/5.0
- Livability +3.2/5.0
- Condition / age +2.5/5.0
- Schools +2.3/10.0
- Appreciation +0.0/10.0
$115,000
🖨 Deal sheet (PDF) 📄 Offer letter ✓ Due diligence
Multi-family units
County records classify this as Multi-Family (2-4 Unit). Listing-text estimate: 2 units. confirmed
Listing remarks
Excellent investment opportunity in Louisville featuring a cash-flowing duplex at 2733 Dumesnil Street bringing in a total of $1,507.05/month in rental income. Unit 1 rents for $750/month and Unit 2 rents for $757.05/month, with Unit 2 recently remodeled with fresh paint, updated flooring, and replaced appliances. This property offers strong value-add potential for investors looking to increase rents and build long-term equity. Conveniently located near downtown, shopping, and major roadways, this duplex is a great addition to any investment portfolio. Unit one is a one bedroom one bathroom that can be converted to a two bedroom. One bathroom and unit two is a two bedroom one bathroom that
Key facts
- Recently remodeled
- Replaced appliances
- Updated flooring
Tags
Property features AI
Finance
- Other: Lot dimensions approximately 35 x 200 (0.16 acre); Building area reported as 1,973; Living area reported as 2,219
- Financial info: First-level unit currently listed with rent of 800.0
- HOA & community: No association fee
Exterior
- Parking: No covered parking
- Utilities: Electricity connected
- Home design: Duplex; Architectural style: Other
- Construction: Built in 1900; Vinyl siding; Other roof
- Exterior features: Balcony
Interior
- Kitchen: Second-level kitchen; First-level kitchen; Second-level range and refrigerator included; First-level range and refrigerator included
- Bedrooms: Total of 3 bedrooms; Second level contains 2 bedrooms; First level contains 1 bedroom
- Bathrooms: One full bath on the second level; One full bath on the first level
- Heating & cooling: Forced air heating with 2 furnaces; Central air conditioning
- Interior features: Separate meters for units; Basement
- Laundry & utility: Tenant pays electric, gas, water, sewer, and cable; owner pays trash removal
Neighborhood map
What this means for you Summary
Snapshot
- This is a 2 × 3-bed/2.0-bath units multifamily listed at $115k.
Deal economics
- At list price, monthly cash flow is $1k ($14k/yr) — positive. Per door: $580/mo.
- The deal already cash-flows at list — no discount required.
- Meets the 1% rule at list price ($2k rent vs $115k).
- Recommended offer: $112k (3.0% below list) — sets the bar for market timing.
- Cap rate 18.4% vs local median 5.0% in Louisville — top-decile yield for the area; either an underpriced asset or a hidden risk that comps aren't pricing in. Stress-test before assuming the spread holds.
Location & tenants
- Location reads 63/100 on livability (#333 in KY) — a middle-class / working-renter tenant base. Strengths: cost of living A+, housing A+; Watch: employment C-, health & safety D+, schools D-.
- Jefferson County (urban): math 19% / reading 35% proficiency, ranked #121 of 165 in KY (top 73%) — low school quality limits family demand, transient renter base, plan for 1-2y turnover.
- Market conditions: Rents rising fast (+4.9%/yr); 144 active listings in the ZIP; 3 comparable units currently listed for rent nearby; rentals at typical pace (median 17d on market — plan ~3-4 weeks tenant-placement turnaround); lower-income renter base — watch delinquency; 2,836 units permitted in Jefferson County in 2024 (1,558 in 5+ unit buildings).
- At $2,426/mo this rent would consume 92% of the median local household income ($32k/yr) (locally 1483% of renters already pay >50% of income on rent) — very limited rent-growth headroom before tenants either downsize or default.
Forward outlook
- Local home prices are declining (-3.0%/yr); year-one equity from $795 of loan paydown is wiped out by about $3k of value loss. Plan a longer hold.
- Jefferson County population projected at +13% by 2050 — modest demand growth; plan on rents tracking national, not racing it.
- At projected returns (-3.0% appreciation + 4.9% rent growth), your $32k cash investment doubles in ~3 years — after that, you're playing with house money.
Negotiation context
- It's been on market 32 days — a 3% lower offer ($112k) is reasonable based on typical stale-listing flexibility.
- 9 sale attempts since 19y ago with the ask held roughly flat each time — persistent listings suggest the price (not the market) is what's stuck; bring a comps-based counter.
- Current owner paid $100k; 15% above their basis — modest negotiation headroom, anchor on the comps not their cost.
Risks & watch-outs
- Watch-outs: built in 1900 — expect roof / HVAC / electrical / plumbing capex.
- Climate carrying-cost: extreme-heat days projected 7→19/yr by 2055 (HVAC capex compounding) — expect insurance premiums to compound above CPI over the hold.
Questions for the listing agent
- It's been on market 32 days. Have you received any prior offers? Is the seller open to a 3% concession, seller financing, or rate buy-down credit?
- Can we see the unit-by-unit rent roll, current vacancy, and any below-market leases? What's the average tenancy length?
- What capital expenditures (roof, boiler, parking lot, exteriors) have been made in the last 5 years, and what's planned in the next 2?
- Built in 1900 — when were the roof, HVAC, electrical panel, plumbing, and water heater last replaced?
- Is there a deadline driving the sale (1031 exchange, divorce, estate, relocation)? That informs how much negotiation room exists.
- Schools are D-rated, which usually means shorter tenancies and higher turnover. Who's the typical renter profile here, and what's been the actual vacancy rate?
- Crime grade is F in this area — have there been break-ins, vandalism, or insurance claims at this property in the last 3 years? What carrier currently insures it and at what premium?
- What's the average days-on-market for RENTAL listings here right now (not sales)? A rising rental-DOM trend means longer vacancies and softer asking-rent achievability than the comps imply.
- What's the recent tenant-quality profile in this submarket — average credit score on applications, eviction rate, late-payment / NSF rate, and stable-employment percentage? A property-management company in the area should have these aggregated.
- How much new apartment / multifamily construction is in the pipeline within 1–3 miles? Heavy new supply (>2% of stock underway) typically softens rents 12–24 months out; light construction supports rent growth.
Investment metrics
- 1% rule
- 2.11% ✓
- Cap rate
- 18.40%
- Cash-on-cash
- 43.25%
- DSCR
- 2.92
- GRM
- 4.0
CMA / ARV
- ARV (on-the-fly)
- $161,987
- Comps found
- 1
Show comp detail 1 sale within ~0.75 mi
| Address | Dist | Beds/Ba | Sqft | Sold | Price | $/sf | Match |
|---|---|---|---|---|---|---|---|
| 1000 S 28th St | 0.45mi | 5/2.5 (-1) | 2,178 (-2%) | 10mo | $160,000 | $73 | 57 |
Match score weights: distance 35% · size 25% · config 20% · recency 20%. Top-matched comps best support the ARV.
Projected returns pro-forma
-3.0% appreciation · 4.87% rent growth · sell at horizon
- IRR
- 42.2%
- Equity multiple
- 2.86×
- Total profit
- $59,943
- Equity at exit
- $17,147
- IRR
- 49.1%
- Equity multiple
- 6.19×
- Total profit
- $167,251
- Equity at exit
- $9,943
Cash invested: $32,200 (down + closing). Projections, not guarantees.
Landlord ↔ Tenant lean methodology
- Overall (STATE)
- 83 Strongly Landlord-Friendly
- State Kentucky
- 83 Strongly Landlord-Friendly · R+16
- County
- — inherits STATE
- City
- — inherits STATE
ZIP-level market 40211
- Home prices YoY
- -33.4%
- Rents YoY
- 4.9%
- Active inventory
- 144
- Price-to-rent
- 7.9×
Monthly cashflow live
- Estimated rent
- $2,426 high interval (Pro) →
- Mortgage (P&I)
- −$603
- Tax from tax record
- −$105 /mo · $1,260/yr
- Insurance
- −$48
- HOA
- −$0
- Vacancy / Maint / Mgmt
- −$509
- Net cashflow
- $1,161
Break-even live
Sensitivity live
| Price | -10% $1,226 | -5% $1,193 | +0% $1,161 | +5% $1,128 | +10% $1,095 |
|---|---|---|---|---|---|
| Rent | -10% $969 | -5% $1,065 | +0% $1,161 | +5% $1,256 | +10% $1,352 |
| Rate | -1.0pp $1,218 | -0.5pp $1,190 | base $1,161 | +0.5pp $1,131 | +1.0pp $1,100 |
2-unit breakdown (identical units grouped — click to expand)
| Units | Beds | Baths | Est. rent |
|---|---|---|---|
| 2× units | 3 | 2 | $2,426 |
| #1 | 3 | 2 | $1,213 |
| #2 | 3 | 2 | $1,213 |
| Total (2 units) | $2,426 | ||
UW: 25.0% down · 7.5% · 30yr · 1.5% tax · 5.0% vac · 8.0% maint · 8.0% mgmt
Financing live
Cash to close
- Down payment
- $28,750
- Closing costs
- $3,450
- Reserves months
- —
- Total cash needed
- —
Loan-product check · same deal, 3 products live
Conventional
25% down · 7.5% · 30yr
- Down + closing
- —
- Monthly P&I
- —
- Monthly cashflow
- —
- DSCR
- —
- Eligible?
- —
Personal DTI + credit; lowest rate.
DSCR
20% down · 8.5% · 30yr
- Down + closing
- —
- Monthly P&I
- —
- Monthly cashflow
- —
- DSCR
- —
- Eligible?
- —
No personal income docs; deal must DSCR.
Hard money
10% down · 12.0% · 12mo
- Down + closing
- —
- Monthly P&I
- —
- Monthly cashflow
- —
- DSCR
- —
- Eligible?
- —
Short-term bridge; refi at stabilization.
Rent comps 3 comps
| Address | Beds | Baths | Sqft | Rent | $/sqft | DOM | Units | Dist |
|---|---|---|---|---|---|---|---|---|
| 858 S 23rd St Louisville, KY | 5.0 | 1.0 | 2228 | $2,100 | $0.94 | 18d | 1 | 0.71mi |
| 3909 W Broadway Louisville, KY | 5.0 | 2.0 | 2000 | $1,745 | $0.87 | 17d | 1 | 1.36mi |
| 4220 Sunset Ave Louisville, KY | 5.0 | 1.5 | 1464 | $1,950 | $1.33 | 2d | 1 | 1.43mi |
Listing history 35 events
-
2026-06-21days on market $115,000 Active 32 DOM
-
2026-06-18remarks 699-char remark
-
2026-06-18days on market $115,000 Active 29 DOM
-
2026-06-17days on market $115,000 Active 28 DOM
-
2026-06-16days on market $115,000 Active 27 DOM
-
2026-06-15days on market $115,000 Active 26 DOM
-
2026-06-13days on market $115,000 Active 24 DOM
-
2026-06-10days on market $115,000 Active 21 DOM
-
2026-06-09days on market $115,000 Active 20 DOM
-
2026-06-08days on market $115,000 Active 19 DOM
-
2026-06-07days on market $115,000 Active 18 DOM
-
2026-06-03days on market $115,000 Active 14 DOM
-
2026-06-02days on market $115,000 Active 13 DOM
-
2026-06-01days on market $115,000 Active 12 DOM
-
2026-05-31days on market $115,000 Active 11 DOM
-
2026-05-20$115,000 Active
-
2026-02-05historical
-
2025-11-11status Active
-
2025-10-29historical Active Under Contract
-
2025-10-23price $120,000
-
2025-07-21status Active
-
2025-06-27historical Active Under Contract
-
2025-06-03$155,900 Active
-
2024-12-09$175,000 Active
-
2024-12-09historical
-
2021-10-15soldstatus $100,000
-
2021-10-12soldstatus $100,000 Closed
-
2021-08-18status Pending
-
2021-08-15$100,000 Active
-
2015-08-28historical
-
2015-04-02$75,000 Active
-
2014-12-31historical
-
2014-10-02$75,000
-
2008-03-30historical
-
2007-09-25$92,500
ⓘ Source: listings_history table (triggers on properties + properties_extension) + one-shot
backfill from property_details.listing_events for pre-trigger history.
Tax reassessment forecast KY · Resets to sale price
- Current annual tax
- $1,260 · $105/mo
- Projected year-2 tax
- $1,260 · $105/mo
- Expected delta
- $0/yr ($0/mo · 0.0%)
ⓘ Screening estimate from a state-policy table — verify with the county assessor before closing.
Climate risk First Street
- Flood 1/10 Low FEMA zone X (unshaded) · 0% chance over 30 yrs
- Wildfire 1/10 Low
- Heat 5/10 Major 7 d/yr ≥105°F today · 19 d/yr by 30 yrs out
- Wind 2/10 Low 100% chance of damaging wind over 30 yrs
- Air quality 2/10 Low 1 unhealthy d/yr today · 3 by 30 yrs out
Nearby sold comps map
Loading sold comps map…
Walkable amenities ~0.75 mi
Loading nearby amenities…
Taxation est. · year 1
- Rental income
- $29,112
- − Mortgage interest
- −$6,442
- − Property taxes
- −$1,260
- − Insurance
- −$575
- − Repairs & maintenance
- −$2,329
- − Management
- −$2,329
- − Depreciation
- −$3,345
- Taxable income
- $12,832
- Est. tax owed @ 24.0%
- −$3,080
- After-tax cash flow
- $10,847/yr
For passive investors: Depreciation is non-cash, so a rental often shows a tax loss while cash-flowing — sheltering income. Rental losses are passive: they offset passive income freely, and up to $25,000/yr can offset ordinary (W-2) income if you actively participate and your MAGI is under $100k (phasing out to $0 by $150k); unused losses carry forward. On sale, claimed depreciation is recaptured at up to 25%, and gains may owe capital-gains tax (a 1031 exchange can defer both). Figures are a year-1 estimate at your 24.0% rate — not tax advice; consult a CPA.
Schools (NCES district)
- District
- Jefferson County
- NCES district ID
- 2102990
- Math proficiency
- 19% ▼ -17.00%
- Reading proficiency
- 35% ▼ -11.00%
- Median HH income
- $47,885
- Composite
- 23.45/100
- National rank
- #7884
- State rank
- #121 of 165 in KY
Livability — Louisville
- Score
- 63/100
- State rank
- #333
- US rank
- #15887
Category grades
Schools grade is shown separately in the Schools card above.
Census & demographics
- Census place
- Louisville, KY
- County
- Jefferson County · 790,184 people
- City population
- 769,292
- Metro
- Louisville/Jefferson County, KY-IN
- Population (ZIP)
- 20,407
- Household income
- $31,749
- Rent vs Own
- Severe rent burden
- 1483.0
Population outlook (Jefferson County) Hauer SSP2
- Today (2025)
- 823,112 people
- By 2030
- 849,343 · +3.2%
- By 2040
- 895,696 · +8.8%
- By 2050
- 933,630 · +13.4%
- By 2075
- 1,028,262 · +24.9%
- By 2100
- 1,072,675 · +30.3%
Race, ethnicity, and origin ACS 2023
- Neighborhood character
- Predominantly Black (90%)
- Race & ethnicity
- Black 90% White 5% Two or more races 4% Hispanic / Latino 1%
- Common ancestry
- Italian 1%
- Foreign-born
- 1% · Canada
- Languages at home
- 98% English-only · Spanish 1%
Political lean MEDSL · Jefferson
- 2024 margin
- D (+16.6) · D 57.4% · R 40.9% · Other 1.7%
- 2008→2024 swing
- +4.5pp toward D · 2008: 12.0pp · 2024: 16.6pp
- All cycles
- 2024: D+16.6 2020: D+20.1 2016: D+13.3 2012: D+11.1 2008: D+12.0
Not yet ingested
- Civics
- —
Market trends
- HPI YoY
- ▼ -88.22%
- Current HPI
- 176.337
- Rent YoY
- ▲ 4.87%
- Metro
- Louisville/Jefferson County, KY-IN
- State GDP YoY
- ▲ 1.81%
- F500 in state
- 4
Industry mix (Fortune 500 HQ in KY)
| Industry | F500 HQs | Revenue |
|---|---|---|
| Healthcare | 1 | $118B |
|
||
| Food / Beverage | 1 | $7B |
|
||
Price history
+24.3% since first listed20 events — show timeline
- 2026-05-20 Listed $115,000 Metro Search MLS
- 2026-02-05 Listing Removed — Metro Search MLS
- 2025-11-11 Relisted — Metro Search MLS
- 2025-10-29 Contingent — Metro Search MLS
- 2025-10-23 Price Changed $120,000 Metro Search MLS
- 2025-07-21 Relisted — Metro Search MLS
- 2025-06-27 Contingent — Metro Search MLS
- 2025-06-03 Listed $155,900 Metro Search MLS
- 2024-12-09 Listing Removed — Metro Search MLS
- 2024-12-09 Listed $175,000 Metro Search MLS
- 2021-10-15 Sold (Public Records) $100,000 Public Records
- 2021-10-12 Sold (MLS) $100,000 Metro Search MLS
- 2021-08-18 Pending — Metro Search MLS
- 2021-08-15 Listed $100,000 Metro Search MLS
- 2015-08-28 Listing Removed — Metro Search MLS
- 2015-04-02 Listed $75,000 Metro Search MLS
- 2014-12-31 Listing Removed — Metro Search MLS
- 2014-10-02 Listed $75,000 Metro Search MLS
- 2008-03-30 Listing Removed — Metro Search MLS
- 2007-09-25 Listed $92,500 Metro Search MLS
Property tax history
+6.2%/yrLatest (2025): $1,260 · -1.9% YoY. Source: county tax records.
Cash-flow waterfall
monthlySold comps — $/sqft
last 12 mo · ≤1 miLoading sold comps…