 🔨 Auction
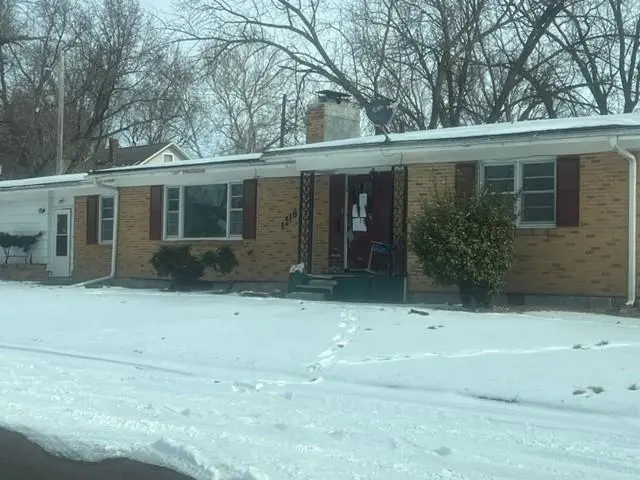
1216 Maple Ln · Sedalia, MO
Flood risk 1/10 · Minimal
- FEMA flood zone
- X (unshaded)
- Chance of flooding over 30 yrs
- 0.0%
- Est. flood insurance / yr
- $473 – $860
Fire risk 2/10 · Minimal
- Est. fire insurance / yr
- $1,054 – $1,958
Heat risk 4/10 · Minor
- Hot days now (above 106°F)
- 7 days/yr
- Hot days in 30 yrs
- 18 days/yr
Wind risk 2/10 · Minimal
- Chance of severe wind over 30 yrs
- —
Air-quality risk 2/10 · Minimal
- Unhealthy air days now
- 0 days/yr
- Unhealthy air days in 30 yrs
- 1 days/yr
Risk factors via First Street. Map © Google.
Why this score? — see what drove the D grade
The composite is a weighted blend of 9 inputs, each scored 0–100. Each bar is that input's sub-score; the figure is the points it added to the 100-point composite (weight × sub-score).
- Cash flow +13.5/30.0
- ARV discount +7.5/15.0
- DSCR +4.1/10.0
- Schools +3.9/10.0
- Livability +3.6/5.0
- 1% rule +3.0/10.0
- Rent growth +2.5/5.0
- Condition / age +2.5/5.0
- Appreciation +0.0/10.0
$44,900
🖨 Deal sheet 📄 Offer letter ✓ Due diligence
Listing remarks MLS
Welcome to this spacious 3-bedroom, 2-bath home offering approximately 1,854 square feet of comfortable living space. This classic brick ranch features a welcoming front porch and large picture window that fills the home with natural light. AUCTION, AS IS.
Key facts
- 7,057 sq ft lot
- 2 garage spots
- Built 1959
Neighborhood map
What this means for you Summary
Snapshot
- This is a 3-bed/2.0-bath single-family listed at $45k.
Deal economics
- At list price, monthly cash flow is $5 ($60/yr) — positive.
- The deal already cash-flows at list — no discount required.
- Meets the 1% rule at list price ($1k rent vs $45k).
- Recommended offer: $44k (3.0% below list) — sets the bar for market timing.
- Cap rate 6.3% vs local median 4.3% in Sedalia — top-decile yield for the area; either an underpriced asset or a hidden risk that comps aren't pricing in. Stress-test before assuming the spread holds.
Location & tenants
- Location reads 71/100 on livability (#107 in MO) — a middle-class / working-renter tenant base. Strengths: cost of living A+, housing A+, health & safety A+; Watch: amenities D, crime F, commute F.
- Sedalia 200 (town): math 47% / reading 46% proficiency, ranked #89 of 324 in MO (top 28%) — families likely to look elsewhere, expect single-tenant / working-renter base with shorter leases.
- Market conditions: 213 active listings in the ZIP; 109 units permitted in Pettis County in 2024 (46 in 5+ unit buildings).
Forward outlook
- Local home prices are declining (-3.0%/yr); year-one equity from $1k of loan paydown is wiped out by about $5k of value loss. Plan a longer hold.
- Pettis County population projected to shrink 7% by 2050 — rents likely to lag national; underwrite the cash flow, not the appreciation.
Negotiation context
- It's been on market 58 days — a 3% lower offer ($44k) is reasonable based on typical stale-listing flexibility.
- 3 sale attempts; this cycle's ask has dropped $13k (23%) from the opening price — seller is motivated, your offer sets the floor, not the list.
Risks & watch-outs
- Watch-outs: property tax is 2.9% of price; built in 1959 — expect roof / HVAC / electrical / plumbing capex.
Questions for the listing agent
- It's been on market 58 days. Have you received any prior offers? Is the seller open to a 3% concession, seller financing, or rate buy-down credit?
- Built in 1959 — when were the roof, HVAC, electrical panel, plumbing, and water heater last replaced?
- Property tax is high relative to price — has the assessment been appealed recently, and will the sale trigger a re-assessment?
- Is there a deadline driving the sale (1031 exchange, divorce, estate, relocation)? That informs how much negotiation room exists.
- Crime grade is F in this area — have there been break-ins, vandalism, or insurance claims at this property in the last 3 years? What carrier currently insures it and at what premium?
- The area grade is low — what's the realistic commute time and amenity access for the typical tenant pool here? Any planned neighborhood developments (good or bad) we should know about?
- What's the average days-on-market for RENTAL listings here right now (not sales)? A rising rental-DOM trend means longer vacancies and softer asking-rent achievability than the comps imply.
- What's the recent tenant-quality profile in this submarket — average credit score on applications, eviction rate, late-payment / NSF rate, and stable-employment percentage? A property-management company in the area should have these aggregated.
- How much new for-sale + rental construction is in the pipeline within 1–3 miles? Heavy new supply typically softens prices + rents 12–24 months out; constrained supply supports both.
Investment metrics
- 1% rule
- 0.80% ✗
- Cap rate
- 6.33%
- Cash-on-cash
- 0.12%
- DSCR
- 1.01
- GRM
- 10.4
CMA / ARV
- ARV (median comp)
- $171,940
- List price
- $44,900
- Delta
- -73.89%
- Verdict
- UNDERPRICED
- Comps
- 20 within 1.0 mi
Show comp detail 4 sales within ~0.75 mi
| Address | Dist | Beds/Ba | Sqft | Sold | Price | $/sf | Match |
|---|---|---|---|---|---|---|---|
| 1406 W Broadway Blvd | 0.11mi | 4/3.0 (+1) | 2,692 (-4%) | 2mo | $116,000 | $43 | 78 |
| 1101 W Broadway Blvd | 0.18mi | 4/2.0 (+1) | 2,620 (-6%) | 4mo | $150,000 | $57 | 73 |
| 519 W Broadway Blvd | 0.48mi | 4/1.5 (+1) | 2,466 (-12%) | 2mo | $130,000 | $53 | 49 |
| 1406 S Warren Ave | 0.54mi | 4/2.5 (+1) | 2,580 (-8%) | 8mo | $265,000 | $103 | 49 |
Match score weights: distance 35% · size 25% · config 20% · recency 20%. Top-matched comps best support the ARV.
Projected returns pro-forma
-3.0% appreciation · 3.0% rent growth · sell at horizon
- IRR
- -16.1%
- Equity multiple
- 0.43×
- Total profit
- $-27,588
- Equity at exit
- $25,637
- IRR
- -7.9%
- Equity multiple
- 0.51×
- Total profit
- $-23,793
- Equity at exit
- $14,866
Cash invested: $48,143 (down + closing). Projections, not guarantees.
Landlord ↔ Tenant lean methodology
- Overall (STATE)
- 81 Strongly Landlord-Friendly
- State Missouri
- 81 Strongly Landlord-Friendly · R+10
- County
- — inherits STATE
- City
- — inherits STATE
ZIP-level market 65301
- Home prices YoY
- -21.8%
- Active inventory
- 213
- Price-to-rent
- 2.7×
Monthly cashflow live
- Estimated rent
- $1,377 medium interval (Pro) →
- Mortgage (P&I)
- −$902
- Tax from tax record
- −$110 /mo · $1,314/yr
- Insurance
- −$72
- HOA
- −$0
- Vacancy / Maint / Mgmt
- −$289
- Net cashflow
- $5
Break-even live
UW: 25.0% down · 7.5% · 30yr · 1.5% tax · 5.0% vac · 8.0% maint · 8.0% mgmt
Financing live
Cash to close
- Down payment
- $42,985
- Closing costs
- $5,158
- Reserves months
- —
- Total cash needed
- —
Loan-product check · same deal, 3 products live
Conventional
25% down · 7.5% · 30yr
- Down + closing
- —
- Monthly P&I
- —
- Monthly cashflow
- —
- DSCR
- —
- Eligible?
- —
Personal DTI + credit; lowest rate.
DSCR
20% down · 8.5% · 30yr
- Down + closing
- —
- Monthly P&I
- —
- Monthly cashflow
- —
- DSCR
- —
- Eligible?
- —
No personal income docs; deal must DSCR.
Hard money
10% down · 12.0% · 12mo
- Down + closing
- —
- Monthly P&I
- —
- Monthly cashflow
- —
- DSCR
- —
- Eligible?
- —
Short-term bridge; refi at stabilization.
Listing history 11 events
-
2026-05-07status Pending 256-char remark
Show marketing remark (256 chars)
Welcome to this spacious 3-bedroom, 2-bath home offering approximately 1,854 square feet of comfortable living space. This classic brick ranch features a welcoming front porch and large picture window that fills the home with natural light. AUCTION, AS IS.
-
2026-04-24price $44,900 256-char remark
Show marketing remark (256 chars)
Welcome to this spacious 3-bedroom, 2-bath home offering approximately 1,854 square feet of comfortable living space. This classic brick ranch features a welcoming front porch and large picture window that fills the home with natural light. AUCTION, AS IS.
-
2026-04-03price $49,100 256-char remark
Show marketing remark (256 chars)
Welcome to this spacious 3-bedroom, 2-bath home offering approximately 1,854 square feet of comfortable living space. This classic brick ranch features a welcoming front porch and large picture window that fills the home with natural light. AUCTION, AS IS.
-
2026-03-13status Active 256-char remark
Show marketing remark (256 chars)
Welcome to this spacious 3-bedroom, 2-bath home offering approximately 1,854 square feet of comfortable living space. This classic brick ranch features a welcoming front porch and large picture window that fills the home with natural light. AUCTION, AS IS.
-
2026-03-13price $53,900 256-char remark
Show marketing remark (256 chars)
Welcome to this spacious 3-bedroom, 2-bath home offering approximately 1,854 square feet of comfortable living space. This classic brick ranch features a welcoming front porch and large picture window that fills the home with natural light. AUCTION, AS IS.
-
2026-02-28historical 256-char remark
Show marketing remark (256 chars)
Welcome to this spacious 3-bedroom, 2-bath home offering approximately 1,854 square feet of comfortable living space. This classic brick ranch features a welcoming front porch and large picture window that fills the home with natural light. AUCTION, AS IS.
-
2026-02-24$58,300 Active 256-char remark
Show marketing remark (256 chars)
Welcome to this spacious 3-bedroom, 2-bath home offering approximately 1,854 square feet of comfortable living space. This classic brick ranch features a welcoming front porch and large picture window that fills the home with natural light. AUCTION, AS IS.
-
2026-01-09$116,600 Active
-
1997-04-17soldstatus
-
1997-04-02soldstatus
-
1987-01-08soldstatus
ⓘ Source: listings_history table (triggers on properties + properties_extension) + one-shot
backfill from property_details.listing_events for pre-trigger history.
Tax reassessment forecast MO · Resets to sale price
- Current annual tax
- $1,314 · $110/mo
- Projected year-2 tax
- $1,314 · $110/mo
- Expected delta
- $0/yr ($0/mo · 0.0%)
ⓘ Screening estimate from a state-policy table — verify with the county assessor before closing.
Climate risk First Street
- Flood 1/10 Low FEMA zone X (unshaded) · 0% chance over 30 yrs
- Wildfire 2/10 Low
- Heat 4/10 Moderate 7 d/yr ≥106°F today · 18 d/yr by 30 yrs out
- Wind 2/10 Low
- Air quality 2/10 Low 0 unhealthy d/yr today · 1 by 30 yrs out
Nearby sold comps map
Loading sold comps map…
Walkable amenities ~0.75 mi
Loading nearby amenities…
Taxation est. · year 1
- Rental income
- $16,524
- − Mortgage interest
- −$9,631
- − Property taxes
- −$1,314
- − Insurance
- −$860
- − Repairs & maintenance
- −$1,322
- − Management
- −$1,322
- − Depreciation
- −$5,002
- Taxable loss
- −$2,927
- Est. tax savings @ 24.0%
- +$702
- After-tax cash flow
- $762/yr
For passive investors: Depreciation is non-cash, so a rental often shows a tax loss while cash-flowing — sheltering income. Rental losses are passive: they offset passive income freely, and up to $25,000/yr can offset ordinary (W-2) income if you actively participate and your MAGI is under $100k (phasing out to $0 by $150k); unused losses carry forward. On sale, claimed depreciation is recaptured at up to 25%, and gains may owe capital-gains tax (a 1031 exchange can defer both). Figures are a year-1 estimate at your 24.0% rate — not tax advice; consult a CPA.
Schools (NCES district)
- District
- Sedalia 200
- NCES district ID
- 2927830
- Math proficiency
- 47% ▼ -1.00%
- Reading proficiency
- 46% ▼ -3.00%
- Median HH income
- $37,452
- Composite
- 38.7/100
- National rank
- #4141
- State rank
- #89 of 324 in MO
Livability — Sedalia
- Score
- 71/100
- State rank
- #107
- US rank
- #6990
Category grades
Schools grade is shown separately in the Schools card above.
Census & demographics
- Census place
- Sedalia, MO
- County
- Pettis County · 35,091 people
- City population
- 35,091
- Metro
- Sedalia, MO
- Population (ZIP)
- 35,091
- Household income
- $58,064
- Rent vs Own
- Severe rent burden
- 1021.0
Population outlook (Pettis County) Hauer SSP2
- Today (2025)
- 41,992 people
- By 2030
- 41,584 · -1.0%
- By 2040
- 40,483 · -3.6%
- By 2050
- 39,049 · -7.0%
- By 2075
- 35,413 · -15.7%
- By 2100
- 30,870 · -26.5%
Race, ethnicity, and origin ACS 2023
- Neighborhood character
- Predominantly White (81%)
- Race & ethnicity
- White 81% Hispanic / Latino 10% Two or more races 7% Black 3%
- Hispanic origin (detail)
- Mexican 8%
- Common ancestry
- Subsaharan African 3% Lithuanian 2% Italian 1%
- Foreign-born
- 7% · Canada
- Languages at home
- 87% English-only · Spanish 7% Russian/Polish/Slavic 4% German/W. Germanic 1%
Political lean MEDSL · Pettis
- 2024 margin
- Solid R (+48.8) · D 24.9% · R 73.7% · Other 1.4%
- 2008→2024 swing
- -26.3pp toward R · 2008: -22.4pp · 2024: -48.8pp
- All cycles
- 2024: R+48.8 2020: R+47.5 2016: R+46.9 2012: R+28.8 2008: R+22.4
Not yet ingested
- Civics
- —
Market trends
- HPI YoY
- ▼ -81.80%
- Current HPI
- 292.8224
- Rent YoY
- —
- Metro
- Sedalia, MO
- State GDP YoY
- ▲ 1.84%
- F500 in state
- 20
Industry mix (Fortune 500 HQ in MO)
| Industry | F500 HQs | Revenue |
|---|---|---|
| Healthcare | 1 | $163B |
|
||
| Insurance | 1 | $21B |
|
||
| Industrial Technology | 1 | $17B |
|
||
| Retail | 1 | $16B |
|
||
| Industrial Distribution | 1 | $10B |
|
||
| Utilities | 1 | $9B |
|
||
Price history
-61.5% since first listed11 events — show timeline
- 2026-05-07 Pending — Heartland MLS as Distributed by MLS Grid
- 2026-04-24 Price Changed $44,900 Heartland MLS as Distributed by MLS Grid
- 2026-04-03 Price Changed $49,100 Heartland MLS as Distributed by MLS Grid
- 2026-03-13 Relisted — Heartland MLS as Distributed by MLS Grid
- 2026-03-13 Price Changed $53,900 Heartland MLS as Distributed by MLS Grid
- 2026-02-28 Listing Removed — Heartland MLS as Distributed by MLS Grid
- 2026-02-24 Listed $58,300 Heartland MLS as Distributed by MLS Grid
- 2026-01-09 Listed $116,600 MARIS as Distributed by MLS Grid
- 1997-04-17 Sold (Public Records) — Public Records
- 1997-04-02 Sold (Public Records) — Public Records
- 1987-01-08 Sold (Public Records) — Public Records
Property tax history
+1.2%/yrLatest (2025): $1,314 · +11.4% YoY. Source: county tax records.
Cash-flow waterfall
monthlySold comps — $/sqft
last 12 mo · ≤1 miLoading sold comps…