14694 State Route 821 Unit 10F-4 · Kittitas, WA
Flood risk 1/10 · Minimal
- FEMA flood zone
- A
- Chance of flooding over 30 yrs
- 0.0%
- Est. flood insurance / yr
- $1,009 – $1,996
Fire risk 7/10 · Major
- Est. fire insurance / yr
- $604 – $1,122
Heat risk 4/10 · Minor
- Hot days now (above 93°F)
- 7 days/yr
- Hot days in 30 yrs
- 15 days/yr
Wind risk 1/10 · Minimal
- Chance of severe wind over 30 yrs
- —
Air-quality risk 9/10 · Severe
- Unhealthy air days now
- 18 days/yr
- Unhealthy air days in 30 yrs
- 18 days/yr
Risk factors via First Street. Map © Google.
Why this score? — see what drove the D+ grade
The composite is a weighted blend of 9 inputs, each scored 0–100. Each bar is that input's sub-score; the figure is the points it added to the 100-point composite (weight × sub-score).
- Cash flow +12.0/30.0
- 1% rule +10.0/10.0
- ARV discount +8.9/15.0
- Condition / age +4.8/5.0
- Schools +4.5/10.0
- DSCR +3.5/10.0
- Livability +3.3/5.0
- Rent growth +2.6/5.0
- Appreciation +0.0/10.0
$99,000
🖨 Deal sheet 📄 Offer letter ✓ Due diligence
Listing remarks
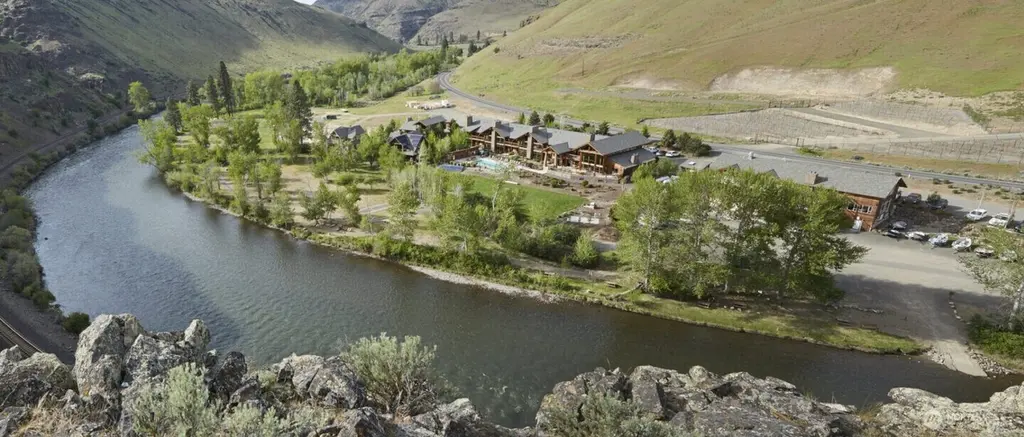
Enjoy canyon living with this 1/6 fractional ownership opportunity at The Lodge at Canyon River Ranch, offering 56 nights of use each year in a beautiful Yakima River setting. This luxury lodge condominium provides the perfect balance of relaxation, recreation, and low-maintenance ownership. The well-appointed 2-bedroom, 1.5-bath condo features a full kitchen, inviting living area with a cozy gas fireplace, and a private balcony or patio overlooking the Yakima River—an ideal place to unwind and enjoy the peaceful surroundings. Spend your days experiencing renowned fly fishing on the Yakima River, floating the river, hiking nearby trails, or simply relaxing at the lodge. Conveniently l
Key facts
- Outdoor pool
- Yakima river setting
- Full kitchen
Tags
Neighborhood map
What this means for you Summary
Snapshot
- This is a 2-bed/1.5-bath single-family listed at $99k. Condition is rated excellent.
Deal economics
- At list price, monthly cash flow is $-149 ($-2k/yr) — negative.
- To cash-flow at today's rent, offer at most $77k (21.7% below list).
- Meets the 1% rule at list price ($1k rent vs $99k).
- Recommended offer: $77k (21.7% below list) — sets the bar for cash-flow.
- Cap rate 6.0% vs local median 2.1% in Kittitas — top-decile yield for the area; either an underpriced asset or a hidden risk that comps aren't pricing in. Stress-test before assuming the spread holds.
Location & tenants
- Location reads 66/100 on livability (#321 in WA) — a middle-class / working-renter tenant base. Strengths: housing A+, crime A, cost of living A-; Watch: schools C-, health & safety C-, amenities F.
- Ellensburg School District (town): math 47% / reading 55% proficiency, ranked #148 of 291 in WA (top 51%) — acceptable for families but not a draw, mixed tenant base, ~2y average lease.
- Market conditions: Rents flat; 302 active listings in the ZIP; 433 units permitted in Kittitas County in 2024 (23 in 5+ unit buildings).
Forward outlook
- Local home prices are declining (-3.0%/yr); year-one equity from $684 of loan paydown is wiped out by about $3k of value loss. Plan a longer hold.
- Kittitas County population projected at +30% by 2050 — long-run rental-demand tailwind backs the buy-and-hold thesis.
Negotiation context
- It's been on market 102 days — a 9% lower offer ($90k) is reasonable based on typical stale-listing flexibility.
- 3 sale attempts since 5y ago with the ask held roughly flat each time — persistent listings suggest the price (not the market) is what's stuck; bring a comps-based counter.
Risks & watch-outs
- Watch-outs: flood insurance adds $125/mo; HOA is 34% of rent.
- Climate carrying-cost: in FEMA flood zone A (mandatory federal flood insurance); major wildfire risk — expect insurance premiums to compound above CPI over the hold.
Questions for the listing agent
- What do current leases actually rent for vs. the listed asking? Can we see a recent rent roll and the last 12 months of T-12 income?
- It's been on market 102 days. Have you received any prior offers? Is the seller open to a 22% concession, seller financing, or rate buy-down credit?
- What's the actual annual flood-insurance premium (NFIP or private), and is the property in a SFHA with mandatory coverage?
- What does the HOA fee cover, when was the last increase, and are there any pending special assessments or reserve-fund shortfalls?
- Why hasn't it sold? Are there any deal-killer items the seller is aware of (foundation, flood, title, zoning, code violations)?
- Is there a deadline driving the sale (1031 exchange, divorce, estate, relocation)? That informs how much negotiation room exists.
- The area grade is low — what's the realistic commute time and amenity access for the typical tenant pool here? Any planned neighborhood developments (good or bad) we should know about?
- What's the average days-on-market for RENTAL listings here right now (not sales)? A rising rental-DOM trend means longer vacancies and softer asking-rent achievability than the comps imply.
- What's the recent tenant-quality profile in this submarket — average credit score on applications, eviction rate, late-payment / NSF rate, and stable-employment percentage? A property-management company in the area should have these aggregated.
- How much new for-sale + rental construction is in the pipeline within 1–3 miles? Heavy new supply typically softens prices + rents 12–24 months out; constrained supply supports both.
Investment metrics
- 1% rule
- 1.50% ✓
- Cap rate
- 6.01%
- Cash-on-cash
- -1.02%
- DSCR
- 0.95
- GRM
- 5.6
CMA / ARV
- ARV (median comp)
- $102,099
- List price
- $99,000
- Delta
- -3.04%
- Verdict
- FAIR
- Comps
- 3 within 1.0 mi
Show comp detail 1 sale within ~0.75 mi
| Address | Dist | Beds/Ba | Sqft | Sold | Price | $/sf | Match |
|---|---|---|---|---|---|---|---|
| 14694 State Route 821 Unit 10F-6 | 0.10mi | 2/1.5 | 821 (0%) | 1mo | $112,500 | $137 | 95 |
Match score weights: distance 35% · size 25% · config 20% · recency 20%. Top-matched comps best support the ARV.
Projected returns pro-forma
-3.0% appreciation · 0.57% rent growth · sell at horizon
- IRR
- -32.9%
- Equity multiple
- -0.03×
- Total profit
- $-28,640
- Equity at exit
- $14,761
- IRR
- -81.1%
- Equity multiple
- -0.78×
- Total profit
- $-49,287
- Equity at exit
- $8,560
Cash invested: $27,720 (down + closing). Projections, not guarantees.
Landlord ↔ Tenant lean methodology
- Overall (STATE)
- 28 Tenant-Leaning
- State Washington
- 28 Tenant-Leaning · D+8
- County
- — inherits STATE
- City
- — inherits STATE
ZIP-level market 98926
- Rents YoY
- 0.6%
- Active inventory
- 302
- Price-to-rent
- 5.6×
Monthly cashflow live
- Estimated rent
- $1,482 medium interval (Pro) →
- Mortgage (P&I)
- −$519
- Tax est. 1.5%
- −$124 /mo · $1,485/yr
- Insurance
- −$41
- Flood insurance flood zone
- −$125 /mo · $1,502/yr
- HOA
- −$510
- Vacancy / Maint / Mgmt
- −$311
- Net cashflow
- $-149
Break-even live
UW: 25.0% down · 7.5% · 30yr · 1.5% tax · 5.0% vac · 8.0% maint · 8.0% mgmt
Financing live
Cash to close
- Down payment
- $24,750
- Closing costs
- $2,970
- Reserves months
- —
- Total cash needed
- —
Loan-product check · same deal, 3 products live
Conventional
25% down · 7.5% · 30yr
- Down + closing
- —
- Monthly P&I
- —
- Monthly cashflow
- —
- DSCR
- —
- Eligible?
- —
Personal DTI + credit; lowest rate.
DSCR
20% down · 8.5% · 30yr
- Down + closing
- —
- Monthly P&I
- —
- Monthly cashflow
- —
- DSCR
- —
- Eligible?
- —
No personal income docs; deal must DSCR.
Hard money
10% down · 12.0% · 12mo
- Down + closing
- —
- Monthly P&I
- —
- Monthly cashflow
- —
- DSCR
- —
- Eligible?
- —
Short-term bridge; refi at stabilization.
HOA detail
- Monthly dues
- $510 · $6,120/yr
- Likely covers
- gas
Listing history 23 events
-
2026-06-19days on market $99,000 Active 102 DOM
-
2026-06-18days on market $99,000 Active 101 DOM
-
2026-06-17days on market $99,000 Active 100 DOM
-
2026-06-16days on market $99,000 Active 99 DOM
-
2026-06-15days on market $99,000 Active 98 DOM
-
2026-06-14days on market $99,000 Active 96 DOM
-
2026-06-13days on market $99,000 Active 95 DOM
-
2026-06-10days on market $99,000 Active 93 DOM
-
2026-06-09days on market $99,000 Active 92 DOM
-
2026-06-08days on market $99,000 Active 91 DOM
-
2026-06-07days on market $99,000 Active 90 DOM
-
2026-06-05days on market $99,000 Active 87 DOM
-
2026-06-03days on market $99,000 Active 86 DOM
-
2026-06-02days on market $99,000 Active 85 DOM
-
2026-06-01days on market $99,000 Active 84 DOM
-
2026-05-31days on market $99,000 Active 83 DOM
-
2026-05-30days on market $99,000 Active 82 DOM
-
2026-03-09$99,000 Active
-
2021-10-29soldstatus $99,000 Closed
-
2021-09-27status Pending
-
2021-08-20$104,900 Active
-
2021-04-02historical
-
2021-02-24Active
ⓘ Source: listings_history table (triggers on properties + properties_extension) + one-shot
backfill from property_details.listing_events for pre-trigger history.
Climate risk First Street
- Flood 1/10 Low FEMA zone A · 0% chance over 30 yrs
- Wildfire 7/10 Severe
- Heat 4/10 Moderate 7 d/yr ≥93°F today · 15 d/yr by 30 yrs out
- Wind 1/10 Low
- Air quality 9/10 Extreme 18 unhealthy d/yr today · 18 by 30 yrs out
Nearby sold comps map
Loading sold comps map…
Walkable amenities ~0.75 mi
Loading nearby amenities…
Taxation est. · year 1
- Rental income
- $17,782
- − Mortgage interest
- −$5,546
- − Property taxes
- −$1,485
- − Insurance
- −$1,997
- − Repairs & maintenance
- −$1,423
- − Management
- −$1,423
- − HOA
- −$6,120
- − Depreciation
- −$2,880
- Taxable loss
- −$3,091
- Est. tax savings @ 24.0%
- +$742
- After-tax cash flow
- $-1,043/yr
For passive investors: Depreciation is non-cash, so a rental often shows a tax loss while cash-flowing — sheltering income. Rental losses are passive: they offset passive income freely, and up to $25,000/yr can offset ordinary (W-2) income if you actively participate and your MAGI is under $100k (phasing out to $0 by $150k); unused losses carry forward. On sale, claimed depreciation is recaptured at up to 25%, and gains may owe capital-gains tax (a 1031 exchange can defer both). Figures are a year-1 estimate at your 24.0% rate — not tax advice; consult a CPA.
Condition & rehab AI · 13 photos
This luxury lodge condominium is in excellent condition with a stunning river view, offering a perfect balance of relaxation and recreation.
Value-add opportunities
- Both riverfront access — attracts both buyers and renters due to unique location
- Both landscaping — enhances curb appeal and provides privacy
- Both furniture — modern furniture enhances the aesthetic and functionality of the living spaces
Renovation cost estimate screening
Value-add ROI direction
- Both riverfront access — attracts both buyers and renters due to unique location ↑
- Both landscaping — enhances curb appeal and provides privacy ↑
- Both furniture — modern furniture enhances the aesthetic and functionality of the living spaces ↑
ⓘ Cost ranges are severity-bucket heuristics (US national rule-of-thumb). Get contractor quotes + a written scope before underwriting a rehab budget.
Schools (NCES district)
- District
- Ellensburg School District
- NCES district ID
- 5302460
- Math proficiency
- 47% ▲ 1.00%
- Reading proficiency
- 55% ▲ 2.00%
- Median HH income
- $39,944
- Composite
- 44.61/100
- National rank
- #6026
- State rank
- #148 of 291 in WA
Livability — Kittitas
- Score
- 66/100
- State rank
- #321
- US rank
- #11813
Category grades
Schools grade is shown separately in the Schools card above.
Census & demographics
- County
- Kittitas County · 34,353 people
- City population
- 803
- Metro
- Ellensburg, WA
- Population (ZIP)
- 34,353
- Household income
- $71,137
- Rent vs Own
- Severe rent burden
- 2076.0
Population outlook (Kittitas County) Hauer SSP2
- Today (2025)
- 48,605 people
- By 2030
- 51,628 · +6.2%
- By 2040
- 57,361 · +18.0%
- By 2050
- 63,241 · +30.1%
- By 2075
- 79,310 · +63.2%
- By 2100
- 94,769 · +95.0%
Race, ethnicity, and origin ACS 2023
- Neighborhood character
- Predominantly White (79%)
- Race & ethnicity
- White 79% Hispanic / Latino 11% Two or more races 9% Asian 2% Black 1%
- Hispanic origin (detail)
- Mexican 8%
- Common ancestry
- Italian 9% Portuguese 4% Slovak 3%
- Foreign-born
- 5% · Canada
- Languages at home
- 91% English-only · Spanish 6% Other Indo-European 1% German/W. Germanic 1%
Political lean MEDSL · Kittitas
- 2024 margin
- R (+14.6) · D 41.1% · R 55.7% · Other 3.2%
- 2008→2024 swing
- -6.5pp toward R · 2008: -8.1pp · 2024: -14.6pp
- All cycles
- 2024: R+14.6 2020: R+10.2 2016: R+14.5 2012: R+12.6 2008: R+8.1
Not yet ingested
- Civics
- —
Market trends
- HPI YoY
- ▼ -193.62%
- Current HPI
- 211.3198
- Rent YoY
- ▲ 0.57%
- Metro
- Ellensburg, WA
- State GDP YoY
- ▲ 4.65%
- F500 in state
- 22
Industry mix (Fortune 500 HQ in WA)
| Industry | F500 HQs | Revenue |
|---|---|---|
| Retail | 2 | $269B |
|
||
| Technology / Retail | 1 | $638B |
|
||
| Technology | 1 | $245B |
|
||
| Telecommunications | 1 | $38B |
|
||
| Food / Beverage | 1 | $36B |
|
||
| Automotive / Trucks | 1 | $34B |
|
||
Price history
-5.6% since first listed6 events — show timeline
- 2026-03-09 Listed $99,000 NWMLS as Distributed by MLS Grid
- 2021-10-29 Sold (MLS) $99,000 NWMLS as Distributed by MLS Grid
- 2021-09-27 Pending — NWMLS as Distributed by MLS Grid
- 2021-08-20 Listed $104,900 NWMLS as Distributed by MLS Grid
- 2021-04-02 Delisted — NWMLS as Distributed by MLS Grid
- 2021-02-24 Listed — NWMLS as Distributed by MLS Grid
Cash-flow waterfall
monthlySold comps — $/sqft
last 12 mo · ≤1 miLoading sold comps…