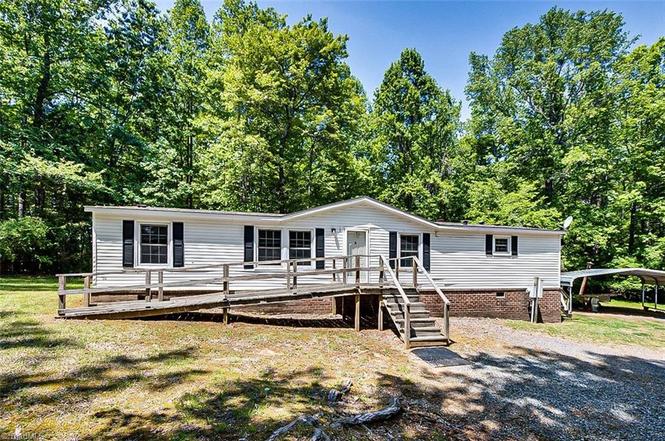
181 Emerson Cook Rd · Pittsboro, NC
Flood risk 1/10 · Minimal
- FEMA flood zone
- X (unshaded)
- Chance of flooding over 30 yrs
- 0.0%
- Est. flood insurance / yr
- $507 – $1,088
Fire risk 4/10 · Minor
- Est. fire insurance / yr
- $906 – $1,684
Heat risk 5/10 · Moderate
- Hot days now (above 104°F)
- 7 days/yr
- Hot days in 30 yrs
- 17 days/yr
Wind risk 6/10 · Moderate
- Chance of severe wind over 30 yrs
- 27.0%
Air-quality risk 2/10 · Minimal
- Unhealthy air days now
- 1 days/yr
- Unhealthy air days in 30 yrs
- 1 days/yr
Risk factors via First Street. Map © Google.
Why this score? — see what drove the C+ grade
The composite is a weighted blend of 9 inputs, each scored 0–100. Each bar is that input's sub-score; the figure is the points it added to the 100-point composite (weight × sub-score).
- Cash flow +26.8/30.0
- DSCR +9.2/10.0
- ARV discount +7.5/15.0
- 1% rule +6.4/10.0
- Schools +4.2/10.0
- Livability +3.5/5.0
- Rent growth +2.6/5.0
- Condition / age +2.5/5.0
- Appreciation +0.0/10.0
$179,900
🖨 Deal sheet 📄 Offer letter ✓ Due diligence
Listing remarks
Well maintained 3-bedroom, 2-bath home offers over 1,500 square feet of living space, including both a living room and a den—ideal for relaxing or entertaining. Situated on a generous 1-acre lot, the property provides privacy and room to enjoy the outdoors. Additional features include a detached carport and a wired outbuilding, perfect for storage! Conveniently located between Siler City and Pittsboro!
Key facts
- Detached carport
- Generous 1-acre lot
- Living room
Tags
Neighborhood map
What this means for you Summary
Snapshot
- This is a 3-bed/2.0-bath manufactured listed at $180k.
Deal economics
- At list price, monthly cash flow is $492 ($6k/yr) — positive.
- The deal already cash-flows at list — no discount required.
- Meets the 1% rule at list price ($2k rent vs $180k).
- Recommended offer: $158k (12.0% below list) — sets the bar for market timing.
- Cap rate 9.6% vs local median 1.9% in Pittsboro — top-decile yield for the area; either an underpriced asset or a hidden risk that comps aren't pricing in. Stress-test before assuming the spread holds.
Location & tenants
- Location reads 69/100 on livability (#153 in NC) — a middle-class / working-renter tenant base. Strengths: health & safety A+; Watch: schools C-, amenities F, commute F.
- Chatham County Schools (rural): math 45% / reading 51% proficiency, ranked #68 of 178 in NC (top 38%) — families likely to look elsewhere, expect single-tenant / working-renter base with shorter leases.
- Market conditions: Rents flat; 505 active listings in the ZIP; solid renter incomes; 458 units permitted in Chatham County in 2024 (0 in 5+ unit buildings).
Forward outlook
- Local home prices are declining (-3.0%/yr); year-one equity from $1k of loan paydown is wiped out by about $5k of value loss. Plan a longer hold.
- Chatham County population projected at +26% by 2050 — long-run rental-demand tailwind backs the buy-and-hold thesis.
Negotiation context
- It's been on market 155 days — a 12% lower offer ($158k) is reasonable based on typical stale-listing flexibility.
- 3 sale attempts; this cycle's ask has dropped $35k (16%) from the opening price — seller is motivated, your offer sets the floor, not the list.
Risks & watch-outs
- Climate carrying-cost: major wind risk, 27% chance of damaging wind over 30y; extreme-heat days projected 7→17/yr by 2055 (HVAC capex compounding) — expect insurance premiums to compound above CPI over the hold.
Questions for the listing agent
- It's been on market 155 days. Have you received any prior offers? Is the seller open to a 12% concession, seller financing, or rate buy-down credit?
- Why hasn't it sold? Are there any deal-killer items the seller is aware of (foundation, flood, title, zoning, code violations)?
- Is there a deadline driving the sale (1031 exchange, divorce, estate, relocation)? That informs how much negotiation room exists.
- What's the average days-on-market for RENTAL listings here right now (not sales)? A rising rental-DOM trend means longer vacancies and softer asking-rent achievability than the comps imply.
- What's the recent tenant-quality profile in this submarket — average credit score on applications, eviction rate, late-payment / NSF rate, and stable-employment percentage? A property-management company in the area should have these aggregated.
- How much new for-sale + rental construction is in the pipeline within 1–3 miles? Heavy new supply typically softens prices + rents 12–24 months out; constrained supply supports both.
Investment metrics
- 1% rule
- 1.14% ✓
- Cap rate
- 9.58%
- Cash-on-cash
- 11.73%
- DSCR
- 1.52
- GRM
- 7.3
CMA / ARV
No comps found within radius.
Projected returns pro-forma
-3.0% appreciation · 0.35% rent growth · sell at horizon
- IRR
- -1.7%
- Equity multiple
- 0.94×
- Total profit
- $-3,137
- Equity at exit
- $26,824
- IRR
- 5.1%
- Equity multiple
- 1.33×
- Total profit
- $16,832
- Equity at exit
- $15,554
Cash invested: $50,372 (down + closing). Projections, not guarantees.
Landlord ↔ Tenant lean methodology
- Overall (STATE)
- 85 Strongly Landlord-Friendly
- State North Carolina
- 85 Strongly Landlord-Friendly · R+3
- County
- — inherits STATE
- City
- — inherits STATE
ZIP-level market 27312
- Home prices YoY
- -20.3%
- Rents YoY
- 0.3%
- Active inventory
- 505
- Price-to-rent
- 7.3×
Monthly cashflow live
- Estimated rent
- $2,042 medium interval (Pro) →
- Mortgage (P&I)
- −$943
- Tax from tax record
- −$102 /mo · $1,228/yr
- Insurance
- −$75
- HOA
- −$0
- Vacancy / Maint / Mgmt
- −$429
- Net cashflow
- $492
Break-even live
UW: 25.0% down · 7.5% · 30yr · 1.5% tax · 5.0% vac · 8.0% maint · 8.0% mgmt
Financing live
Cash to close
- Down payment
- $44,975
- Closing costs
- $5,397
- Reserves months
- —
- Total cash needed
- —
Loan-product check · same deal, 3 products live
Conventional
25% down · 7.5% · 30yr
- Down + closing
- —
- Monthly P&I
- —
- Monthly cashflow
- —
- DSCR
- —
- Eligible?
- —
Personal DTI + credit; lowest rate.
DSCR
20% down · 8.5% · 30yr
- Down + closing
- —
- Monthly P&I
- —
- Monthly cashflow
- —
- DSCR
- —
- Eligible?
- —
No personal income docs; deal must DSCR.
Hard money
10% down · 12.0% · 12mo
- Down + closing
- —
- Monthly P&I
- —
- Monthly cashflow
- —
- DSCR
- —
- Eligible?
- —
Short-term bridge; refi at stabilization.
Listing history 12 events
-
2025-11-01status Pending
-
2025-10-23historical Due Diligence Period
-
2025-10-17price $179,900
-
2025-09-29price $199,000
-
2025-09-26status Active
-
2025-09-05historical Due Diligence Period
-
2025-08-28price $204,900
-
2025-08-21status Active
-
2025-07-28status Pending Accepting Backup Offers
-
2025-07-11historical Due Diligence Period
-
2025-05-28price $209,900
-
2025-05-05$214,900 Active
ⓘ Source: listings_history table (triggers on properties + properties_extension) + one-shot
backfill from property_details.listing_events for pre-trigger history.
Tax reassessment forecast NC · Resets to sale price
- Current annual tax
- $1,228 · $102/mo
- Projected year-2 tax
- $1,475 · $123/mo
- Expected delta
- +$247/yr (+$21/mo · 20.1%)
ⓘ Screening estimate from a state-policy table — verify with the county assessor before closing.
Climate risk First Street
- Flood 1/10 Low FEMA zone X (unshaded) · 0% chance over 30 yrs
- Wildfire 4/10 Moderate
- Heat 5/10 Major 7 d/yr ≥104°F today · 17 d/yr by 30 yrs out
- Wind 6/10 Major 27% chance of damaging wind over 30 yrs
- Air quality 2/10 Low 1 unhealthy d/yr today · 1 by 30 yrs out
Nearby sold comps map
Loading sold comps map…
Walkable amenities ~0.75 mi
Loading nearby amenities…
Taxation est. · year 1
- Rental income
- $24,504
- − Mortgage interest
- −$10,077
- − Property taxes
- −$1,228
- − Insurance
- −$900
- − Repairs & maintenance
- −$1,960
- − Management
- −$1,960
- − Depreciation
- −$5,233
- Taxable income
- $3,145
- Est. tax owed @ 24.0%
- −$755
- After-tax cash flow
- $5,155/yr
For passive investors: Depreciation is non-cash, so a rental often shows a tax loss while cash-flowing — sheltering income. Rental losses are passive: they offset passive income freely, and up to $25,000/yr can offset ordinary (W-2) income if you actively participate and your MAGI is under $100k (phasing out to $0 by $150k); unused losses carry forward. On sale, claimed depreciation is recaptured at up to 25%, and gains may owe capital-gains tax (a 1031 exchange can defer both). Figures are a year-1 estimate at your 24.0% rate — not tax advice; consult a CPA.
Schools (NCES district)
- District
- Chatham County Schools
- NCES district ID
- 3700750
- Math proficiency
- 45% ▼ -1.00%
- Reading proficiency
- 51% ▲ 1.00%
- Median HH income
- $57,371
- Composite
- 41.82/100
- National rank
- #3390
- State rank
- #68 of 178 in NC
Livability — Pittsboro
- Score
- 69/100
- State rank
- #153
- US rank
- #8450
Category grades
Schools grade is shown separately in the Schools card above.
Census & demographics
- County
- Chatham County · 23,341 people
- City population
- 23,341
- Metro
- Durham-Chapel Hill, NC
- Population (ZIP)
- 23,341
- Household income
- $103,104
- Rent vs Own
- Severe rent burden
- 484.0
Population outlook (Chatham County) Hauer SSP2
- Today (2025)
- 84,640 people
- By 2030
- 90,521 · +6.9%
- By 2040
- 99,791 · +17.9%
- By 2050
- 106,565 · +25.9%
- By 2075
- 119,165 · +40.8%
- By 2100
- 122,958 · +45.3%
Race, ethnicity, and origin ACS 2023
- Neighborhood character
- Predominantly White (78%)
- Race & ethnicity
- White 78% Black 10% Hispanic / Latino 8% Two or more races 7% Asian 1%
- Hispanic origin (detail)
- Mexican 3% Cuban 1%
- Common ancestry
- Italian 4% Slovak 4% Romanian 3%
- Foreign-born
- 8% · Canada, Jamaica, China
- Languages at home
- 93% English-only · Spanish 5% Other Indo-European 1%
Political lean MEDSL · Chatham
- 2024 margin
- D (+12.5) · D 55.7% · R 43.2% · Other 1.1%
- 2008→2024 swing
- +2.8pp toward D · 2008: 9.7pp · 2024: 12.5pp
- All cycles
- 2024: D+12.5 2020: D+11.5 2016: D+10.1 2012: D+4.8 2008: D+9.7
Not yet ingested
- Civics
- —
Market trends
- HPI YoY
- ▼ -65.26%
- Current HPI
- 255.9179
- Rent YoY
- ▲ 0.35%
- Metro
- Durham-Chapel Hill, NC
- State GDP YoY
- ▲ 3.28%
- F500 in state
- 26
Industry mix (Fortune 500 HQ in NC)
| Industry | F500 HQs | Revenue |
|---|---|---|
| Financial Services | 2 | $213B |
|
||
| Retail | 2 | $95B |
|
||
| Industrial Conglomerate | 1 | $38B |
|
||
| Metals / Steel | 1 | $35B |
|
||
| Utilities | 1 | $30B |
|
||
| Industrial Machinery | 1 | $19B |
|
||
Price history
-16.3% since first listed12 events — show timeline
- 2025-11-01 Pending — Triad MLS
- 2025-10-23 Contingent — Triad MLS
- 2025-10-17 Price Changed $179,900 Triad MLS
- 2025-09-29 Price Changed $199,000 Triad MLS
- 2025-09-26 Relisted — Triad MLS
- 2025-09-05 Contingent — Triad MLS
- 2025-08-28 Price Changed $204,900 Triad MLS
- 2025-08-21 Relisted — Triad MLS
- 2025-07-28 Pending — Triad MLS
- 2025-07-11 Contingent — Triad MLS
- 2025-05-28 Price Changed $209,900 Triad MLS
- 2025-05-05 Listed $214,900 Triad MLS
Property tax history
+3.2%/yrLatest (2025): $1,228 · +95.9% YoY. Source: county tax records.
Cash-flow waterfall
monthlySold comps — $/sqft
last 12 mo · ≤1 miLoading sold comps…