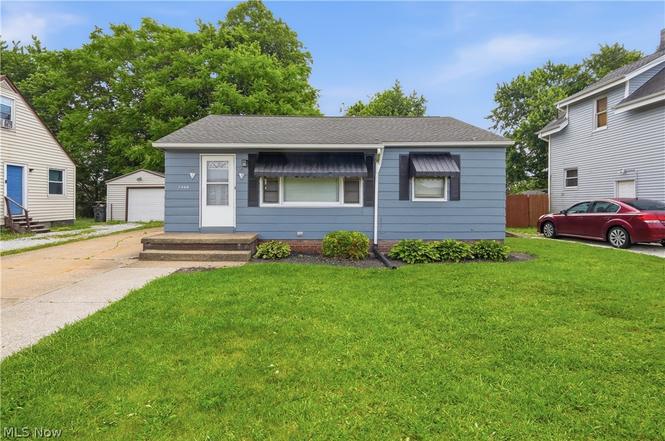
2806 Harmont Ave NE · Canton, OH
Flood risk 1/10 · Minimal
- FEMA flood zone
- X (unshaded)
- Chance of flooding over 30 yrs
- 0.0%
- Est. flood insurance / yr
- $473 – $860
Fire risk 1/10 · Minimal
- Est. fire insurance / yr
- $713 – $1,323
Heat risk 3/10 · Minor
- Hot days now (above 96°F)
- 7 days/yr
- Hot days in 30 yrs
- 17 days/yr
Wind risk 1/10 · Minimal
- Chance of severe wind over 30 yrs
- —
Air-quality risk 2/10 · Minimal
- Unhealthy air days now
- 1 days/yr
- Unhealthy air days in 30 yrs
- 2 days/yr
Risk factors via First Street. Map © Google.
Why this score? — see what drove the B grade
The composite is a weighted blend of 9 inputs, each scored 0–100. Each bar is that input's sub-score; the figure is the points it added to the 100-point composite (weight × sub-score).
- Cash flow +30.0/30.0
- ARV discount +15.0/15.0
- DSCR +10.0/10.0
- 1% rule +8.6/10.0
- Livability +3.6/5.0
- Condition / age +2.5/5.0
- Rent growth +2.4/5.0
- Schools +1.7/10.0
- Appreciation +0.0/10.0
$85,000
🖨 Deal sheet (PDF) 📄 Offer letter ✓ Due diligence
Listing remarks
Opportunity awaits with this affordable 3-bedroom, 1-bath home offering strong rental potential and plenty of value for investors and owner-occupants alike. With hardwood floors throughout, a spacious living room featuring a charming brick accent divider wall, and multiple hallway storage and linen closets, this property offers a functional layout that's easy to maintain and appealing to tenants or homeowners. The full unfinished basement provides excellent potential for additional finished living space, increased storage, or a recreation area, adding future value and versatility. Outside, you'll find a generously sized fully fenced backyard along with a storage shed for added convenience.
Key facts
- Storage shed
- Fenced backyard
- Hardwood floors
Tags
Property features AI
Exterior
- Parking: Driveway; no garage
- Utilities: Public water; Public sewer
- Home design: One-story property; Wood siding exterior; Asphalt/fiberglass roof
- Construction: Built (year per public records); Wood siding construction; Asphalt/fiberglass roof
- Exterior features: Back yard with full wood fencing; Shed(s) on the property
Interior
- Kitchen: Range; Refrigerator
- Bedrooms: 3 main-level bedrooms
- Bathrooms: 1 full bathroom on the main level
- Heating & cooling: Forced-air gas heating
- Interior features: Full unfinished basement
- Laundry & utility: Laundry in the basement
Neighborhood map
What this means for you Summary
Snapshot
- This is a 3-bed/1.0-bath single-family listed at $85k.
Deal economics
- At list price, monthly cash flow is $361 ($4k/yr) — positive.
- The deal already cash-flows at list — no discount required.
- Meets the 1% rule at list price ($1k rent vs $85k).
- Cap rate 11.4% vs local median 4.9% in Canton — top-decile yield for the area; either an underpriced asset or a hidden risk that comps aren't pricing in. Stress-test before assuming the spread holds.
Location & tenants
- Location reads 71/100 on livability (#441 in OH) — a middle-class / working-renter tenant base. Strengths: commute A+, cost of living A+, housing A; Watch: crime F, employment F.
- Canton City (urban): math 17% / reading 26% proficiency, ranked #627 of 656 in OH (top 96%) — low school quality limits family demand, transient renter base, plan for 1-2y turnover; 76% free/reduced lunch — lower-income household profile, screen leases tightly.
- Zoned schools: Belle Stone Elementary School (324 students, 0% FRL); Crenshaw Middle School (math 10% / reading 19%, grade F, #630 of 654 statewide, top 97%, 774 students, 0% FRL); Mckinley High School (math 8% / reading 29%, grade F, #683 of 781 statewide, top 88%, 2,154 students, 0% FRL) — zoned schools average 0% FRL vs 76% district-wide (76 pts lower); this property's tenant base skews higher-income than the district average.
- Market conditions: Rents soft (-0.2%/yr); 71 active listings in the ZIP; 3 comparable units currently listed for rent nearby; rentals at typical pace (median 16d on market — plan ~3-4 weeks tenant-placement turnaround); lower-income renter base — watch delinquency; 528 units permitted in Stark County in 2024 (84 in 5+ unit buildings).
- This rent runs 32% of the median local income ($43k/yr) — at the standard rent-burdened threshold; future hikes will face affordability resistance.
Forward outlook
- Local home prices are declining (-3.0%/yr); year-one equity from $588 of loan paydown is wiped out by about $3k of value loss. Plan a longer hold.
- Stark County population projected to shrink 8% by 2050 — rents likely to lag national; underwrite the cash flow, not the appreciation.
- At projected returns (-3.0% appreciation + 0.0% rent growth), your $24k cash investment doubles in ~9 years — after that, you're playing with house money.
Negotiation context
- Only 4 days on market — expect competitive offers; lowballing is unlikely to land.
- Current owner paid $21k; list at $85k implies a 305% gain — meaningful room to come down on a strong offer.
Risks & watch-outs
- Watch-outs: built in 1952 — expect roof / HVAC / electrical / plumbing capex.
Questions for the listing agent
- Built in 1952 — when were the roof, HVAC, electrical panel, plumbing, and water heater last replaced?
- Is there a deadline driving the sale (1031 exchange, divorce, estate, relocation)? That informs how much negotiation room exists.
- Crime grade is F in this area — have there been break-ins, vandalism, or insurance claims at this property in the last 3 years? What carrier currently insures it and at what premium?
- What's the average days-on-market for RENTAL listings here right now (not sales)? A rising rental-DOM trend means longer vacancies and softer asking-rent achievability than the comps imply.
- What's the recent tenant-quality profile in this submarket — average credit score on applications, eviction rate, late-payment / NSF rate, and stable-employment percentage? A property-management company in the area should have these aggregated.
- How much new for-sale + rental construction is in the pipeline within 1–3 miles? Heavy new supply typically softens prices + rents 12–24 months out; constrained supply supports both.
Investment metrics
- 1% rule
- 1.36% ✓
- Cap rate
- 11.39%
- Cash-on-cash
- 18.19%
- DSCR
- 1.81
- GRM
- 6.1
CMA / ARV
- ARV (on-the-fly)
- $114,688
- Comps found
- 12
Show comp detail 12 sales within ~0.75 mi
| Address | Dist | Beds/Ba | Sqft | Sold | Price | $/sf | Match |
|---|---|---|---|---|---|---|---|
| 2830 Harmont Ave NE | 0.05mi | 2/1.0 (-1) | 980 (+9%) | 9mo | $110,000 | $112 | 70 |
| 2602 Fletcher Ave NE | 0.34mi | 2/1.0 (-1) | 888 (-1%) | 10mo | $115,000 | $130 | 69 |
| 2102 Endrow Ave NE | 0.55mi | 3/1.0 | 850 (-5%) | 2mo | $102,500 | $121 | 64 |
| 2550 Ellis Ave NE | 0.45mi | 2/2.0 (-1) | 908 (+1%) | 9mo | $80,000 | $88 | 60 |
| 2808 Kirby Ave NE | 0.45mi | 2/2.0 (-1) | 835 (-7%) | 3mo | $127,000 | $152 | 56 |
| 2310 Willowrow Ave NE | 0.42mi | 3/1.0 | 1,008 (+12%) | 8mo | $135,000 | $134 | 53 |
| 2823 Kirby Ave NE | 0.42mi | 2/1.0 (-1) | 984 (+10%) | 9mo | $122,500 | $124 | 51 |
| 2312 Midway Ave NE | 0.47mi | 3/1.0 | 1,008 (+12%) | 10mo | $129,000 | $128 | 48 |
| 2226 Martha Ave NE | 0.57mi | 3/1.0 | 990 (+10%) | 11mo | $135,000 | $136 | 47 |
| 2656 22nd St NE | 0.69mi | 3/1.0 | 1,008 (+12%) | 1mo | $25,000 | $25 | 46 |
| 2406 Martha Ave NE | 0.52mi | 3/1.0 | 1,008 (+12%) | 12mo | $135,000 | $134 | 45 |
| 2735 19th St NE | 0.73mi | 3/1.0 | 1,008 (+12%) | 2mo | $84,000 | $83 | 44 |
Match score weights: distance 35% · size 25% · config 20% · recency 20%. Top-matched comps best support the ARV.
Projected returns pro-forma
-3.0% appreciation · 0.0% rent growth · sell at horizon
- IRR
- 6.5%
- Equity multiple
- 1.24×
- Total profit
- $5,811
- Equity at exit
- $12,674
- IRR
- 13.1%
- Equity multiple
- 1.90×
- Total profit
- $21,531
- Equity at exit
- $7,349
Cash invested: $23,800 (down + closing). Projections, not guarantees.
Landlord ↔ Tenant lean methodology
- Overall (STATE)
- 73 Landlord-Friendly
- State Ohio
- 73 Landlord-Friendly · R+6
- County
- — inherits STATE
- City
- — inherits STATE
ZIP-level market 44705
- Rents YoY
- -0.2%
- Active inventory
- 71
- Price-to-rent
- 6.1×
Monthly cashflow live
- Estimated rent
- $1,157 medium interval (Pro) →
- Mortgage (P&I)
- −$446
- Tax from tax record
- −$72 /mo · $864/yr
- Insurance
- −$35
- HOA
- −$0
- Lot rent
- −$0
- Vacancy / Maint / Mgmt
- −$243
- Net cashflow
- $361
Break-even live
Sensitivity live
| Price | -10% $409 | -5% $385 | +0% $361 | +5% $337 | +10% $313 |
|---|---|---|---|---|---|
| Rent | -10% $269 | -5% $315 | +0% $361 | +5% $406 | +10% $452 |
| Rate | -1.0pp $404 | -0.5pp $382 | base $361 | +0.5pp $339 | +1.0pp $316 |
UW: 25.0% down · 7.5% · 30yr · 1.5% tax · 5.0% vac · 8.0% maint · 8.0% mgmt
Financing live
Cash to close
- Down payment
- $21,250
- Closing costs
- $2,550
- Reserves months
- —
- Total cash needed
- —
Loan-product check · same deal, 3 products live
Conventional
25% down · 7.5% · 30yr
- Down + closing
- —
- Monthly P&I
- —
- Monthly cashflow
- —
- DSCR
- —
- Eligible?
- —
Personal DTI + credit; lowest rate.
DSCR
20% down · 8.5% · 30yr
- Down + closing
- —
- Monthly P&I
- —
- Monthly cashflow
- —
- DSCR
- —
- Eligible?
- —
No personal income docs; deal must DSCR.
Hard money
10% down · 12.0% · 12mo
- Down + closing
- —
- Monthly P&I
- —
- Monthly cashflow
- —
- DSCR
- —
- Eligible?
- —
Short-term bridge; refi at stabilization.
Rent comps 3 comps
| Address | Beds | Baths | Sqft | Rent | $/sqft | DOM | Units | Dist |
|---|---|---|---|---|---|---|---|---|
| 2321 Harmont Ave NE Canton, OH | 2.0 | 1.0 | 800 | $1,200 | $1.50 | 16d | 1 | 0.39mi |
| 2103 Willowrow Ave NE Canton, OH | 3.0 | 1.0 | 850 | $1,000 | $1.18 | 16d | 1 | 0.54mi |
| 1908 Taft Ave NE Canton, OH | 2.0 | 1.0 | 633 | $925 | $1.46 | 46d | 1 | 1.06mi |
Listing history 5 events
-
2026-06-15status $85,000 Pending 4 DOM
-
2026-06-15days on market $85,000 Active 4 DOM
-
2026-06-14days on market $85,000 Active 2 DOM
-
2026-06-13remarks 699-char remark
-
2026-06-13$85,000 Active 1 DOM
ⓘ Source: listings_history table (triggers on properties + properties_extension) + one-shot
backfill from property_details.listing_events for pre-trigger history.
Tax reassessment forecast OH · Partial reset (capped growth)
- Current annual tax
- $864 · $72/mo
- Projected year-2 tax
- $1,095 · $91/mo
- Expected delta
- +$231/yr (+$19/mo · 26.7%)
ⓘ Screening estimate from a state-policy table — verify with the county assessor before closing.
Climate risk First Street
- Flood 1/10 Low FEMA zone X (unshaded) · 0% chance over 30 yrs
- Wildfire 1/10 Low
- Heat 3/10 Moderate 7 d/yr ≥96°F today · 17 d/yr by 30 yrs out
- Wind 1/10 Low
- Air quality 2/10 Low 1 unhealthy d/yr today · 2 by 30 yrs out
Nearby sold comps map
Loading sold comps map…
Walkable amenities ~0.75 mi
Loading nearby amenities…
Taxation est. · year 1
- Rental income
- $13,883
- − Mortgage interest
- −$4,761
- − Property taxes
- −$864
- − Insurance
- −$425
- − Repairs & maintenance
- −$1,111
- − Management
- −$1,111
- − Depreciation
- −$2,473
- Taxable income
- $3,139
- Est. tax owed @ 24.0%
- −$753
- After-tax cash flow
- $3,576/yr
For passive investors: Depreciation is non-cash, so a rental often shows a tax loss while cash-flowing — sheltering income. Rental losses are passive: they offset passive income freely, and up to $25,000/yr can offset ordinary (W-2) income if you actively participate and your MAGI is under $100k (phasing out to $0 by $150k); unused losses carry forward. On sale, claimed depreciation is recaptured at up to 25%, and gains may owe capital-gains tax (a 1031 exchange can defer both). Figures are a year-1 estimate at your 24.0% rate — not tax advice; consult a CPA.
Schools (NCES district)
- District
- Canton City
- NCES district ID
- 3904371
- Math proficiency
- 17% ▼ -17.00%
- Reading proficiency
- 26% ▼ -12.00%
- Median HH income
- $28,825
- Composite
- 17.1/100
- National rank
- #9116
- State rank
- #627 of 656 in OH
Livability — Canton
- Score
- 71/100
- State rank
- #441
- US rank
- #7259
Category grades
Schools grade is shown separately in the Schools card above.
Census & demographics
- Census place
- Canton, OH
- County
- Stark County · 272,865 people
- City population
- 103,614
- Metro
- Canton-Massillon, OH
- Population (ZIP)
- 16,872
- Household income
- $43,439
- Rent vs Own
- Severe rent burden
- 524.0
Population outlook (Stark County) Hauer SSP2
- Today (2025)
- 373,708 people
- By 2030
- 371,245 · -0.7%
- By 2040
- 361,331 · -3.3%
- By 2050
- 345,290 · -7.6%
- By 2075
- 302,669 · -19.0%
- By 2100
- 238,870 · -36.1%
Race, ethnicity, and origin ACS 2023
- Neighborhood character
- Diverse neighborhood (Simpson 0.60)
- Race & ethnicity
- White 58% Black 22% Two or more races 13% Hispanic / Latino 9%
- Hispanic origin (detail)
- Mexican 2% Puerto Rican 2%
- Common ancestry
- Italian 5% Romanian 4% Lithuanian 2%
- Foreign-born
- 3% · Canada
- Languages at home
- 97% English-only · Spanish 2% German/W. Germanic 1%
Political lean MEDSL · Stark
- 2024 margin
- Strong R (+21.9) · D 38.6% · R 60.5%
- 2008→2024 swing
- -27.4pp toward R · 2008: 5.5pp · 2024: -21.9pp
- All cycles
- 2024: R+21.9 2020: R+18.5 2016: R+17.4 2012: R+0.4 2008: D+5.5
Not yet ingested
- Civics
- —
Market trends
- HPI YoY
- ▼ -200.62%
- Current HPI
- 150.1531
- Rent YoY
- ▼ -0.23%
- Metro
- Canton-Massillon, OH
- State GDP YoY
- ▲ 1.98%
- F500 in state
- 48
Industry mix (Fortune 500 HQ in OH)
| Industry | F500 HQs | Revenue |
|---|---|---|
| Insurance | 3 | $145B |
|
||
| Industrial Machinery | 3 | $49B |
|
||
| Financial Services | 3 | $24B |
|
||
| Consumer Goods | 2 | $93B |
|
||
| Aerospace / Defense | 2 | $47B |
|
||
| Utilities | 2 | $33B |
|
||
Price history
+304.8% since first listed2 events — show timeline
- 2026-06-11 Listed $85,000 MLSNOW
- 2014-10-02 Sold (Public Records) $21,000 Public Records
Property tax history
+1.3%/yrLatest (2024): $864 · +3.4% YoY. Source: county tax records.
Cash-flow waterfall
monthlySold comps — $/sqft
last 12 mo · ≤1 miLoading sold comps…