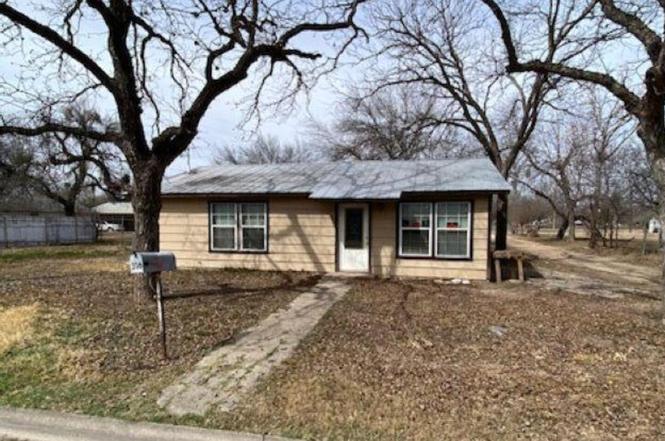
316 Geraldine · Uvalde, TX
Flood risk 1/10 · Minimal
- FEMA flood zone
- X (unshaded)
- Chance of flooding over 30 yrs
- 0.0%
- Est. flood insurance / yr
- $507 – $1,088
Fire risk 7/10 · Major
- Est. fire insurance / yr
- $1,222 – $2,270
Heat risk 8/10 · Major
- Hot days now (above 109°F)
- 7 days/yr
- Hot days in 30 yrs
- 23 days/yr
Wind risk 6/10 · Moderate
- Chance of severe wind over 30 yrs
- 49.0%
Air-quality risk 1/10 · Minimal
- Unhealthy air days now
- 0 days/yr
- Unhealthy air days in 30 yrs
- 0 days/yr
Risk factors via First Street. Map © Google.
Why this score? — see what drove the C grade
The composite is a weighted blend of 9 inputs, each scored 0–100. Each bar is that input's sub-score; the figure is the points it added to the 100-point composite (weight × sub-score).
- Cash flow +20.5/30.0
- ARV discount +12.9/15.0
- DSCR +6.5/10.0
- 1% rule +6.0/10.0
- Livability +3.7/5.0
- Rent growth +2.5/5.0
- Condition / age +2.5/5.0
- Schools +1.9/10.0
- Appreciation +0.0/10.0
$110,000
🖨 Deal sheet (PDF) 📄 Offer letter ✓ Due diligence
Listing remarks
Incredible Opportunity - 3 Bed Home on Oversized Lot Looking for the perfect entry into the market? This 3-bedroom, 1-bath home offers 1,224 sq. ft. of solid living space and sits on a wide 95' x 60' lot. With plenty of room for future expansions or outdoor entertaining, this property represents incredible value. Well-sized bedrooms and a functional floor plan make this a standout choice for homeowners and investors alike.
Key facts
- 5,706 sq ft lot
- Built 1968
- Listed 85 days
Property features AI
Finance
- Other:
- Financial info: Down payment assistance resource available
- HOA & community: Subdivision: OUT/UVALDE
Exterior
- Parking:
- Security:
- Utilities: City water and sewer
- Home design: Pre-owned single-family home; Approximately 58 years old
- Construction: Cement fiber exterior; Metal roof; Slab foundation
- Exterior features: Street paved; Curbs; Alley; Front faces south
Interior
- Kitchen: Island kitchen; Stove/Range; Refrigerator
- Bedrooms: Master bedroom approx. 16 x 9; Bedroom 2 approx. 13 x 9; Bedroom 3 approx. 15 x 10
- Flooring: Ceramic tile flooring; Laminate flooring
- Bathrooms: 1 full bathroom
- Heating & cooling: Central heating (electric); Central air conditioning
- Interior features: Ceiling fans; Living/Dining room combination; Island kitchen; Utility room inside; Ground level / no steps; Some window coverings remain; Smoke alarm; Electric water heater
- Laundry & utility: Washer connection; Dryer connection; Washer included; Dryer included; Utility room inside
Neighborhood map
What this means for you Summary
Snapshot
- This is a 3-bed/1.0-bath single-family listed at $110k.
Deal economics
- At list price, monthly cash flow is $145 ($2k/yr) — positive.
- The deal already cash-flows at list — no discount required.
- Meets the 1% rule at list price ($1k rent vs $110k).
- Recommended offer: $103k (6.0% below list) — sets the bar for market timing.
- Cap rate 7.9% vs local median 3.0% in Uvalde — top-decile yield for the area; either an underpriced asset or a hidden risk that comps aren't pricing in. Stress-test before assuming the spread holds.
Location & tenants
- Location reads 74/100 on livability (#187 in TX, #4,844 nationally) — a middle-class / working-renter tenant base. Strengths: cost of living A+, housing A+, health & safety A+; Watch: crime D+, employment D, amenities F.
- Uvalde CISD (town): math 19% / reading 26% proficiency, ranked #760 of 826 in TX (top 92%) — low school quality limits family demand, transient renter base, plan for 1-2y turnover; 71% free/reduced lunch — lower-income household profile, screen leases tightly.
- Zoned schools: Uvalde El (337 students, 86% FRL); Uvalde H S (math 15% / reading 30%, grade F, #1,354 of 1,632 statewide, top 83%, 1,129 students, 72% FRL).
- Market conditions: 225 active listings in the ZIP; 2 comparable units currently listed for rent nearby; 17 units permitted in Uvalde County in 2024 (0 in 5+ unit buildings).
Forward outlook
- Local home prices are declining (-3.0%/yr); year-one equity from $761 of loan paydown is wiped out by about $3k of value loss. Plan a longer hold.
- Uvalde County population projected at +14% by 2050 — modest demand growth; plan on rents tracking national, not racing it.
Negotiation context
- It's been on market 85 days — a 6% lower offer ($103k) is reasonable based on typical stale-listing flexibility.
Risks & watch-outs
- Climate carrying-cost: major wind risk, 49% chance of damaging wind over 30y; major wildfire risk; extreme-heat days projected 7→23/yr by 2055 (HVAC capex compounding) — expect insurance premiums to compound above CPI over the hold.
Questions for the listing agent
- It's been on market 85 days. Have you received any prior offers? Is the seller open to a 6% concession, seller financing, or rate buy-down credit?
- Built in 1968 — when were the roof, HVAC, electrical panel, plumbing, and water heater last replaced?
- Why hasn't it sold? Are there any deal-killer items the seller is aware of (foundation, flood, title, zoning, code violations)?
- Is there a deadline driving the sale (1031 exchange, divorce, estate, relocation)? That informs how much negotiation room exists.
- Schools are F-rated, which usually means shorter tenancies and higher turnover. Who's the typical renter profile here, and what's been the actual vacancy rate?
- Crime grade is D in this area — have there been break-ins, vandalism, or insurance claims at this property in the last 3 years? What carrier currently insures it and at what premium?
- What's the average days-on-market for RENTAL listings here right now (not sales)? A rising rental-DOM trend means longer vacancies and softer asking-rent achievability than the comps imply.
- What's the recent tenant-quality profile in this submarket — average credit score on applications, eviction rate, late-payment / NSF rate, and stable-employment percentage? A property-management company in the area should have these aggregated.
- How much new for-sale + rental construction is in the pipeline within 1–3 miles? Heavy new supply typically softens prices + rents 12–24 months out; constrained supply supports both.
Investment metrics
- 1% rule
- 1.10% ✓
- Cap rate
- 7.87%
- Cash-on-cash
- 5.64%
- DSCR
- 1.25
- GRM
- 7.6
CMA / ARV
- ARV (on-the-fly)
- $124,848
- Comps found
- 8
Show comp detail 8 sales within ~0.75 mi
| Address | Dist | Beds/Ba | Sqft | Sold | Price | $/sf | Match |
|---|---|---|---|---|---|---|---|
| 223 Geraldine St | 0.07mi | 3/1.0 | 1,216 (-1%) | 17mo | $121,000 | $100 | 81 |
| 238 W Calera St | 0.34mi | 3/1.0 | 1,232 (+1%) | 12mo | $95,000 | $77 | 73 |
| 544 Geraldine St | 0.31mi | 3/1.0 | 1,176 (-4%) | 20mo | $120,000 | $102 | 62 |
| 137 W Garden St | 0.44mi | 2/1.0 (-1) | 1,386 (+13%) | 1mo | $145,000 | $105 | 52 |
| 434 S Farrar | 0.55mi | 3/1.0 | 1,080 (-12%) | 11mo | $85,000 | $79 | 46 |
| 509 Perez St | 0.19mi | 4/1.5 (+1) | 1,372 (+12%) | 22mo | $129,900 | $95 | 45 |
| 412 W Garden | 0.46mi | 2/2.0 (-1) | 1,138 (-7%) | 22mo | $175,000 | $154 | 39 |
| 520 S Camp St | 0.43mi | 2/1.0 (-1) | 1,044 (-15%) | 21mo | $125,000 | $120 | 32 |
Match score weights: distance 35% · size 25% · config 20% · recency 20%. Top-matched comps best support the ARV.
Projected returns pro-forma
-3.0% appreciation · 3.0% rent growth · sell at horizon
- IRR
- -7.5%
- Equity multiple
- 0.72×
- Total profit
- $-8,554
- Equity at exit
- $16,401
- IRR
- 2.1%
- Equity multiple
- 1.15×
- Total profit
- $4,627
- Equity at exit
- $9,511
Cash invested: $30,800 (down + closing). Projections, not guarantees.
Landlord ↔ Tenant lean methodology
- Overall (STATE)
- 87 Strongly Landlord-Friendly
- State Texas
- 87 Strongly Landlord-Friendly · R+5
- County
- — inherits STATE
- City
- — inherits STATE
ZIP-level market 78801
- Active inventory
- 225
- Price-to-rent
- 7.6×
Monthly cashflow live
- Estimated rent
- $1,211 medium interval (Pro) →
- Mortgage (P&I)
- −$577
- Tax from tax record
- −$189 /mo · $2,271/yr
- Insurance
- −$46
- HOA
- −$0
- Vacancy / Maint / Mgmt
- −$254
- Net cashflow
- $145
Break-even live
Sensitivity live
| Price | -10% $207 | -5% $176 | +0% $145 | +5% $114 | +10% $83 |
|---|---|---|---|---|---|
| Rent | -10% $49 | -5% $97 | +0% $145 | +5% $193 | +10% $240 |
| Rate | -1.0pp $200 | -0.5pp $173 | base $145 | +0.5pp $116 | +1.0pp $87 |
UW: 25.0% down · 7.5% · 30yr · 1.5% tax · 5.0% vac · 8.0% maint · 8.0% mgmt
Financing live
Cash to close
- Down payment
- $27,500
- Closing costs
- $3,300
- Reserves months
- —
- Total cash needed
- —
Loan-product check · same deal, 3 products live
Conventional
25% down · 7.5% · 30yr
- Down + closing
- —
- Monthly P&I
- —
- Monthly cashflow
- —
- DSCR
- —
- Eligible?
- —
Personal DTI + credit; lowest rate.
DSCR
20% down · 8.5% · 30yr
- Down + closing
- —
- Monthly P&I
- —
- Monthly cashflow
- —
- DSCR
- —
- Eligible?
- —
No personal income docs; deal must DSCR.
Hard money
10% down · 12.0% · 12mo
- Down + closing
- —
- Monthly P&I
- —
- Monthly cashflow
- —
- DSCR
- —
- Eligible?
- —
Short-term bridge; refi at stabilization.
Rent comps 2 comps
| Address | Beds | Baths | Sqft | Rent | $/sqft | DOM | Units | Dist |
|---|---|---|---|---|---|---|---|---|
| 410 Bohme St Uvalde, TX | 2.0 | 2.0 | 1348 | $1,500 | $1.11 | 45d | 1 | 1.20mi |
| 113 S Claudia St Uvalde, TX | 2.0 | 1.0 | 700 | $750 | $1.07 | 45d | 1 | 1.21mi |
Listing history 5 events
-
2026-05-14status Pending
-
2026-04-24historical Active Option
-
2026-02-18$110,000 New
-
2014-10-31soldstatus
-
2010-03-15soldstatus
ⓘ Source: listings_history table (triggers on properties + properties_extension) + one-shot
backfill from property_details.listing_events for pre-trigger history.
Tax reassessment forecast TX · Resets to sale price
- Current annual tax
- $2,271 · $189/mo
- Projected year-2 tax
- $2,271 · $189/mo
- Expected delta
- $0/yr ($0/mo · 0.0%)
ⓘ Screening estimate from a state-policy table — verify with the county assessor before closing.
Climate risk First Street
- Flood 1/10 Low FEMA zone X (unshaded) · 0% chance over 30 yrs
- Wildfire 7/10 Severe
- Heat 8/10 Severe 7 d/yr ≥109°F today · 23 d/yr by 30 yrs out
- Wind 6/10 Major 49% chance of damaging wind over 30 yrs
- Air quality 1/10 Low 0 unhealthy d/yr today · 0 by 30 yrs out
Nearby sold comps map
Loading sold comps map…
Walkable amenities ~0.75 mi
Loading nearby amenities…
Taxation est. · year 1
- Rental income
- $14,532
- − Mortgage interest
- −$6,162
- − Property taxes
- −$2,271
- − Insurance
- −$550
- − Repairs & maintenance
- −$1,163
- − Management
- −$1,163
- − Depreciation
- −$3,200
- Taxable income
- $24
- Est. tax owed @ 24.0%
- −$6
- After-tax cash flow
- $1,731/yr
For passive investors: Depreciation is non-cash, so a rental often shows a tax loss while cash-flowing — sheltering income. Rental losses are passive: they offset passive income freely, and up to $25,000/yr can offset ordinary (W-2) income if you actively participate and your MAGI is under $100k (phasing out to $0 by $150k); unused losses carry forward. On sale, claimed depreciation is recaptured at up to 25%, and gains may owe capital-gains tax (a 1031 exchange can defer both). Figures are a year-1 estimate at your 24.0% rate — not tax advice; consult a CPA.
Schools (NCES district)
- District
- Uvalde CISD
- NCES district ID
- 4843720
- Math proficiency
- 19% ▼ -9.00%
- Reading proficiency
- 26% ▼ -3.00%
- Median HH income
- $36,054
- Composite
- 18.63/100
- National rank
- #8897
- State rank
- #760 of 826 in TX
Livability — Uvalde
- Score
- 74/100
- State rank
- #187
- US rank
- #4844
Category grades
Schools grade is shown separately in the Schools card above.
Census & demographics
- Census place
- Uvalde, TX
- Population (ZIP)
- 21,487
Population outlook (Uvalde County) Hauer SSP2
- Today (2025)
- 28,865 people
- By 2030
- 29,675 · +2.8%
- By 2040
- 31,256 · +8.3%
- By 2050
- 32,790 · +13.6%
- By 2075
- 37,013 · +28.2%
- By 2100
- 37,306 · +29.2%
Race, ethnicity, and origin ACS 2023
- Neighborhood character
- Predominantly Hispanic (76%)
- Race & ethnicity
- Hispanic / Latino 76% White 20% Two or more races 18% Native American 1% Asian 1%
- Hispanic origin (detail)
- Mexican 69% Puerto Rican 1%
- Common ancestry
- Lithuanian 2% Serbian 1% Slovak 1%
- Foreign-born
- 11% · Canada
- Languages at home
- 48% English-only · Spanish 51% Other Asian/Pacific 1%
Political lean MEDSL · Uvalde
- 2024 margin
- Solid R (+33.4) · D 32.9% · R 66.3%
- 2008→2024 swing
- -28.1pp toward R · 2008: -5.3pp · 2024: -33.4pp
- All cycles
- 2024: R+33.4 2020: R+20.3 2016: R+10.8 2012: R+8.3 2008: R+5.3
Not yet ingested
- Civics
- —
Market trends
- HPI YoY
- ▼ -113.65%
- Current HPI
- 152.7777
- Rent YoY
- —
- Metro
- —
- State GDP YoY
- ▲ 3.95%
- F500 in state
- 110
Industry mix (Fortune 500 HQ in TX)
| Industry | F500 HQs | Revenue |
|---|---|---|
| Energy | 16 | $1,198B |
|
||
| Technology | 5 | $198B |
|
||
| Engineering / Construction | 4 | $72B |
|
||
| Energy Services | 3 | $60B |
|
||
| Utilities | 3 | $41B |
|
||
| Healthcare | 2 | $330B |
|
||
Price history
5 events — show timeline
- 2026-05-14 Pending — LERA
- 2026-04-24 Contingent — LERA
- 2026-02-18 Listed $110,000 LERA
- 2014-10-31 Sold (Public Records) — Public Records
- 2010-03-15 Sold (Public Records) — Public Records
Property tax history
+10.6%/yrLatest (2025): $2,271 · +0.5% YoY. Source: county tax records.
Cash-flow waterfall
monthlySold comps — $/sqft
last 12 mo · ≤1 miLoading sold comps…