153 Brookland Cir · Columbia, SC
Flood risk 1/10 · Minimal
- FEMA flood zone
- X (unshaded)
- Chance of flooding over 30 yrs
- 0.0%
- Est. flood insurance / yr
- $507 – $1,088
Fire risk 1/10 · Minimal
- Est. fire insurance / yr
- $783 – $1,453
Heat risk 6/10 · Moderate
- Hot days now (above 108°F)
- 7 days/yr
- Hot days in 30 yrs
- 16 days/yr
Wind risk 6/10 · Moderate
- Chance of severe wind over 30 yrs
- 67.0%
Air-quality risk 3/10 · Minor
- Unhealthy air days now
- 2 days/yr
- Unhealthy air days in 30 yrs
- 2 days/yr
Risk factors via First Street. Map © Google.
Why this score? — see what drove the B grade
The composite is a weighted blend of 9 inputs, each scored 0–100. Each bar is that input's sub-score; the figure is the points it added to the 100-point composite (weight × sub-score).
- Cash flow +30.0/30.0
- 1% rule +10.0/10.0
- DSCR +10.0/10.0
- ARV discount +7.5/15.0
- Livability +3.9/5.0
- Rent growth +3.7/5.0
- Schools +2.6/10.0
- Condition / age +2.5/5.0
- Appreciation +0.0/10.0
$50,000
🖨 Deal sheet (PDF) 📄 Offer letter ✓ Due diligence
Listing remarks
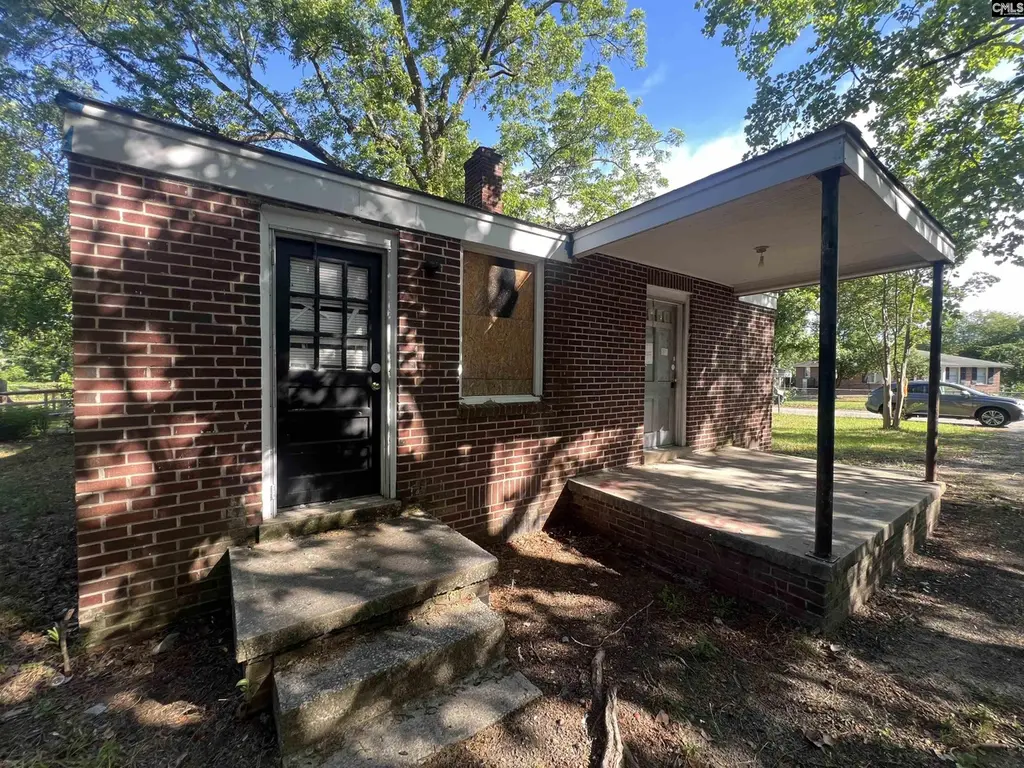
Solid brick, one-story 2 bedroom / 1 bathroom home built in 1950 and sitting on 0.21 acres. Rehab has already been started, giving investors a head start — just bring your vision and finish the project. With 899 sq ft of living space and classic mid-century construction, this property offers strong value and long-term potential. Ideal for a flip, rental, or portfolio addition. Cash or investor financing preferred. Disclaimer: CMLS has not reviewed and, therefore, does not endorse vendors who may appear in listings.
Key facts
- 9,147 sq ft lot
- Built 1950
- Listed 6 days
Property features AI
Exterior
- Utilities: Public sewer; Public water
- Home design: Single-story home
- Construction: Crawlspace foundation
- Exterior features: Brick exterior above the foundation; Paved road frontage; Public water
Interior
- Bedrooms: Master bedroom on the main level; Second bedroom on the main level
- Bathrooms: One full bathroom
- Heating & cooling: Total heated area 899
- Interior features: Formal living room on the main level; Kitchen on the main level
Neighborhood map
What this means for you Summary
Snapshot
- This is a 2-bed/1.0-bath single-family listed at $50k.
Deal economics
- At list price, monthly cash flow is $614 ($7k/yr) — positive.
- The deal already cash-flows at list — no discount required.
- Meets the 1% rule at list price ($1k rent vs $50k).
- Cap rate 21.0% vs local median 5.0% in Columbia — top-decile yield for the area; either an underpriced asset or a hidden risk that comps aren't pricing in. Stress-test before assuming the spread holds.
Location & tenants
- Location reads 78/100 on livability (#18 in SC, #2,436 nationally) — a middle-class / working-renter tenant base. Strengths: amenities A+, commute A+, cost of living A+; Watch: employment D, crime F.
- Richland 01 (urban): math 26% / reading 36% proficiency, ranked #54 of 80 in SC (top 68%) — families likely to look elsewhere, expect single-tenant / working-renter base with shorter leases; 64% free/reduced lunch — lower-income household profile, screen leases tightly.
- Zoned schools: Bradley Elementary (math 22% / reading 32%, grade F, #421 of 597 statewide, top 73%, 437 students, 100% FRL); W. A. Perry Middle (math 8% / reading 17%, grade F, #216 of 229 statewide, top 96%, 309 students, 100% FRL); C. A. Johnson High (math 34% / reading 84%, grade C+, #110 of 196 statewide, top 58%, 364 students, 100% FRL) — zoned schools average 100% FRL vs 64% district-wide (36 pts higher); higher-poverty schools than district average — tighter screening recommended.
- Market conditions: Rents rising fast (+4.7%/yr); 115 active listings in the ZIP; 21 comparable units currently listed for rent nearby; rentals at typical pace (median 16d on market — plan ~3-4 weeks tenant-placement turnaround); 3,472 units permitted in Richland County in 2024 (1,096 in 5+ unit buildings).
Forward outlook
- Local home prices are declining (-3.0%/yr); year-one equity from $346 of loan paydown is wiped out by about $2k of value loss. Plan a longer hold.
- Richland County population projected at +30% by 2050 — long-run rental-demand tailwind backs the buy-and-hold thesis.
- At projected returns (-3.0% appreciation + 4.7% rent growth), your $14k cash investment doubles in ~3 years — after that, you're playing with house money.
Negotiation context
- Only 6 days on market — expect competitive offers; lowballing is unlikely to land.
- 5 sale attempts since 5y ago with the ask held roughly flat each time — persistent listings suggest the price (not the market) is what's stuck; bring a comps-based counter.
Risks & watch-outs
- Watch-outs: built in 1950 — expect roof / HVAC / electrical / plumbing capex.
- Climate carrying-cost: major wind risk, 67% chance of damaging wind over 30y; extreme-heat days projected 7→16/yr by 2055 (HVAC capex compounding) — expect insurance premiums to compound above CPI over the hold.
Questions for the listing agent
- Built in 1950 — when were the roof, HVAC, electrical panel, plumbing, and water heater last replaced?
- Is there a deadline driving the sale (1031 exchange, divorce, estate, relocation)? That informs how much negotiation room exists.
- Schools are D-rated, which usually means shorter tenancies and higher turnover. Who's the typical renter profile here, and what's been the actual vacancy rate?
- Crime grade is F in this area — have there been break-ins, vandalism, or insurance claims at this property in the last 3 years? What carrier currently insures it and at what premium?
- What's the average days-on-market for RENTAL listings here right now (not sales)? A rising rental-DOM trend means longer vacancies and softer asking-rent achievability than the comps imply.
- What's the recent tenant-quality profile in this submarket — average credit score on applications, eviction rate, late-payment / NSF rate, and stable-employment percentage? A property-management company in the area should have these aggregated.
- How much new for-sale + rental construction is in the pipeline within 1–3 miles? Heavy new supply typically softens prices + rents 12–24 months out; constrained supply supports both.
Investment metrics
- 1% rule
- 2.43% ✓
- Cap rate
- 21.04%
- Cash-on-cash
- 52.67%
- DSCR
- 3.34
- GRM
- 3.4
CMA / ARV
No comps found within radius.
Projected returns pro-forma
-3.0% appreciation · 4.73% rent growth · sell at horizon
- IRR
- 52.6%
- Equity multiple
- 3.37×
- Total profit
- $33,205
- Equity at exit
- $7,455
- IRR
- 58.6%
- Equity multiple
- 7.32×
- Total profit
- $88,531
- Equity at exit
- $4,323
Cash invested: $14,000 (down + closing). Projections, not guarantees.
Landlord ↔ Tenant lean methodology
- Overall (STATE)
- 90 Strongly Landlord-Friendly
- State South Carolina
- 90 Strongly Landlord-Friendly · R+6
- County
- — inherits STATE
- City
- — inherits STATE
ZIP-level market 29204
- Home prices YoY
- -34.9%
- Rents YoY
- 4.7%
- Active inventory
- 115
- Price-to-rent
- 3.4×
Monthly cashflow live
- Estimated rent
- $1,215 high interval (Pro) →
- Mortgage (P&I)
- −$262
- Tax est. 1.5%
- −$62 /mo · $750/yr
- Insurance
- −$21
- HOA
- −$0
- Vacancy / Maint / Mgmt
- −$255
- Net cashflow
- $614
Break-even live
Sensitivity live
| Price | -10% $649 | -5% $632 | +0% $614 | +5% $597 | +10% $580 |
|---|---|---|---|---|---|
| Rent | -10% $518 | -5% $566 | +0% $614 | +5% $662 | +10% $710 |
| Rate | -1.0pp $640 | -0.5pp $627 | base $614 | +0.5pp $602 | +1.0pp $588 |
UW: 25.0% down · 7.5% · 30yr · 1.5% tax · 5.0% vac · 8.0% maint · 8.0% mgmt
Financing live
Cash to close
- Down payment
- $12,500
- Closing costs
- $1,500
- Reserves months
- —
- Total cash needed
- —
Loan-product check · same deal, 3 products live
Conventional
25% down · 7.5% · 30yr
- Down + closing
- —
- Monthly P&I
- —
- Monthly cashflow
- —
- DSCR
- —
- Eligible?
- —
Personal DTI + credit; lowest rate.
DSCR
20% down · 8.5% · 30yr
- Down + closing
- —
- Monthly P&I
- —
- Monthly cashflow
- —
- DSCR
- —
- Eligible?
- —
No personal income docs; deal must DSCR.
Hard money
10% down · 12.0% · 12mo
- Down + closing
- —
- Monthly P&I
- —
- Monthly cashflow
- —
- DSCR
- —
- Eligible?
- —
Short-term bridge; refi at stabilization.
Rent comps 21 comps
| Address | Beds | Baths | Sqft | Rent | $/sqft | DOM | Units | Dist |
|---|---|---|---|---|---|---|---|---|
| 3015 English Ave Columbia, SC | 2.0 | 1.0 | 981 | $1,250 | $1.27 | 12d | 1 | 0.34mi |
| 1612 Ogden St Columbia, SC | 2.0 | 1.0 | 680 | $1,100 | $1.62 | 15d | 2 | 0.48mi |
| 1115 Carter St Columbia, SC | 1.0–2.0 | 1.0 | 854 | $1,405 | $1.65 | 25d | 1 | 0.54mi |
| 3419 Piedmont Ave Columbia, SC | 3.0 | 1.0 | 1100 | $1,195 | $1.09 | 25d | 1 | 0.86mi |
| 3415 Piedmont Ave Unit A Columbia, SC | 2.0 | 1.0 | 650 | $1,000 | $1.54 | 25d | 1 | 0.86mi |
| 3540 White St Columbia, SC | 2.0 | 1.0 | 725 | $1,300 | $1.79 | 25d | 1 | 0.88mi |
| 2225 Waites Rd Unit 2225A Columbia, SC | 2.0 | 1.0 | 714 | $1,100 | $1.54 | 25d | 1 | 0.88mi |
| 2834 Keats St Columbia, SC | 3.0 | 2.0 | 921 | $2,250 | $2.44 | 15d | 1 | 0.97mi |
| 2511 Chestnut St Columbia, SC | 2.0 | 1.0 | 928 | $1,300 | $1.40 | 15d | 1 | 1.01mi |
| 2719 Howell Ct Columbia, SC | 2.0 | 1.0 | 675 | $850 | $1.26 | 12d | 1 | 1.04mi |
| 2710 Howell Ct Columbia, SC | 2.0 | 1.0 | 700 | $825 | $1.18 | 15d | 1 | 1.08mi |
| 1931 Chaney St Columbia, SC | 2.0 | 1.0 | 1034 | $1,600 | $1.55 | 25d | 1 | 1.10mi |
| 2308 Manse St Columbia, SC | 3.0 | 1.0 | 999 | $1,300 | $1.30 | 15d | 1 | 1.12mi |
| 2105 Grove St Columbia, SC | 2.0 | 1.0 | 800 | $850 | $1.06 | 25d | 1 | 1.21mi |
| 5779 Ames Rd Unit 13B Columbia, SC | 2.0 | 1.0 | 895 | $1,000 | $1.12 | 12d | 1 | 1.29mi |
| 5779 Ames Rd Columbia, SC | 2.0 | 1.0 | 895 | $1,000 | $1.12 | 15d | 1 | 1.29mi |
| 3431 Covenant Rd Columbia, SC | 1.0–3.0 | 1.0–1.5 | 950 | $1,016 | $1.07 | 25d | 1 | 1.32mi |
| 2508 Laurel St Unit B Columbia, SC | 2.0 | 1.0 | 750 | $950 | $1.27 | 25d | 1 | 1.43mi |
| 3700 West Ave Columbia, SC | 1.0–2.0 | 1.0 | 750 | $850 | $1.13 | 15d | 1 | 1.45mi |
| 5867 Ames Rd Columbia, SC | 3.0 | 1.0 | 802 | $1,200 | $1.50 | 15d | 1 | 1.45mi |
| 2413 Laurel St Unit C Columbia, SC | 2.0 | 1.0 | 800 | $900 | $1.12 | 25d | 1 | 1.47mi |
Listing history 12 events
-
2026-05-18status Pending
-
2026-05-12$50,000 Active
-
2024-01-29soldstatus $81,509
-
2021-11-09historical
-
2021-10-13status Active
-
2021-09-27historical
-
2021-09-16price $79,000
-
2021-09-02status Active
-
2021-08-16historical
-
2021-08-09status Active
-
2021-07-25historical
-
2021-05-26$85,000 Active
ⓘ Source: listings_history table (triggers on properties + properties_extension) + one-shot
backfill from property_details.listing_events for pre-trigger history.
Climate risk First Street
- Flood 1/10 Low FEMA zone X (unshaded) · 0% chance over 30 yrs
- Wildfire 1/10 Low
- Heat 6/10 Major 7 d/yr ≥108°F today · 16 d/yr by 30 yrs out
- Wind 6/10 Major 67% chance of damaging wind over 30 yrs
- Air quality 3/10 Moderate 2 unhealthy d/yr today · 2 by 30 yrs out
Nearby sold comps map
Loading sold comps map…
Walkable amenities ~0.75 mi
Loading nearby amenities…
Taxation est. · year 1
- Rental income
- $14,583
- − Mortgage interest
- −$2,801
- − Property taxes
- −$750
- − Insurance
- −$250
- − Repairs & maintenance
- −$1,167
- − Management
- −$1,167
- − Depreciation
- −$1,455
- Taxable income
- $6,994
- Est. tax owed @ 24.0%
- −$1,679
- After-tax cash flow
- $5,695/yr
For passive investors: Depreciation is non-cash, so a rental often shows a tax loss while cash-flowing — sheltering income. Rental losses are passive: they offset passive income freely, and up to $25,000/yr can offset ordinary (W-2) income if you actively participate and your MAGI is under $100k (phasing out to $0 by $150k); unused losses carry forward. On sale, claimed depreciation is recaptured at up to 25%, and gains may owe capital-gains tax (a 1031 exchange can defer both). Figures are a year-1 estimate at your 24.0% rate — not tax advice; consult a CPA.
Schools (NCES district)
- District
- Richland 01
- NCES district ID
- 4503360
- Math proficiency
- 26% ▼ -7.00%
- Reading proficiency
- 36% ▼ -5.00%
- Median HH income
- $38,931
- Composite
- 25.94/100
- National rank
- #7335
- State rank
- #54 of 80 in SC
Livability — Columbia
- Score
- 78/100
- State rank
- #18
- US rank
- #2436
Category grades
Schools grade is shown separately in the Schools card above.
Census & demographics
- County
- Richland County · 389,530 people
- City population
- 335,994
- Metro
- Columbia, SC
- Population (ZIP)
- 18,159
- Household income
- $50,189
- Rent vs Own
- Severe rent burden
- 1045.0
Population outlook (Richland County) Hauer SSP2
- Today (2025)
- 459,667 people
- By 2030
- 487,524 · +6.1%
- By 2040
- 542,035 · +17.9%
- By 2050
- 595,371 · +29.5%
- By 2075
- 732,998 · +59.5%
- By 2100
- 820,415 · +78.5%
Race, ethnicity, and origin ACS 2023
- Neighborhood character
- Diverse neighborhood (Simpson 0.57)
- Race & ethnicity
- Black 48% White 44% Two or more races 3% Asian 3% Hispanic / Latino 2%
- Common ancestry
- Serbian 2% Slovak 2% Italian 1%
- Foreign-born
- 3% · Canada
- Languages at home
- 93% English-only · Spanish 2% Tagalog/Filipino 1% Arabic 1%
Political lean MEDSL · Richland
- 2024 margin
- Solid D (+34.6) · D 66.4% · R 31.8% · Other 1.8%
- 2008→2024 swing
- +5.7pp toward D · 2008: 28.9pp · 2024: 34.6pp
- All cycles
- 2024: D+34.6 2020: D+38.3 2016: D+32.9 2012: D+33.3 2008: D+28.9
Not yet ingested
- Civics
- —
Market trends
- HPI YoY
- ▼ -104.76%
- Current HPI
- 195.2246
- Rent YoY
- ▲ 4.73%
- Metro
- Columbia, SC
- State GDP YoY
- ▲ 4.51%
- F500 in state
- 2
Industry mix (Fortune 500 HQ in SC)
| Industry | F500 HQs | Revenue |
|---|---|---|
| Packaging | 1 | $7B |
|
||
Price history
-41.2% since first listed12 events — show timeline
- 2026-05-18 Pending — Consolidated MLS
- 2026-05-12 Listed $50,000 Consolidated MLS
- 2024-01-29 Sold (Public Records) $81,509 Public Records
- 2021-11-09 Delisted — Consolidated MLS
- 2021-10-13 Relisted — Consolidated MLS
- 2021-09-27 Delisted — Consolidated MLS
- 2021-09-16 Price Changed $79,000 Consolidated MLS
- 2021-09-02 Relisted — Consolidated MLS
- 2021-08-16 Delisted — Consolidated MLS
- 2021-08-09 Relisted — Consolidated MLS
- 2021-07-25 Delisted — Consolidated MLS
- 2021-05-26 Listed $85,000 Consolidated MLS
Property tax history
+11.0%/yrLatest (2025): $2,514 · -2.7% YoY. Source: county tax records.
Cash-flow waterfall
monthlySold comps — $/sqft
last 12 mo · ≤1 miLoading sold comps…