 🏷️ Likely Rental
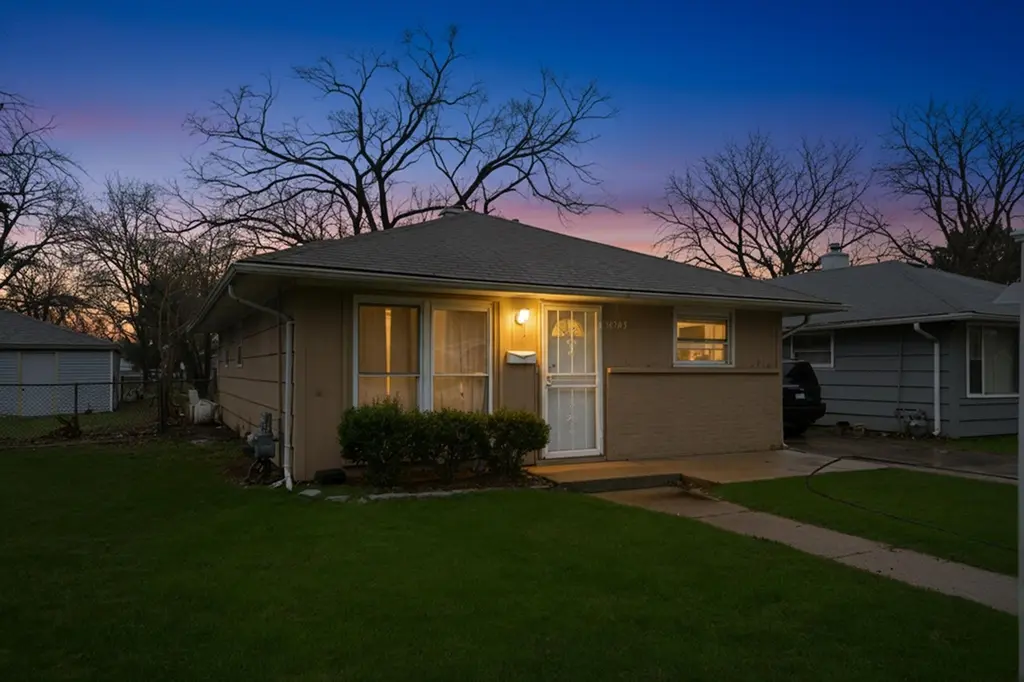
14703 Ellis Ave · Dolton, IL
Flood risk 1/10 · Minimal
- FEMA flood zone
- X (unshaded)
- Chance of flooding over 30 yrs
- 0.0%
- Est. flood insurance / yr
- $473 – $860
Fire risk 1/10 · Minimal
- Est. fire insurance / yr
- $804 – $1,492
Heat risk 3/10 · Minor
- Hot days now (above 101°F)
- 7 days/yr
- Hot days in 30 yrs
- 15 days/yr
Wind risk 2/10 · Minimal
- Chance of severe wind over 30 yrs
- —
Air-quality risk 4/10 · Minor
- Unhealthy air days now
- 4 days/yr
- Unhealthy air days in 30 yrs
- 5 days/yr
Risk factors via First Street. Map © Google.
Why this score? — see what drove the B+ grade
The composite is a weighted blend of 9 inputs, each scored 0–100. Each bar is that input's sub-score; the figure is the points it added to the 100-point composite (weight × sub-score).
- Cash flow +30.0/30.0
- ARV discount +15.0/15.0
- 1% rule +10.0/10.0
- DSCR +10.0/10.0
- Rent growth +4.9/5.0
- Livability +3.7/5.0
- Condition / age +2.5/5.0
- Schools +0.7/10.0
- Appreciation +0.0/10.0
$105,000
🖨 Deal sheet (PDF) 📄 Offer letter ✓ Due diligence
Listing remarks
Well-maintained 3 bedroom, 1 bath single-family home offering strong potential for both investors and future owner-occupants. This property is currently tenant-occupied, providing immediate rental income, with the flexibility to transition for personal use with proper notice. Located in the heart of Dolton, this home benefits from ongoing community investment and accessibility. Nearby amenities include local parks, retail corridors, and convenient access to I-94, making commuting to downtown Chicago and surrounding suburbs seamless. The area continues to see steady residential demand, making this a strategic addition to any portfolio. A solid opportunity to secure a performing asset in a we
Key facts
- Tenant occupied
- Community investment
- Convenient access
Tags
Property features AI
Finance
- Other: Possession at closing; tenant's rights apply
- Financial info: Special service area: No
- HOA & community: No master association fee required
Exterior
- Parking: Asphalt parking
- Utilities: Public water; Public sewer
- Home design: Detached single-family home; One-story; Fee simple ownership; Property currently leased; Rehab completed in 2018; Built before 1978
- Construction: Brick construction
- Exterior features: Lot dimensions approximately 33 x 125; Less than 0.25 acre lot
Interior
- Kitchen: Kitchen (Main, 12 x 10)
- Bedrooms: Master bedroom (Main, 12 x 12); Bedroom 2 (Main, 10 x 10); Bedroom 3 (Main, 11 x 12)
- Bathrooms: 1 full bathroom
- Heating & cooling: Natural gas heating
- Interior features: 5 total rooms; Family room; Living room (13 x 13); Dining room; Laundry room
- Laundry & utility: Laundry room
Neighborhood map
What this means for you Summary
Snapshot
- This is a 2-bed/1.0-bath single-family listed at $105k.
Deal economics
- At list price, monthly cash flow is $489 ($6k/yr) — positive.
- The deal already cash-flows at list — no discount required.
- Meets the 1% rule at list price ($2k rent vs $105k).
- Recommended offer: $99k (6.0% below list) — sets the bar for market timing.
- Cap rate 11.9% vs local median 9.3% in Dolton — meaningfully above typical; check what's discounted (condition, days-on-market, listing class) to confirm the premium yield is real.
Location & tenants
- Location reads 74/100 on livability (#263 in IL, #4,883 nationally) — a middle-class / working-renter tenant base. Strengths: commute A+, cost of living A+, housing A+; Watch: employment C-, health & safety C-, schools F.
- Thornton Twp Hsd 205 (suburban): math 7% / reading 8% proficiency, ranked #594 of 620 in IL (top 96%) — low school quality limits family demand, transient renter base, plan for 1-2y turnover.
- Market conditions: Rents rising fast (+9.7%/yr); 129 active listings in the ZIP; 17 comparable units currently listed for rent nearby; rentals at typical pace (median 19d on market — plan ~3-4 weeks tenant-placement turnaround); 6,272 units permitted in Cook County in 2024 (4,658 in 5+ unit buildings).
- This rent runs 39% of the median local income ($58k/yr) — at the standard rent-burdened threshold; future hikes will face affordability resistance.
Forward outlook
- Local home prices are declining (-3.0%/yr); year-one equity from $726 of loan paydown is wiped out by about $3k of value loss. Plan a longer hold.
- At projected returns (-3.0% appreciation + 8.0% rent growth), your $29k cash investment doubles in ~5 years — after that, you're playing with house money.
Negotiation context
- It's been on market 69 days — a 6% lower offer ($99k) is reasonable based on typical stale-listing flexibility.
- 19 sale attempts since 15y ago with the ask held roughly flat each time — persistent listings suggest the price (not the market) is what's stuck; bring a comps-based counter.
- Current owner paid $58k; list at $105k implies a 81% gain — meaningful room to come down on a strong offer.
Risks & watch-outs
- Watch-outs: property tax is 4.6% of price; built in 1955 — expect roof / HVAC / electrical / plumbing capex.
Questions for the listing agent
- It's been on market 69 days. Have you received any prior offers? Is the seller open to a 6% concession, seller financing, or rate buy-down credit?
- Built in 1955 — when were the roof, HVAC, electrical panel, plumbing, and water heater last replaced?
- Property tax is high relative to price — has the assessment been appealed recently, and will the sale trigger a re-assessment?
- Why hasn't it sold? Are there any deal-killer items the seller is aware of (foundation, flood, title, zoning, code violations)?
- Is there a deadline driving the sale (1031 exchange, divorce, estate, relocation)? That informs how much negotiation room exists.
- Schools are F-rated, which usually means shorter tenancies and higher turnover. Who's the typical renter profile here, and what's been the actual vacancy rate?
- Crime grade is D in this area — have there been break-ins, vandalism, or insurance claims at this property in the last 3 years? What carrier currently insures it and at what premium?
- What's the average days-on-market for RENTAL listings here right now (not sales)? A rising rental-DOM trend means longer vacancies and softer asking-rent achievability than the comps imply.
- What's the recent tenant-quality profile in this submarket — average credit score on applications, eviction rate, late-payment / NSF rate, and stable-employment percentage? A property-management company in the area should have these aggregated.
- How much new for-sale + rental construction is in the pipeline within 1–3 miles? Heavy new supply typically softens prices + rents 12–24 months out; constrained supply supports both.
Investment metrics
- 1% rule
- 1.79% ✓
- Cap rate
- 11.88%
- Cash-on-cash
- 19.95%
- DSCR
- 1.89
- GRM
- 4.7
CMA / ARV
- ARV (on-the-fly)
- $135,975
- Comps found
- 12
Show comp detail 12 sales within ~0.75 mi
| Address | Dist | Beds/Ba | Sqft | Sold | Price | $/sf | Match |
|---|---|---|---|---|---|---|---|
| 14840 Langley Ave | 0.46mi | 2/1.0 | 936 (+1%) | 2mo | $37,000 | $40 | 75 |
| 14915 Irving Ave | 0.58mi | 2/1.0 | 980 (+6%) | 4mo | $68,000 | $69 | 60 |
| 14647 Irving Ave | 0.50mi | 3/2.0 (+1) | 889 (-4%) | 2mo | $138,000 | $155 | 59 |
| 14731 Kimbark Ave | 0.38mi | 3/1.0 (+1) | 1,017 (+10%) | 2mo | $115,000 | $113 | 58 |
| 14819 Irving Ave | 0.53mi | 3/1.0 (+1) | 980 (+6%) | 4mo | $130,000 | $133 | 57 |
| 14642 Dorchester Ave | 0.48mi | 3/1.0 (+1) | 1,013 (+10%) | 1mo | $170,000 | $168 | 56 |
| 14622 Kenwood Ave | 0.42mi | 3/1.0 (+1) | 1,017 (+10%) | 5mo | $110,000 | $108 | 55 |
| 14728 Kenwood Ave | 0.42mi | 3/1.0 (+1) | 1,017 (+10%) | 5mo | $156,000 | $153 | 54 |
| 14341 University Ave | 0.46mi | 3/1.0 (+1) | 1,035 (+12%) | 1mo | $100,000 | $97 | 53 |
| 14738 Blackstone Ave | 0.61mi | 3/1.0 (+1) | 1,017 (+10%) | 1mo | $150,000 | $147 | 50 |
| 14610 Blackstone Ave | 0.61mi | 3/1.0 (+1) | 1,017 (+10%) | 1mo | $150,000 | $147 | 49 |
| 1138 E 151st St | 0.51mi | 3/1.5 (+1) | 1,056 (+14%) | 2mo | $210,000 | $199 | 44 |
Match score weights: distance 35% · size 25% · config 20% · recency 20%. Top-matched comps best support the ARV.
Projected returns pro-forma
-3.0% appreciation · 8.0% rent growth · sell at horizon
- IRR
- 18.9%
- Equity multiple
- 1.82×
- Total profit
- $24,230
- Equity at exit
- $15,656
- IRR
- 31.1%
- Equity multiple
- 4.64×
- Total profit
- $107,118
- Equity at exit
- $9,078
Cash invested: $29,400 (down + closing). Projections, not guarantees.
Landlord ↔ Tenant lean methodology
- Overall (STATE)
- 43 Moderately Tenant-Leaning
- State Illinois
- 43 Moderately Tenant-Leaning · D+7
- County
- — inherits STATE
- City
- — inherits STATE
ZIP-level market 60419
- Home prices YoY
- -25.7%
- Rents YoY
- 9.7%
- Active inventory
- 129
- Price-to-rent
- 4.7×
Monthly cashflow live
- Estimated rent
- $1,877 high interval (Pro) →
- Mortgage (P&I)
- −$551
- Tax from tax record
- −$400 /mo · $4,796/yr
- Insurance
- −$44
- HOA
- −$0
- Vacancy / Maint / Mgmt
- −$394
- Net cashflow
- $489
Break-even live
Sensitivity live
| Price | -10% $830 | -5% $519 | +0% $489 | +5% $459 | +10% $429 |
|---|---|---|---|---|---|
| Rent | -10% $341 | -5% $415 | +0% $489 | +5% $563 | +10% $637 |
| Rate | -1.0pp $542 | -0.5pp $515 | base $489 | +0.5pp $462 | +1.0pp $434 |
UW: 25.0% down · 7.5% · 30yr · 1.5% tax · 5.0% vac · 8.0% maint · 8.0% mgmt
Financing live
Cash to close
- Down payment
- $26,250
- Closing costs
- $3,150
- Reserves months
- —
- Total cash needed
- —
Loan-product check · same deal, 3 products live
Conventional
25% down · 7.5% · 30yr
- Down + closing
- —
- Monthly P&I
- —
- Monthly cashflow
- —
- DSCR
- —
- Eligible?
- —
Personal DTI + credit; lowest rate.
DSCR
20% down · 8.5% · 30yr
- Down + closing
- —
- Monthly P&I
- —
- Monthly cashflow
- —
- DSCR
- —
- Eligible?
- —
No personal income docs; deal must DSCR.
Hard money
10% down · 12.0% · 12mo
- Down + closing
- —
- Monthly P&I
- —
- Monthly cashflow
- —
- DSCR
- —
- Eligible?
- —
Short-term bridge; refi at stabilization.
Rent comps 17 comps
| Address | Beds | Baths | Sqft | Rent | $/sqft | DOM | Units | Dist |
|---|---|---|---|---|---|---|---|---|
| 14502 Cottage Grove Ave Unit 1S Dolton, IL | 1.0 | 1.0 | 900 | $1,425 | $1.58 | 8d | 1 | 0.38mi |
| 14500 Cottage Grove Ave Unit 3 Dolton, IL | 2.0 | 1.0 | 1000 | $1,475 | $1.48 | 25d | 1 | 0.39mi |
| 14817 Champlain Ave Dolton, IL | 2.0 | 1.0 | 980 | $2,430 | $2.48 | 23d | 1 | 0.46mi |
| 14738 Blackstone Ave Dolton, IL | 3.0 | 1.0 | 1017 | $2,400 | $2.36 | 11d | 1 | 0.62mi |
| 14610 Blackstone Ave Dolton, IL | 3.0 | 1.0 | 1017 | $2,400 | $2.36 | 7d | 1 | 0.62mi |
| 14305 Irving Ave Unit 2 Dolton, IL | 3.0 | 1.0 | 1100 | $2,200 | $2.00 | 25d | 1 | 0.68mi |
| 495 Madison Ave Unit 1D Calumet City, IL | 1.0 | 1.0 | 595 | $1,175 | $1.97 | 15d | 1 | 1.04mi |
| 15238 Doctor Martin Luther King Junior Dr Unit 2W Dolton, IL | 2.0 | 1.0 | 800 | $1,500 | $1.88 | 11d | 1 | 1.05mi |
| 1450 E 154th Pl Dolton, IL | 1.0 | 1.0 | 800 | $1,250 | $1.56 | 25d | 1 | 1.11mi |
| 15324 Doctor Martin Luther King Junior Dr Unit 1B Dolton, IL | 1.0 | 1.0 | 725 | $985 | $1.36 | 19d | 1 | 1.12mi |
| 405 Clyde Ave Calumet City, IL | 3.0 | 1.0 | 973 | $2,300 | $2.36 | 0d | 1 | 1.16mi |
| 1860 State St Calumet City, IL | 3.0 | 1.0 | 1100 | $1,800 | $1.64 | 18d | 1 | 1.17mi |
| 13841 Forest Ave Dolton, IL | 3.0 | 1.0 | 930 | $1,895 | $2.04 | 25d | 1 | 1.40mi |
| 101 Oglesby Ave Calumet City, IL | 2.0 | 1.0 | 1100 | $1,800 | $1.64 | 13d | 1 | 1.48mi |
| 101 Oglesby Ave Calumet City, IL | 2.0 | 1.0 | 1000 | $1,800 | $1.80 | 23d | 1 | 1.48mi |
| 101 Oglesby Ave Calumet City, IL | 2.0 | 1.0 | 1000 | $1,800 | $1.80 | 20d | 1 | 1.48mi |
| 250 Yates Ave Unit 1616 Dolton 1E Calumet City, IL | 2.0 | 1.0 | 875 | $1,465 | $1.67 | 8d | 1 | 1.49mi |
Listing history 50 events
-
2026-06-21days on market $105,000 Active 69 DOM
-
2026-06-18days on market $105,000 Active 66 DOM
-
2026-06-17days on market $105,000 Active 65 DOM
-
2026-06-16days on market $105,000 Active 64 DOM
-
2026-06-15days on market $105,000 Active 63 DOM
-
2026-06-13days on market $105,000 Active 61 DOM
-
2026-06-13days on market $105,000 Active 60 DOM
-
2026-06-09days on market $105,000 Active 57 DOM
-
2026-06-08statusdays on market $105,000 Active 56 DOM
-
2026-06-07statusdays on market $105,000 Temporarily No Showings 55 DOM
-
2026-06-04days on market $105,000 Active 52 DOM
-
2026-06-03days on market $105,000 Active 51 DOM
-
2026-06-02days on market $105,000 Active 50 DOM
-
2026-06-01days on market $105,000 Active 49 DOM
-
2026-05-31days on market $105,000 Active 48 DOM
-
2026-04-11$105,000 Active
-
2025-07-22historical
-
2025-06-11Active
-
2025-06-11historical
-
2025-05-17status Active
-
2025-04-24historical Contingent - Continue to Show
-
2025-03-29Active
-
2025-03-29historical
-
2025-02-24Active
-
2025-02-24historical
-
2025-01-28Active
-
2025-01-28historical
-
2025-01-02price
-
2024-11-01status Active
-
2024-10-26historical
-
2024-10-24Active
-
2022-02-01historical
-
2021-12-01Active
-
2021-04-26New
-
2018-07-05soldstatus $58,000
-
2018-06-13soldstatus $58,000 Closed Sale
-
2018-05-15$59,000
-
2018-05-15historical
-
2018-05-03historical
-
2018-05-02New
-
2016-11-25soldstatus $47,500
-
2016-11-22soldstatus $47,500 Closed Sale
-
2016-11-10status Pending
-
2016-10-13status Reactivated
-
2016-09-23status Pending
-
2016-09-19status Contingent (Do Not Show)
-
2016-09-19historical
-
2016-09-12$45,200 New
-
2016-09-09historical
-
2016-05-06New
ⓘ Source: listings_history table (triggers on properties + properties_extension) + one-shot
backfill from property_details.listing_events for pre-trigger history.
Tax reassessment forecast IL · Partial reset (capped growth)
- Current annual tax
- $4,796 · $400/mo
- Projected year-2 tax
- $4,796 · $400/mo
- Expected delta
- $0/yr ($0/mo · 0.0%)
ⓘ Screening estimate from a state-policy table — verify with the county assessor before closing.
Climate risk First Street
- Flood 1/10 Low FEMA zone X (unshaded) · 0% chance over 30 yrs
- Wildfire 1/10 Low
- Heat 3/10 Moderate 7 d/yr ≥101°F today · 15 d/yr by 30 yrs out
- Wind 2/10 Low
- Air quality 4/10 Moderate 4 unhealthy d/yr today · 5 by 30 yrs out
Nearby sold comps map
Loading sold comps map…
Walkable amenities ~0.75 mi
Loading nearby amenities…
Taxation est. · year 1
- Rental income
- $22,524
- − Mortgage interest
- −$5,882
- − Property taxes
- −$4,796
- − Insurance
- −$525
- − Repairs & maintenance
- −$1,802
- − Management
- −$1,802
- − Depreciation
- −$3,055
- Taxable income
- $4,663
- Est. tax owed @ 24.0%
- −$1,119
- After-tax cash flow
- $4,746/yr
For passive investors: Depreciation is non-cash, so a rental often shows a tax loss while cash-flowing — sheltering income. Rental losses are passive: they offset passive income freely, and up to $25,000/yr can offset ordinary (W-2) income if you actively participate and your MAGI is under $100k (phasing out to $0 by $150k); unused losses carry forward. On sale, claimed depreciation is recaptured at up to 25%, and gains may owe capital-gains tax (a 1031 exchange can defer both). Figures are a year-1 estimate at your 24.0% rate — not tax advice; consult a CPA.
Schools (NCES district)
- District
- Thornton Twp Hsd 205
- NCES district ID
- 1738970
- Math proficiency
- 7% ▬ 0.00%
- Reading proficiency
- 8% ▼ -2.00%
- Median HH income
- $43,392
- Composite
- 6.92/100
- National rank
- #9976
- State rank
- #594 of 620 in IL
Livability — Dolton
- Score
- 74/100
- State rank
- #263
- US rank
- #4883
Category grades
Schools grade is shown separately in the Schools card above.
Census & demographics
- Census place
- Dolton, IL
- County
- Cook County · 4,486,803 people
- City population
- 20,825
- Metro
- Chicago-Naperville-Elgin, IL-IN-WI
- Population (ZIP)
- 20,825
- Household income
- $57,887
- Rent vs Own
- Severe rent burden
- 919.0
Population outlook (Cook County) Hauer SSP2
- Today (2025)
- 5,347,519 people
- By 2030
- 5,357,703 · +0.2%
- By 2040
- 5,324,924 · -0.4%
- By 2050
- 5,230,762 · -2.2%
- By 2075
- 4,785,735 · -10.5%
- By 2100
- 4,188,836 · -21.7%
Race, ethnicity, and origin ACS 2023
- Neighborhood character
- Predominantly Black (91%)
- Race & ethnicity
- Black 91% White 4% Two or more races 3% Hispanic / Latino 1%
- Common ancestry
- Romanian 1% Hispanic 1%
- Foreign-born
- 3% · Canada
- Languages at home
- 95% English-only · French/Haitian/Cajun 2% Spanish 1%
Political lean MEDSL · Cook
- 2024 margin
- Solid D (+42.0) · D 70.4% · R 28.4% · Other 1.2%
- 2008→2024 swing
- -11.4pp toward R · 2008: 53.4pp · 2024: 42.0pp
- All cycles
- 2024: D+42.0 2020: D+50.3 2016: D+53.0 2012: D+49.4 2008: D+53.4
Not yet ingested
- Civics
- —
Market trends
- HPI YoY
- ▼ -66.88%
- Current HPI
- 193.2346
- Rent YoY
- ▲ 9.65%
- Metro
- Chicago-Naperville-Elgin, IL-IN-WI
- State GDP YoY
- ▲ 1.59%
- F500 in state
- 60
Industry mix (Fortune 500 HQ in IL)
| Industry | F500 HQs | Revenue |
|---|---|---|
| Insurance | 4 | $201B |
|
||
| Consumer Goods | 4 | $87B |
|
||
| Industrial Machinery | 3 | $64B |
|
||
| Healthcare | 2 | $55B |
|
||
| Retail / Pharmacy | 1 | $148B |
|
||
| Agriculture / Food | 1 | $86B |
|
||
Price history
+142.2% since first listed58 events — show timeline
- 2026-04-11 Listed $105,000 MRED as Distributed by MLS Grid
- 2025-07-22 Listing Removed — MRED as Distributed by MLS Grid
- 2025-06-11 Listing Removed — MRED as Distributed by MLS Grid
- 2025-06-11 Listed — MRED as Distributed by MLS Grid
- 2025-05-17 Relisted — MRED as Distributed by MLS Grid
- 2025-04-24 Contingent — MRED as Distributed by MLS Grid
- 2025-03-29 Listing Removed — MRED as Distributed by MLS Grid
- 2025-03-29 Listed — MRED as Distributed by MLS Grid
- 2025-02-24 Listing Removed — MRED as Distributed by MLS Grid
- 2025-02-24 Listed — MRED as Distributed by MLS Grid
- 2025-01-28 Listing Removed — MRED as Distributed by MLS Grid
- 2025-01-28 Listed — MRED as Distributed by MLS Grid
- 2025-01-02 Price Changed — MRED as Distributed by MLS Grid
- 2024-11-01 Relisted — MRED as Distributed by MLS Grid
- 2024-10-26 Listing Removed — MRED as Distributed by MLS Grid
- 2024-10-24 Listed — MRED as Distributed by MLS Grid
- 2022-02-01 Listing Removed — MRED as Distributed by MLS Grid
- 2021-12-01 Listed — MRED as Distributed by MLS Grid
- 2021-04-26 Listed — MRED as Distributed by MLS Grid
- 2018-07-05 Sold (Public Records) $58,000 Public Records
- 2018-06-13 Sold (MLS) $58,000 MRED as Distributed by MLS Grid
- 2018-05-15 Listing Removed — MRED as Distributed by MLS Grid
- 2018-05-15 Listed $59,000 MRED as Distributed by MLS Grid
- 2018-05-03 Listing Removed — MRED as Distributed by MLS Grid
- 2018-05-02 Listed — MRED as Distributed by MLS Grid
- 2016-11-25 Sold (Public Records) $47,500 Public Records
- 2016-11-22 Sold (MLS) $47,500 MRED as Distributed by MLS Grid
- 2016-11-10 Pending — MRED as Distributed by MLS Grid
- 2016-10-13 Relisted — MRED as Distributed by MLS Grid
- 2016-09-23 Pending — MRED as Distributed by MLS Grid
- 2016-09-19 Pending — MRED as Distributed by MLS Grid
- 2016-09-19 Listing Removed — MRED as Distributed by MLS Grid
- 2016-09-12 Listed $45,200 MRED as Distributed by MLS Grid
- 2016-09-09 Listing Removed — MRED as Distributed by MLS Grid
- 2016-05-06 Listed — MRED as Distributed by MLS Grid
- 2012-10-26 Sold (MLS) $19,000 MRED as Distributed by MLS Grid
- 2012-10-12 Pending — MRED as Distributed by MLS Grid
- 2012-09-29 Contingent — MRED as Distributed by MLS Grid
- 2012-09-11 Listing Removed — MRED as Distributed by MLS Grid
- 2012-09-08 Listed $19,900 MRED as Distributed by MLS Grid
- 2012-07-18 Relisted — MRED as Distributed by MLS Grid
- 2012-07-18 Price Changed — MRED as Distributed by MLS Grid
- 2012-02-02 Contingent — MRED as Distributed by MLS Grid
- 2011-12-04 Price Changed — MRED as Distributed by MLS Grid
- 2011-10-17 Price Changed — MRED as Distributed by MLS Grid
- 2011-08-07 Price Changed — MRED as Distributed by MLS Grid
- 2011-05-31 Price Changed — MRED as Distributed by MLS Grid
- 2011-05-23 Price Changed — MRED as Distributed by MLS Grid
- 2011-05-12 Price Changed — MRED as Distributed by MLS Grid
- 2011-04-11 Price Changed — MRED as Distributed by MLS Grid
- 2011-04-01 Relisted — MRED as Distributed by MLS Grid
- 2011-04-01 Price Changed — MRED as Distributed by MLS Grid
- 2011-03-27 Listing Removed — MRED as Distributed by MLS Grid
- 2011-03-16 Listed — MRED as Distributed by MLS Grid
- 2006-04-04 Sold (Public Records) $109,000 Public Records
- 2005-12-15 Sold (Public Records) $64,000 Public Records
- 2005-12-15 Sold (Public Records) $64,000 Public Records
- 1989-10-01 Sold (Public Records) $43,350 Public Records
Property tax history
+3.1%/yrLatest (2023): $4,796 · +40.9% YoY. Source: county tax records.
Cash-flow waterfall
monthlySold comps — $/sqft
last 12 mo · ≤1 miLoading sold comps…