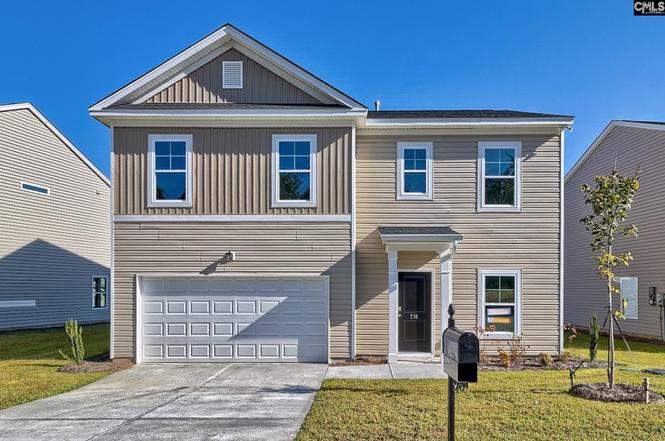
716 Samantha St · Oak Grove, SC
Flood risk 1/10 · Minimal
- FEMA flood zone
- X (unshaded)
- Chance of flooding over 30 yrs
- 0.0%
- Est. flood insurance / yr
- $507 – $1,088
Fire risk 4/10 · Minor
- Est. fire insurance / yr
- $783 – $1,453
Heat risk 7/10 · Major
- Hot days now (above 108°F)
- 7 days/yr
- Hot days in 30 yrs
- 16 days/yr
Wind risk 6/10 · Moderate
- Chance of severe wind over 30 yrs
- 67.0%
Air-quality risk 3/10 · Minor
- Unhealthy air days now
- 2 days/yr
- Unhealthy air days in 30 yrs
- 2 days/yr
Risk factors via First Street. Map © Google.
Why this score? — see what drove the D- grade
The composite is a weighted blend of 9 inputs, each scored 0–100. Each bar is that input's sub-score; the figure is the points it added to the 100-point composite (weight × sub-score).
- Cash flow +10.0/30.0
- ARV discount +7.5/15.0
- Schools +4.2/10.0
- Rent growth +3.6/5.0
- Livability +3.3/5.0
- DSCR +2.8/10.0
- Condition / age +2.5/5.0
- 1% rule +2.0/10.0
- Appreciation +0.0/10.0
$279,990
🖨 Deal sheet (PDF) 📄 Offer letter ✓ Due diligence
Listing remarks
Welcome to Emanuel Creek’s newest phase by Hurricane Builders — located in West Columbia and zoned for award-winning Lexington One schools. The Adger floor plan offers 5 spacious bedrooms, 3 full bathrooms, and a 2-car garage, with thoughtful design throughout. As you enter the home, a staircase welcomes you to the left, while a central hallway leads you toward the heart of the home. Just off the hall is a full bathroom and a versatile bedroom — ideal for guests or a home office. At the end of the hallway, you'll find a stunning open-concept kitchen and an expansive living area with large windows, tons of natural light, and direct access to the patio and oversized backyard
Key facts
- Open-concept kitchen
- Oversized backyard
- Durable lvp flooring
Tags
Property features AI
Finance
- Other: Builder warranty (new construction)
- HOA & community: Property is part of an association; Association fees cover common area maintenance
Exterior
- Parking: Attached garage on main level; Four parking spaces total, including a 2-car garage
- Utilities: Public sewer; Public water
- Home design: Two-story single-family home; Located on lot 37
- Construction: Slab foundation
- Exterior features: Vinyl exterior finish; Paved road access; Public water
Interior
- Kitchen: Kitchen island; Granite countertops; Dishwasher; Disposal; Microwave (above stove); Gas range
- Bedrooms: Master bedroom on second floor with double vanity, private bath, separate shower, walk-in closet, private closet and separate water closet; carpet flooring; Bedroom 2 on main floor with luxury vinyl plank flooring; Bedrooms 3, 4, and 5 on second floor with ceiling fans and carpet flooring
- Flooring: Luxury vinyl plank in living areas and bedroom 2; Carpet in master and additional bedrooms
- Bathrooms: Three full bathrooms total; One main-level full bathroom; Two additional full bathrooms
- Heating & cooling: Central air conditioning; Gas heating on both first and second levels
- Interior features: Ceiling fans in multiple rooms; Tankless hot water; Island kitchen with granite countertops
- Laundry & utility: Washer and dryer located on the second floor
Neighborhood map
What this means for you Summary
Snapshot
- This is a 5-bed/3.0-bath land listed at $280k.
Deal economics
- At list price, monthly cash flow is $-169 ($-2k/yr) — negative.
- To cash-flow at today's rent, offer at most $250k (10.7% below list).
- To meet the 1% rule (rent ≥ 1% of price), the offer needs to be $197k (29.6% below list).
- Recommended offer: $197k (29.6% below list) — sets the bar for 1% rule.
Location & tenants
- Location reads 66/100 on livability (#114 in SC) — a middle-class / working-renter tenant base. Strengths: cost of living A+, housing A+, health & safety B; Watch: crime D, amenities F, commute F.
- Lexington 01 (suburban): math 42% / reading 53% proficiency, ranked #11 of 80 in SC (top 14%) — families likely to look elsewhere, expect single-tenant / working-renter base with shorter leases.
- Zoned schools: White Knoll Elementary (math 32% / reading 36%, grade F, #359 of 597 statewide, top 60%, 673 students, 41% FRL); White Knoll Middle (math 19% / reading 31%, grade F, #165 of 229 statewide, top 72%, 816 students, 52% FRL); White Knoll High (math 47% / reading 85%, grade B, #81 of 196 statewide, top 42%, 2,204 students, 45% FRL) — zoned schools average 46% FRL vs 30% district-wide (16 pts higher); higher-poverty schools than district average — tighter screening recommended.
- Market conditions: Rents rising fast (+4.6%/yr); 193 active listings in the ZIP; 1,712 units permitted in Lexington County in 2024 (0 in 5+ unit buildings).
- This rent runs 32% of the median local income ($75k/yr) — at the standard rent-burdened threshold; future hikes will face affordability resistance.
Forward outlook
- Local home prices are declining (-3.0%/yr); year-one equity from $2k of loan paydown is wiped out by about $8k of value loss. Plan a longer hold.
- Lexington County population projected at +26% by 2050 — long-run rental-demand tailwind backs the buy-and-hold thesis.
Negotiation context
- It's been on market 235 days — a 12% lower offer ($246k) is reasonable based on typical stale-listing flexibility.
- 4 sale attempts since 4y ago; this cycle's ask has dropped $35k (11%) from the opening price — seller is motivated, your offer sets the floor, not the list.
Risks & watch-outs
- Climate carrying-cost: major wind risk, 67% chance of damaging wind over 30y; extreme-heat days projected 7→16/yr by 2055 (HVAC capex compounding) — expect insurance premiums to compound above CPI over the hold.
Questions for the listing agent
- What do current leases actually rent for vs. the listed asking? Can we see a recent rent roll and the last 12 months of T-12 income?
- It's been on market 235 days. Have you received any prior offers? Is the seller open to a 30% concession, seller financing, or rate buy-down credit?
- What does the HOA fee cover, when was the last increase, and are there any pending special assessments or reserve-fund shortfalls?
- Why hasn't it sold? Are there any deal-killer items the seller is aware of (foundation, flood, title, zoning, code violations)?
- Is there a deadline driving the sale (1031 exchange, divorce, estate, relocation)? That informs how much negotiation room exists.
- Schools are D-rated, which usually means shorter tenancies and higher turnover. Who's the typical renter profile here, and what's been the actual vacancy rate?
- Crime grade is D in this area — have there been break-ins, vandalism, or insurance claims at this property in the last 3 years? What carrier currently insures it and at what premium?
- The area grade is low — what's the realistic commute time and amenity access for the typical tenant pool here? Any planned neighborhood developments (good or bad) we should know about?
- What's the average days-on-market for RENTAL listings here right now (not sales)? A rising rental-DOM trend means longer vacancies and softer asking-rent achievability than the comps imply.
- What's the recent tenant-quality profile in this submarket — average credit score on applications, eviction rate, late-payment / NSF rate, and stable-employment percentage? A property-management company in the area should have these aggregated.
- How much new for-sale + rental construction is in the pipeline within 1–3 miles? Heavy new supply typically softens prices + rents 12–24 months out; constrained supply supports both.
Investment metrics
- 1% rule
- 0.70% ✗
- Cap rate
- 5.57%
- Cash-on-cash
- -2.59%
- DSCR
- 0.88
- GRM
- 11.8
CMA / ARV
No comps found within radius.
Projected returns pro-forma
-3.0% appreciation · 4.57% rent growth · sell at horizon
- IRR
- -19.1%
- Equity multiple
- 0.32×
- Total profit
- $-53,064
- Equity at exit
- $41,747
- IRR
- -9.2%
- Equity multiple
- 0.40×
- Total profit
- $-47,061
- Equity at exit
- $24,208
Cash invested: $78,397 (down + closing). Projections, not guarantees.
Landlord ↔ Tenant lean methodology
- Overall (STATE)
- 90 Strongly Landlord-Friendly
- State South Carolina
- 90 Strongly Landlord-Friendly · R+6
- County
- — inherits STATE
- City
- — inherits STATE
ZIP-level market 29170
- Home prices YoY
- -16.9%
- Rents YoY
- 4.6%
- Active inventory
- 193
- Price-to-rent
- 11.8×
Monthly cashflow live
- Estimated rent
- $1,971 medium interval (Pro) →
- Mortgage (P&I)
- −$1,468
- Tax from tax record
- −$124 /mo · $1,488/yr
- Insurance
- −$117
- HOA
- −$17
- Vacancy / Maint / Mgmt
- −$414
- Net cashflow
- $-169
Break-even live
Sensitivity live
| Price | -10% $-10 | -5% $-90 | +0% $-169 | +5% $-248 | +10% $-327 |
|---|---|---|---|---|---|
| Rent | -10% $-325 | -5% $-247 | +0% $-169 | +5% $-91 | +10% $-13 |
| Rate | -1.0pp $-28 | -0.5pp $-98 | base $-169 | +0.5pp $-241 | +1.0pp $-315 |
UW: 25.0% down · 7.5% · 30yr · 1.5% tax · 5.0% vac · 8.0% maint · 8.0% mgmt
Financing live
Cash to close
- Down payment
- $69,998
- Closing costs
- $8,400
- Reserves months
- —
- Total cash needed
- —
Loan-product check · same deal, 3 products live
Conventional
25% down · 7.5% · 30yr
- Down + closing
- —
- Monthly P&I
- —
- Monthly cashflow
- —
- DSCR
- —
- Eligible?
- —
Personal DTI + credit; lowest rate.
DSCR
20% down · 8.5% · 30yr
- Down + closing
- —
- Monthly P&I
- —
- Monthly cashflow
- —
- DSCR
- —
- Eligible?
- —
No personal income docs; deal must DSCR.
Hard money
10% down · 12.0% · 12mo
- Down + closing
- —
- Monthly P&I
- —
- Monthly cashflow
- —
- DSCR
- —
- Eligible?
- —
Short-term bridge; refi at stabilization.
HOA detail
- Monthly dues
- $17 · $204/yr
Listing history 30 events
-
2026-06-22days on market $279,990 Active 235 DOM
-
2026-06-18days on market $279,990 Active 232 DOM
-
2026-06-17days on market $279,990 Active 231 DOM
-
2026-06-16days on market $279,990 Active 230 DOM
-
2026-06-15days on market $279,990 Active 229 DOM
-
2026-06-14days on market $279,990 Active 227 DOM
-
2026-06-10pricestatusdays on market $279,990 Active 224 DOM
-
2026-06-09days on market $274,990 Active - Contingent 223 DOM
-
2026-06-08days on market $274,990 Active - Contingent 222 DOM
-
2026-06-07days on market $274,990 Active - Contingent 221 DOM
-
2026-06-03days on market $274,990 Active - Contingent 217 DOM
-
2026-06-03days on market $274,990 Active - Contingent 216 DOM
-
2026-06-02days on market $274,990 Active - Contingent 215 DOM
-
2026-05-31days on market $274,990 Active - Contingent 214 DOM
-
2026-04-29historical Active - Contingent
-
2026-04-29status Active
-
2026-04-26historical
-
2026-03-25historical Active - Contingent
-
2026-01-08price $274,990
-
2025-11-07price $299,990
-
2025-10-24$314,990 Active
-
2023-07-10status Pending
-
2023-05-16price $277,990
-
2023-05-15status Active
-
2023-01-27price $274,790
-
2023-01-16price $272,990
-
2023-01-14price $274,332
-
2022-12-07price $270,990
-
2022-10-24price $274,332
-
2022-08-26$289,332 Active
ⓘ Source: listings_history table (triggers on properties + properties_extension) + one-shot
backfill from property_details.listing_events for pre-trigger history.
Tax reassessment forecast SC · Resets to sale price
- Current annual tax
- $1,488 · $124/mo
- Projected year-2 tax
- $1,596 · $133/mo
- Expected delta
- +$108/yr (+$9/mo · 7.3%)
ⓘ Screening estimate from a state-policy table — verify with the county assessor before closing.
Climate risk First Street
- Flood 1/10 Low FEMA zone X (unshaded) · 0% chance over 30 yrs
- Wildfire 4/10 Moderate
- Heat 7/10 Severe 7 d/yr ≥108°F today · 16 d/yr by 30 yrs out
- Wind 6/10 Major 67% chance of damaging wind over 30 yrs
- Air quality 3/10 Moderate 2 unhealthy d/yr today · 2 by 30 yrs out
Nearby sold comps map
Loading sold comps map…
Walkable amenities ~0.75 mi
Loading nearby amenities…
Taxation est. · year 1
- Rental income
- $23,651
- − Mortgage interest
- −$15,684
- − Property taxes
- −$1,488
- − Insurance
- −$1,400
- − Repairs & maintenance
- −$1,892
- − Management
- −$1,892
- − HOA
- −$204
- − Depreciation
- −$8,145
- Taxable loss
- −$7,054
- Est. tax savings @ 24.0%
- +$1,693
- After-tax cash flow
- $-334/yr
For passive investors: Depreciation is non-cash, so a rental often shows a tax loss while cash-flowing — sheltering income. Rental losses are passive: they offset passive income freely, and up to $25,000/yr can offset ordinary (W-2) income if you actively participate and your MAGI is under $100k (phasing out to $0 by $150k); unused losses carry forward. On sale, claimed depreciation is recaptured at up to 25%, and gains may owe capital-gains tax (a 1031 exchange can defer both). Figures are a year-1 estimate at your 24.0% rate — not tax advice; consult a CPA.
Schools (NCES district)
- District
- Lexington 01
- NCES district ID
- 4502700
- Math proficiency
- 42% ▼ -12.00%
- Reading proficiency
- 53% ▼ -2.00%
- Median HH income
- $61,298
- Composite
- 41.75/100
- National rank
- #3399
- State rank
- #11 of 80 in SC
Livability — Oak Grove
- Score
- 66/100
- State rank
- #114
- US rank
- #11681
Category grades
Schools grade is shown separately in the Schools card above.
Census & demographics
- County
- Lexington County · 232,571 people
- Metro
- Columbia, SC
- Population (ZIP)
- 21,247
- Household income
- $74,902
- Rent vs Own
- Severe rent burden
- 147.0
Population outlook (Lexington County) Hauer SSP2
- Today (2025)
- 322,999 people
- By 2030
- 342,356 · +6.0%
- By 2040
- 377,715 · +16.9%
- By 2050
- 406,984 · +26.0%
- By 2075
- 465,447 · +44.1%
- By 2100
- 485,674 · +50.4%
Race, ethnicity, and origin ACS 2023
- Neighborhood character
- Predominantly White (66%)
- Race & ethnicity
- White 66% Black 17% Hispanic / Latino 10% Two or more races 8% Asian 3%
- Hispanic origin (detail)
- Mexican 6% Puerto Rican 1%
- Common ancestry
- Serbian 2% Italian 2% Romanian 2%
- Foreign-born
- 9% · Canada, Jamaica, Guatemala
- Languages at home
- 90% English-only · Spanish 7% Other Indo-European 2%
Political lean MEDSL · Lexington
- 2024 margin
- Solid R (+33.5) · D 32.5% · R 66.0% · Other 1.4%
- 2008→2024 swing
- +4.6pp toward D · 2008: -38.0pp · 2024: -33.5pp
- All cycles
- 2024: R+33.5 2020: R+30.1 2016: R+36.7 2012: R+37.8 2008: R+38.0
Not yet ingested
- Civics
- —
Market trends
- HPI YoY
- ▼ -52.72%
- Current HPI
- 259.713
- Rent YoY
- ▲ 4.57%
- Metro
- Columbia, SC
- State GDP YoY
- ▲ 4.51%
- F500 in state
- 2
Industry mix (Fortune 500 HQ in SC)
| Industry | F500 HQs | Revenue |
|---|---|---|
| Packaging | 1 | $7B |
|
||
Price history
-5.0% since first listed16 events — show timeline
- 2026-04-29 Contingent — Consolidated MLS
- 2026-04-29 Relisted — Consolidated MLS
- 2026-04-26 Delisted — Consolidated MLS
- 2026-03-25 Contingent — Consolidated MLS
- 2026-01-08 Price Changed $274,990 Consolidated MLS
- 2025-11-07 Price Changed $299,990 Consolidated MLS
- 2025-10-24 Listed $314,990 Consolidated MLS
- 2023-07-10 Pending — Consolidated MLS
- 2023-05-16 Price Changed $277,990 Consolidated MLS
- 2023-05-15 Relisted — Consolidated MLS
- 2023-01-27 Price Changed $274,790 Consolidated MLS
- 2023-01-16 Price Changed $272,990 Consolidated MLS
- 2023-01-14 Price Changed $274,332 Consolidated MLS
- 2022-12-07 Price Changed $270,990 Consolidated MLS
- 2022-10-24 Price Changed $274,332 Consolidated MLS
- 2022-08-26 Listed $289,332 Consolidated MLS
Property tax history
+14.9%/yrLatest (2024): $1,488 · +0.9% YoY. Source: county tax records.
Cash-flow waterfall
monthlySold comps — $/sqft
last 12 mo · ≤1 miLoading sold comps…