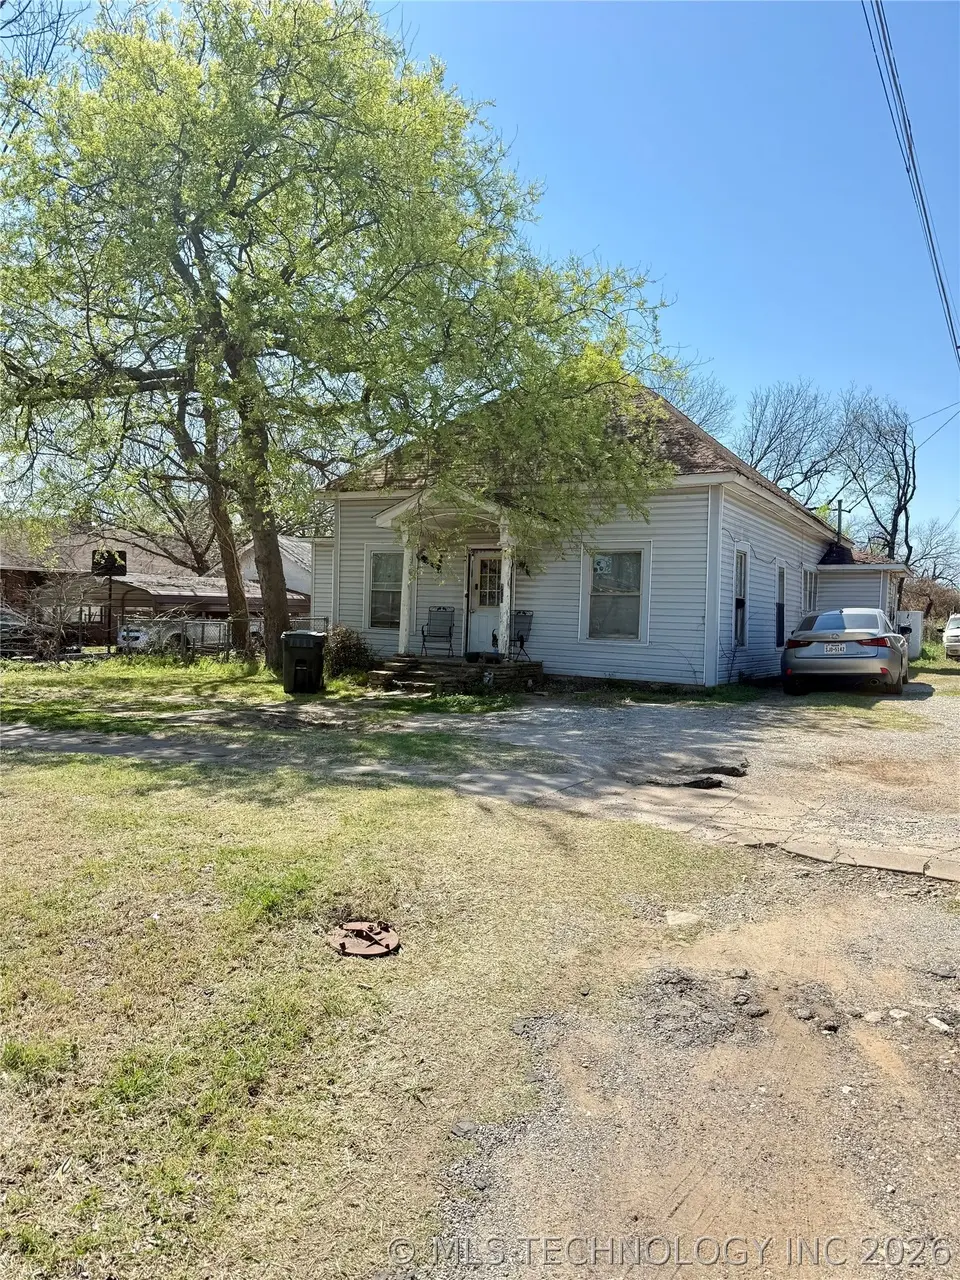
708 W 12th · Sulphur, OK
Flood risk 1/10 · Minimal
- FEMA flood zone
- X (unshaded)
- Chance of flooding over 30 yrs
- 0.0%
- Est. flood insurance / yr
- $507 – $1,088
Fire risk 7/10 · Major
- Est. fire insurance / yr
- $2,463 – $4,575
Heat risk 6/10 · Moderate
- Hot days now (above 108°F)
- 7 days/yr
- Hot days in 30 yrs
- 19 days/yr
Wind risk 3/10 · Minor
- Chance of severe wind over 30 yrs
- 9.0%
Air-quality risk 2/10 · Minimal
- Unhealthy air days now
- 1 days/yr
- Unhealthy air days in 30 yrs
- 1 days/yr
Risk factors via First Street. Map © Google.
Why this score? — see what drove the B+ grade
The composite is a weighted blend of 9 inputs, each scored 0–100. Each bar is that input's sub-score; the figure is the points it added to the 100-point composite (weight × sub-score).
- Cash flow +30.0/30.0
- 1% rule +10.0/10.0
- DSCR +10.0/10.0
- Appreciation +8.0/10.0
- ARV discount +7.5/15.0
- Livability +3.4/5.0
- Schools +2.6/10.0
- Rent growth +2.5/5.0
- Condition / age +2.5/5.0
$49,000
🖨 Deal sheet 📄 Offer letter ✓ Due diligence
Key facts
- 5,604 sq ft lot
- Garage
- Built 1964
Property features AI
Exterior
- Parking: Attached garage; Carport
- Security: No safety shelter
- Utilities: Electricity available; Public water; Public sewer
- Home design: Single-story; Faces east; Crawlspace foundation
- Construction: Built with vinyl and wood siding on a wood frame; Asphalt/fiberglass roof
- Exterior features: Porch; Chain link fencing; No other exterior features listed
Interior
- Bathrooms: 1 full bathroom
- Heating & cooling: Gas heating
- Interior features: Laminate counters; No additional interior features listed
- Laundry & utility: Gas water heater
Neighborhood map
What this means for you Summary
Snapshot
- This is a 2-bed/1.0-bath single-family listed at $49k.
Deal economics
- At list price, monthly cash flow is $558 ($7k/yr) — positive.
- The deal already cash-flows at list — no discount required.
- Meets the 1% rule at list price ($1k rent vs $49k).
- Recommended offer: $46k (6.0% below list) — sets the bar for market timing.
- Cap rate 19.9% vs local median 3.4% in Sulphur — top-decile yield for the area; either an underpriced asset or a hidden risk that comps aren't pricing in. Stress-test before assuming the spread holds.
Location & tenants
- Location reads 68/100 on livability (#60 in OK) — a middle-class / working-renter tenant base. Strengths: cost of living A+, housing A+, crime B+; Watch: employment C-, schools D-, amenities F.
- Sulphur (town): math 30% / reading 32% proficiency, ranked #56 of 270 in OK (top 21%) — families likely to look elsewhere, expect single-tenant / working-renter base with shorter leases.
- Market conditions: 147 active listings in the ZIP; 20 units permitted in Murray County in 2024 (0 in 5+ unit buildings).
Forward outlook
- In year one you build about $3k of equity ($339 loan paydown + $3k appreciation (5.9% local appreciation)).
- Murray County population projected at +16% by 2050 — long-run rental-demand tailwind backs the buy-and-hold thesis.
- At projected returns (5.9% appreciation + 3.0% rent growth), your $14k cash investment doubles in ~2 years — after that, you're playing with house money.
- By year 10, paydown + projected appreciation supports a ~$33k cash-out refi (75% LTV) — recoverable capital for the next deal without selling this one.
Negotiation context
- It's been on market 87 days — a 6% lower offer ($46k) is reasonable based on typical stale-listing flexibility.
- Current owner paid $40k; 22% above their basis — modest negotiation headroom, anchor on the comps not their cost.
Risks & watch-outs
- Climate carrying-cost: major wildfire risk; extreme-heat days projected 7→19/yr by 2055 (HVAC capex compounding) — expect insurance premiums to compound above CPI over the hold.
Questions for the listing agent
- It's been on market 87 days. Have you received any prior offers? Is the seller open to a 6% concession, seller financing, or rate buy-down credit?
- Built in 1964 — when were the roof, HVAC, electrical panel, plumbing, and water heater last replaced?
- Why hasn't it sold? Are there any deal-killer items the seller is aware of (foundation, flood, title, zoning, code violations)?
- Is there a deadline driving the sale (1031 exchange, divorce, estate, relocation)? That informs how much negotiation room exists.
- Schools are D-rated, which usually means shorter tenancies and higher turnover. Who's the typical renter profile here, and what's been the actual vacancy rate?
- What's the average days-on-market for RENTAL listings here right now (not sales)? A rising rental-DOM trend means longer vacancies and softer asking-rent achievability than the comps imply.
- What's the recent tenant-quality profile in this submarket — average credit score on applications, eviction rate, late-payment / NSF rate, and stable-employment percentage? A property-management company in the area should have these aggregated.
- How much new for-sale + rental construction is in the pipeline within 1–3 miles? Heavy new supply typically softens prices + rents 12–24 months out; constrained supply supports both.
Investment metrics
- 1% rule
- 2.25% ✓
- Cap rate
- 19.95%
- Cash-on-cash
- 48.78%
- DSCR
- 3.17
- GRM
- 3.7
CMA / ARV
- ARV (on-the-fly)
- $175,260
- Comps found
- 12
Show comp detail 12 sales within ~0.75 mi
| Address | Dist | Beds/Ba | Sqft | Sold | Price | $/sf | Match |
|---|---|---|---|---|---|---|---|
| 1500 W 12th | 0.58mi | 2/1.0 | 1,380 (0%) | 4mo | $84,000 | $61 | 70 |
| 920 W Vinita | 0.35mi | 3/1.0 (+1) | 1,352 (-2%) | 14mo | $159,000 | $118 | 63 |
| 1718 W Mcalester | 0.43mi | 2/2.0 | 1,356 (-2%) | 12mo | $190,486 | $140 | 63 |
| 918 W Wyandotte | 0.18mi | 3/2.0 (+1) | 1,301 (-6%) | 20mo | $135,500 | $104 | 57 |
| 1220 W 14th | 0.41mi | 3/1.0 (+1) | 1,288 (-7%) | 12mo | $29,000 | $23 | 55 |
| 1301 W 8th | 0.55mi | 3/1.0 (+1) | 1,248 (-10%) | 1mo | $25,000 | $20 | 53 |
| 911 W 10th | 0.24mi | 3/1.5 (+1) | 1,268 (-8%) | 22mo | $80,000 | $63 | 50 |
| 1609 W Ardmore | 0.38mi | 3/2.0 (+1) | 1,226 (-11%) | 10mo | $169,000 | $138 | 47 |
| 1510 W Tahlequah St | 0.59mi | 3/2.0 (+1) | 1,419 (+3%) | 15mo | $199,000 | $140 | 47 |
| 1402 W 10th | 0.56mi | 3/1.0 (+1) | 1,194 (-14%) | 3mo | $171,000 | $143 | 44 |
| 1918 W Wyandotte | 0.64mi | 3/1.0 (+1) | 1,236 (-10%) | 10mo | $175,000 | $142 | 39 |
| 1119 W 18th | 0.58mi | 3/2.0 (+1) | 1,312 (-5%) | 21mo | $166,000 | $127 | 39 |
Match score weights: distance 35% · size 25% · config 20% · recency 20%. Top-matched comps best support the ARV.
Projected returns pro-forma
5.9% appreciation · 3.0% rent growth · sell at horizon
- IRR
- 57.5%
- Equity multiple
- 4.60×
- Total profit
- $49,379
- Equity at exit
- $30,497
- IRR
- 54.5%
- Equity multiple
- 9.57×
- Total profit
- $117,515
- Equity at exit
- $55,042
Cash invested: $13,720 (down + closing). Projections, not guarantees.
Landlord ↔ Tenant lean methodology
- Overall (STATE)
- 83 Strongly Landlord-Friendly
- State Oklahoma
- 83 Strongly Landlord-Friendly · R+20
- County
- — inherits STATE
- City
- — inherits STATE
ZIP-level market 73086
- Home prices YoY
- 1.8%
- Active inventory
- 147
- Price-to-rent
- 3.7×
Monthly cashflow live
- Estimated rent
- $1,104 medium interval (Pro) →
- Mortgage (P&I)
- −$257
- Tax from tax record
- −$37 /mo · $444/yr
- Insurance
- −$20
- HOA
- −$0
- Vacancy / Maint / Mgmt
- −$232
- Net cashflow
- $558
Break-even live
UW: 25.0% down · 7.5% · 30yr · 1.5% tax · 5.0% vac · 8.0% maint · 8.0% mgmt
Financing live
Cash to close
- Down payment
- $12,250
- Closing costs
- $1,470
- Reserves months
- —
- Total cash needed
- —
Loan-product check · same deal, 3 products live
Conventional
25% down · 7.5% · 30yr
- Down + closing
- —
- Monthly P&I
- —
- Monthly cashflow
- —
- DSCR
- —
- Eligible?
- —
Personal DTI + credit; lowest rate.
DSCR
20% down · 8.5% · 30yr
- Down + closing
- —
- Monthly P&I
- —
- Monthly cashflow
- —
- DSCR
- —
- Eligible?
- —
No personal income docs; deal must DSCR.
Hard money
10% down · 12.0% · 12mo
- Down + closing
- —
- Monthly P&I
- —
- Monthly cashflow
- —
- DSCR
- —
- Eligible?
- —
Short-term bridge; refi at stabilization.
Listing history 19 events
-
2026-06-19days on market $49,000 Active 87 DOM
-
2026-06-18days on market $49,000 Active 86 DOM
-
2026-06-17days on market $49,000 Active 85 DOM
-
2026-06-16days on market $49,000 Active 84 DOM
-
2026-06-15days on market $49,000 Active 83 DOM
-
2026-06-14days on market $49,000 Active 81 DOM
-
2026-06-12days on market $49,000 Active 80 DOM
-
2026-06-09days on market $49,000 Active 77 DOM
-
2026-06-08days on market $49,000 Active 76 DOM
-
2026-06-07days on market $49,000 Active 75 DOM
-
2026-06-03days on market $49,000 Active 71 DOM
-
2026-06-02days on market $49,000 Active 70 DOM
-
2026-06-01days on market $49,000 Active 69 DOM
-
2026-05-31days on market $49,000 Active 68 DOM
-
2026-05-30days on market $49,000 Active 67 DOM
-
2026-03-24$59,000 Active
-
2022-10-28soldstatus $40,000
-
2007-03-26soldstatus $11,500
-
1996-10-17soldstatus $13,000
ⓘ Source: listings_history table (triggers on properties + properties_extension) + one-shot
backfill from property_details.listing_events for pre-trigger history.
Tax reassessment forecast OK · Resets to sale price
- Current annual tax
- $444 · $37/mo
- Projected year-2 tax
- $444 · $37/mo
- Expected delta
- $0/yr ($0/mo · 0.0%)
ⓘ Screening estimate from a state-policy table — verify with the county assessor before closing.
Climate risk First Street
- Flood 1/10 Low FEMA zone X (unshaded) · 0% chance over 30 yrs
- Wildfire 7/10 Severe
- Heat 6/10 Major 7 d/yr ≥108°F today · 19 d/yr by 30 yrs out
- Wind 3/10 Moderate 9% chance of damaging wind over 30 yrs
- Air quality 2/10 Low 1 unhealthy d/yr today · 1 by 30 yrs out
Nearby sold comps map
Loading sold comps map…
Walkable amenities ~0.75 mi
Loading nearby amenities…
Taxation est. · year 1
- Rental income
- $13,246
- − Mortgage interest
- −$2,745
- − Property taxes
- −$444
- − Insurance
- −$245
- − Repairs & maintenance
- −$1,060
- − Management
- −$1,060
- − Depreciation
- −$1,425
- Taxable income
- $6,268
- Est. tax owed @ 24.0%
- −$1,504
- After-tax cash flow
- $5,188/yr
For passive investors: Depreciation is non-cash, so a rental often shows a tax loss while cash-flowing — sheltering income. Rental losses are passive: they offset passive income freely, and up to $25,000/yr can offset ordinary (W-2) income if you actively participate and your MAGI is under $100k (phasing out to $0 by $150k); unused losses carry forward. On sale, claimed depreciation is recaptured at up to 25%, and gains may owe capital-gains tax (a 1031 exchange can defer both). Figures are a year-1 estimate at your 24.0% rate — not tax advice; consult a CPA.
Schools (NCES district)
- District
- Sulphur
- NCES district ID
- 4029160
- Math proficiency
- 30% ▼ -11.00%
- Reading proficiency
- 32% ▼ -9.00%
- Median HH income
- $44,116
- Composite
- 26.47/100
- National rank
- #7214
- State rank
- #56 of 270 in OK
Livability — Sulphur
- Score
- 68/100
- State rank
- #60
- US rank
- #9249
Category grades
Schools grade is shown separately in the Schools card above.
Census & demographics
- Census place
- Sulphur, OK
- City population
- 8,504
- Population (ZIP)
- 8,504
Population outlook (Murray County) Hauer SSP2
- Today (2025)
- 14,976 people
- By 2030
- 15,487 · +3.4%
- By 2040
- 16,455 · +9.9%
- By 2050
- 17,308 · +15.6%
- By 2075
- 19,421 · +29.7%
- By 2100
- 20,335 · +35.8%
Race, ethnicity, and origin ACS 2023
- Neighborhood character
- Predominantly White (68%)
- Race & ethnicity
- White 68% Two or more races 14% Native American 12% Hispanic / Latino 8%
- Hispanic origin (detail)
- Mexican 6%
- Common ancestry
- Slovak 4% Portuguese 2% Italian 1%
- Foreign-born
- 2% · Canada
- Languages at home
- 97% English-only · Spanish 2%
Political lean MEDSL · Murray
- 2024 margin
- Solid R (+61.3) · D 18.4% · R 79.7% · Other 2.0%
- 2008→2024 swing
- -21.0pp toward R · 2008: -40.4pp · 2024: -61.3pp
- All cycles
- 2024: R+61.3 2020: R+58.6 2016: R+55.9 2012: R+40.1 2008: R+40.4
Not yet ingested
- Civics
- —
Market trends
- HPI YoY
- ▲ 5.90%
- Current HPI
- 331.8646
- Rent YoY
- —
- Metro
- —
- State GDP YoY
- ▲ 1.55%
- F500 in state
- 6
Industry mix (Fortune 500 HQ in OK)
| Industry | F500 HQs | Revenue |
|---|---|---|
| Energy | 3 | $48B |
|
||
Price history
+353.8% since first listed4 events — show timeline
- 2026-03-24 Listed $59,000 MLS Technology, Inc.
- 2022-10-28 Sold (Public Records) $40,000 Public Records
- 2007-03-26 Sold (Public Records) $11,500 Public Records
- 1996-10-17 Sold (Public Records) $13,000 Public Records
Property tax history
+14.0%/yrLatest (2025): $444 · +5.0% YoY. Source: county tax records.
Cash-flow waterfall
monthlySold comps — $/sqft
last 12 mo · ≤1 miLoading sold comps…