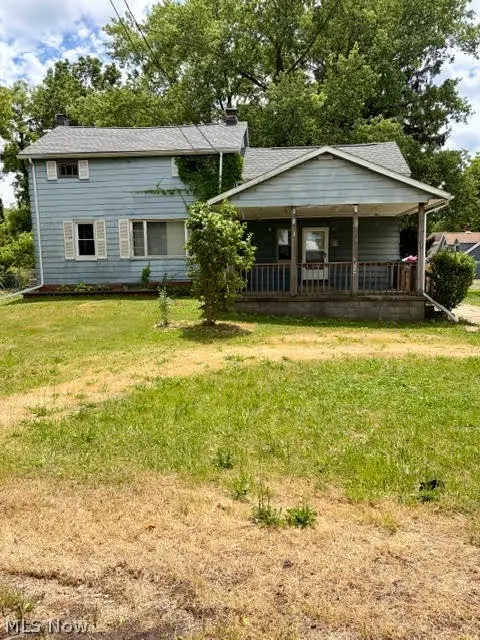
5649 Park Rd · Leavittsburg, OH
Flood risk 1/10 · Minimal
- FEMA flood zone
- X (unshaded)
- Chance of flooding over 30 yrs
- 0.0%
- Est. flood insurance / yr
- $473 – $860
Fire risk 1/10 · Minimal
- Est. fire insurance / yr
- $713 – $1,323
Heat risk 3/10 · Minor
- Hot days now (above 97°F)
- 7 days/yr
- Hot days in 30 yrs
- 17 days/yr
Wind risk 1/10 · Minimal
- Chance of severe wind over 30 yrs
- —
Air-quality risk 3/10 · Minor
- Unhealthy air days now
- 1 days/yr
- Unhealthy air days in 30 yrs
- 4 days/yr
Risk factors via First Street. Map © Google.
Why this score? — see what drove the A- grade
The composite is a weighted blend of 9 inputs, each scored 0–100. Each bar is that input's sub-score; the figure is the points it added to the 100-point composite (weight × sub-score).
- Cash flow +30.0/30.0
- 1% rule +10.0/10.0
- DSCR +10.0/10.0
- Appreciation +10.0/10.0
- ARV discount +7.5/15.0
- Schools +5.1/10.0
- Livability +3.4/5.0
- Rent growth +2.5/5.0
- Condition / age +2.5/5.0
$65,000
🖨 Deal sheet 📄 Offer letter ✓ Due diligence
Listing remarks MLS
3 bedroom 2 full bath 2 story home located in LaBrae School District. The big update kitchen has newer cabinets & flooring. There is a first floor laundry room and a full bath. Large living room with rustic beams, a decorative fireplace plus a wood burner. The upstairs has 3 bedrooms and another full bath. Lots of storage areas found throughout the home. Huge covered front porch and a fully fenced 1/2 acre back yard with a shed. Some updates include: new roof 2017 w/ 30 year shingles, newer well pump, 6 updated vinyl windows, updated electric and wiring, updated walk out basement entry door. All appliances will stay: stove, refrigerator, washer & dryer. This home is the last house on a dead end road so there is no traffic. The septic has been inspected, the seller will pay for a new septic with an acceptable offer.
Key facts
- 0.44 acre lot
- Parking
- Built 1930
Property features AI
Finance
- Financial info: Annual taxes reported (2025): $881
Exterior
- Parking: Driveway; No garage; Unpaved parking
- Utilities: Well water; Septic tank
- Home design: 2-story home; Above-grade finished area reported as 1,230 (source: assessor)
- Construction: Aluminum siding; Asphalt, fiberglass, and metal roof materials; Block and stone foundation; Built year source: public records
- Exterior features: Front porch; Shed(s); Full chain link fence; Lot dimensions approximately 91 x 190
Interior
- Kitchen: Dishwasher
- Bedrooms: Total of 5 rooms (includes bedrooms and other living spaces)
- Bathrooms: 2 full bathrooms; 1 main-level bathroom
- Heating & cooling: Forced air heating (gas); Central air conditioning
- Interior features: Eat-in kitchen; Full basement with walk-out access and sump pump
- Laundry & utility: Main-level laundry
Neighborhood map
What this means for you Summary
Snapshot
- This is a 3-bed/2.0-bath single-family listed at $65k.
Deal economics
- At list price, monthly cash flow is $443 ($5k/yr) — positive.
- The deal already cash-flows at list — no discount required.
- Meets the 1% rule at list price ($1k rent vs $65k).
Location & tenants
- Location reads 68/100 on livability (#567 in OH) — a middle-class / working-renter tenant base. Strengths: crime A+, cost of living A+, housing A+; Watch: amenities F, commute F, employment F.
- Labrae Local (suburban): math 56% / reading 65% proficiency, ranked #288 of 656 in OH (top 44%) — acceptable for families but not a draw, mixed tenant base, ~2y average lease.
- Market conditions: 9 active listings in the ZIP; 129 units permitted in Trumbull County in 2024 (0 in 5+ unit buildings).
Forward outlook
- In year one you build about $7k of equity ($449 loan paydown + $6k appreciation (10.0% local appreciation)).
- Trumbull County population projected at -22% by 2050 — secular population decline; favor cash flow + early exit over multi-decade hold.
- At projected returns (10.0% appreciation + 3.0% rent growth), your $18k cash investment doubles in ~2 years — after that, you're playing with house money.
- By year 5, paydown + projected appreciation supports a ~$32k cash-out refi (75% LTV) — recoverable capital for the next deal without selling this one.
Negotiation context
- Only 3 days on market — expect competitive offers; lowballing is unlikely to land.
- 5 sale attempts since 10y ago with the ask held roughly flat each time — persistent listings suggest the price (not the market) is what's stuck; bring a comps-based counter.
- Current owner paid $50k; 30% above their basis — modest negotiation headroom, anchor on the comps not their cost.
Risks & watch-outs
- Watch-outs: built in 1930 — expect roof / HVAC / electrical / plumbing capex.
Questions for the listing agent
- Built in 1930 — when were the roof, HVAC, electrical panel, plumbing, and water heater last replaced?
- Is there a deadline driving the sale (1031 exchange, divorce, estate, relocation)? That informs how much negotiation room exists.
- Schools are A-rated — typically a magnet for longer-tenancy family renters. What's the average tenant stay here, and is there a school-zone premium baked into asking?
- What's the average days-on-market for RENTAL listings here right now (not sales)? A rising rental-DOM trend means longer vacancies and softer asking-rent achievability than the comps imply.
- What's the recent tenant-quality profile in this submarket — average credit score on applications, eviction rate, late-payment / NSF rate, and stable-employment percentage? A property-management company in the area should have these aggregated.
- How much new for-sale + rental construction is in the pipeline within 1–3 miles? Heavy new supply typically softens prices + rents 12–24 months out; constrained supply supports both.
Investment metrics
- 1% rule
- 1.72% ✓
- Cap rate
- 14.48%
- Cash-on-cash
- 29.24%
- DSCR
- 2.30
- GRM
- 4.8
CMA / ARV
- ARV (on-the-fly)
- $153,750
- Comps found
- 10
Show comp detail 10 sales within ~0.75 mi
| Address | Dist | Beds/Ba | Sqft | Sold | Price | $/sf | Match |
|---|---|---|---|---|---|---|---|
| 590 Ruth Ave | 0.04mi | 3/1.5 | 1,243 (+1%) | 3mo | $175,000 | $141 | 92 |
| 5394 Park Rd | 0.20mi | 3/1.0 | 1,238 (+1%) | 19mo | $145,000 | $117 | 69 |
| 410 Hobart Rd | 0.58mi | 3/2.0 | 1,240 (+1%) | 9mo | $155,000 | $125 | 64 |
| 580 Ruth Ave | 0.05mi | 3/1.0 | 1,367 (+11%) | 14mo | $140,000 | $102 | 63 |
| 728 Potic Dr | 0.54mi | 3/1.0 | 1,146 (-7%) | 2mo | $156,691 | $137 | 58 |
| 5305 Park Rd | 0.28mi | 3/1.0 | 1,056 (-14%) | 14mo | $103,900 | $98 | 48 |
| 5597 Eagle Crk | 0.64mi | 3/1.0 | 1,115 (-9%) | 7mo | $152,000 | $136 | 45 |
| 366 Pangborn Rd | 0.53mi | 2/1.0 (-1) | 1,155 (-6%) | 17mo | $129,900 | $112 | 42 |
| 250 Homeview Ave | 0.35mi | 2/1.0 (-1) | 1,056 (-14%) | 18mo | $155,000 | $147 | 36 |
| 541 N Leavitt Rd | 0.54mi | 3/1.0 | 1,392 (+13%) | 18mo | $48,200 | $35 | 34 |
Match score weights: distance 35% · size 25% · config 20% · recency 20%. Top-matched comps best support the ARV.
Projected returns pro-forma
10.0% appreciation · 3.0% rent growth · sell at horizon
- IRR
- 46.5%
- Equity multiple
- 4.50×
- Total profit
- $63,658
- Equity at exit
- $58,557
- IRR
- 40.4%
- Equity multiple
- 10.08×
- Total profit
- $165,274
- Equity at exit
- $126,281
Cash invested: $18,200 (down + closing). Projections, not guarantees.
Landlord ↔ Tenant lean methodology
- Overall (STATE)
- 73 Landlord-Friendly
- State Ohio
- 73 Landlord-Friendly · R+6
- County
- — inherits STATE
- City
- — inherits STATE
ZIP-level market 44430
- Home prices YoY
- 8.9%
- Active inventory
- 9
- Price-to-rent
- 4.8×
Monthly cashflow live
- Estimated rent
- $1,120 medium interval (Pro) →
- Mortgage (P&I)
- −$341
- Tax from tax record
- −$73 /mo · $881/yr
- Insurance
- −$27
- HOA
- −$0
- Vacancy / Maint / Mgmt
- −$235
- Net cashflow
- $443
Break-even live
UW: 25.0% down · 7.5% · 30yr · 1.5% tax · 5.0% vac · 8.0% maint · 8.0% mgmt
Financing live
Cash to close
- Down payment
- $16,250
- Closing costs
- $1,950
- Reserves months
- —
- Total cash needed
- —
Loan-product check · same deal, 3 products live
Conventional
25% down · 7.5% · 30yr
- Down + closing
- —
- Monthly P&I
- —
- Monthly cashflow
- —
- DSCR
- —
- Eligible?
- —
Personal DTI + credit; lowest rate.
DSCR
20% down · 8.5% · 30yr
- Down + closing
- —
- Monthly P&I
- —
- Monthly cashflow
- —
- DSCR
- —
- Eligible?
- —
No personal income docs; deal must DSCR.
Hard money
10% down · 12.0% · 12mo
- Down + closing
- —
- Monthly P&I
- —
- Monthly cashflow
- —
- DSCR
- —
- Eligible?
- —
Short-term bridge; refi at stabilization.
Listing history 4 events
-
2026-06-19days on market $65,000 Active 3 DOM
-
2026-06-18days on market $65,000 Active 2 DOM
-
2026-06-16remarks 693-char remark
-
2026-06-16$65,000 Active 1 DOM
ⓘ Source: listings_history table (triggers on properties + properties_extension) + one-shot
backfill from property_details.listing_events for pre-trigger history.
Tax reassessment forecast OH · Partial reset (capped growth)
- Current annual tax
- $881 · $73/mo
- Projected year-2 tax
- $948 · $79/mo
- Expected delta
- +$66/yr (+$6/mo · 7.5%)
ⓘ Screening estimate from a state-policy table — verify with the county assessor before closing.
Climate risk First Street
- Flood 1/10 Low FEMA zone X (unshaded) · 0% chance over 30 yrs
- Wildfire 1/10 Low
- Heat 3/10 Moderate 7 d/yr ≥97°F today · 17 d/yr by 30 yrs out
- Wind 1/10 Low
- Air quality 3/10 Moderate 1 unhealthy d/yr today · 4 by 30 yrs out
Nearby sold comps map
Loading sold comps map…
Walkable amenities ~0.75 mi
Loading nearby amenities…
Taxation est. · year 1
- Rental income
- $13,441
- − Mortgage interest
- −$3,641
- − Property taxes
- −$881
- − Insurance
- −$325
- − Repairs & maintenance
- −$1,075
- − Management
- −$1,075
- − Depreciation
- −$1,891
- Taxable income
- $4,552
- Est. tax owed @ 24.0%
- −$1,093
- After-tax cash flow
- $4,229/yr
For passive investors: Depreciation is non-cash, so a rental often shows a tax loss while cash-flowing — sheltering income. Rental losses are passive: they offset passive income freely, and up to $25,000/yr can offset ordinary (W-2) income if you actively participate and your MAGI is under $100k (phasing out to $0 by $150k); unused losses carry forward. On sale, claimed depreciation is recaptured at up to 25%, and gains may owe capital-gains tax (a 1031 exchange can defer both). Figures are a year-1 estimate at your 24.0% rate — not tax advice; consult a CPA.
Schools (NCES district)
- District
- Labrae Local
- NCES district ID
- 3905024
- Math proficiency
- 56% ▼ -10.00%
- Reading proficiency
- 65% ▼ -5.00%
- Median HH income
- $46,322
- Composite
- 51.11/100
- National rank
- #1766
- State rank
- #288 of 656 in OH
Livability — Leavittsburg
- Score
- 68/100
- State rank
- #567
- US rank
- #9723
Category grades
Schools grade is shown separately in the Schools card above.
Census & demographics
- Census place
- Leavittsburg, OH
- County
- Trumbull · 193,293 people
- Metro
- Youngstown-Warren, OH
- Population (ZIP)
- 4,554
- Household income
- $57,500
- Rent vs Own
- Severe rent burden
- 18.6
Population outlook (Trumbull County) Hauer SSP2
- Today (2025)
- 191,696 people
- By 2030
- 184,015 · -4.0%
- By 2040
- 166,810 · -13.0%
- By 2050
- 149,857 · -21.8%
- By 2075
- 115,769 · -39.6%
- By 2100
- 83,617 · -56.4%
Race, ethnicity, and origin ACS 2023
- Neighborhood character
- Predominantly White (76%)
- Race & ethnicity
- White 76% Black 15% Two or more races 8% Hispanic / Latino 4%
- Common ancestry
- Romanian 2% Lithuanian 1% Italian 1%
- Foreign-born
- 1% · Canada
- Languages at home
- 98% English-only · Spanish 2%
Political lean MEDSL · Trumbull
- 2024 margin
- R (+16.8) · D 41.2% · R 58.0%
- 2008→2024 swing
- -39.2pp toward R · 2008: 22.4pp · 2024: -16.8pp
- All cycles
- 2024: R+16.8 2020: R+10.6 2016: R+6.4 2012: D+22.2 2008: D+22.4
Not yet ingested
- Civics
- —
Market trends
- HPI YoY
- ▲ 19.30%
- Current HPI
- 235.3891
- Rent YoY
- —
- Metro
- —
- State GDP YoY
- ▲ 1.98%
- F500 in state
- 48
Industry mix (Fortune 500 HQ in OH)
| Industry | F500 HQs | Revenue |
|---|---|---|
| Insurance | 3 | $145B |
|
||
| Industrial Machinery | 3 | $49B |
|
||
| Financial Services | 3 | $24B |
|
||
| Consumer Goods | 2 | $93B |
|
||
| Aerospace / Defense | 2 | $47B |
|
||
| Utilities | 2 | $33B |
|
||
Price history
+132.1% since first listed17 events — show timeline
- 2026-06-15 Listed $65,000 MLSNOW
- 2022-01-20 Sold (Public Records) $50,000 Public Records
- 2022-01-19 Sold (MLS) $50,000 MLSNOW
- 2021-12-17 Pending — MLSNOW
- 2021-12-03 Price Changed $59,900 MLSNOW
- 2021-11-23 Relisted — MLSNOW
- 2021-11-09 Contingent — MLSNOW
- 2021-10-10 Price Changed $69,900 MLSNOW
- 2021-10-03 Listed $79,900 MLSNOW
- 2019-08-11 Listing Removed — MLSNOW
- 2019-07-17 Price Changed $49,900 MLSNOW
- 2019-06-06 Listed $59,900 MLSNOW
- 2016-06-29 Sold (MLS) $31,500 MLSNOW
- 2016-04-28 Pending — MLSNOW
- 2016-04-07 Listed $39,900 MLSNOW
- 1989-11-30 Sold (Public Records) $49,000 Public Records
- 1986-10-20 Sold (Public Records) $28,000 Public Records
Property tax history
+6.1%/yrLatest (2025): $881 · -20.0% YoY. Source: county tax records.
Cash-flow waterfall
monthlySold comps — $/sqft
last 12 mo · ≤1 miLoading sold comps…