 Multi-family
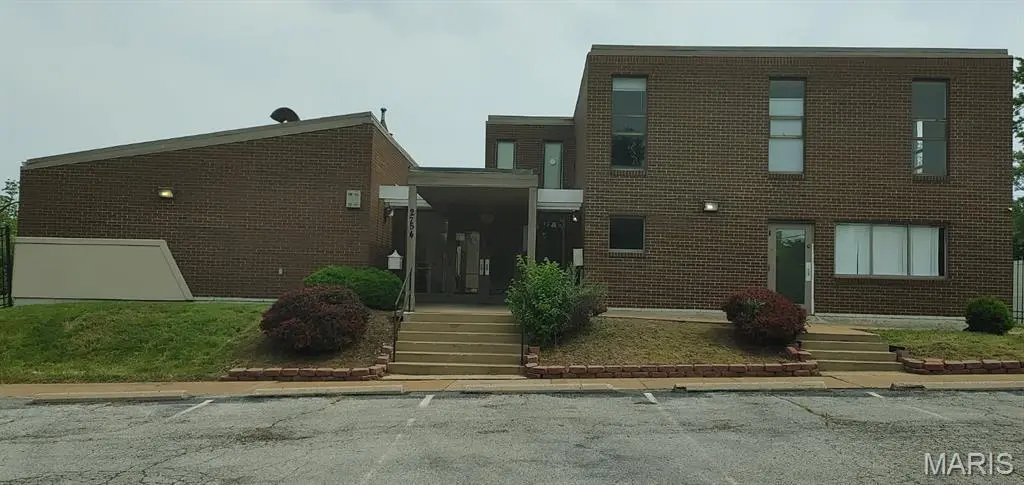
2754 Bacon St · St. Louis, MO
Flood risk No data
- FEMA flood zone
- —
- Chance of flooding over 30 yrs
- —
- Est. flood insurance / yr
- —
Fire risk No data
- Est. fire insurance / yr
- —
Heat risk No data
- Hot days now (above threshold)
- —
- Hot days in 30 yrs
- —
Wind risk No data
- Chance of severe wind over 30 yrs
- —
Air-quality risk No data
- Unhealthy air days now
- —
- Unhealthy air days in 30 yrs
- —
Risk factors via First Street. Map © Google.
Why this score? — see what drove the B grade
The composite is a weighted blend of 9 inputs, each scored 0–100. Each bar is that input's sub-score; the figure is the points it added to the 100-point composite (weight × sub-score).
- Cash flow +30.0/30.0
- 1% rule +10.0/10.0
- DSCR +10.0/10.0
- ARV discount +7.5/15.0
- Appreciation +6.0/10.0
- Rent growth +2.5/5.0
- Livability +2.5/5.0
- Condition / age +2.2/5.0
- Schools +1.2/10.0
$369,900
🖨 Deal sheet 📄 Offer letter ✓ Due diligence
Multi-family units
County records classify this as Multi-Family (2-4 Unit). Listing-text estimate: 1 unit. estimate disagrees with records
Listing remarks
Open the door and let your creative juices flow! With a total of 10 rooms, 5 bathrooms, kitchen, cafe lounge, and a recreation room big enough to fit a NFL football team the possibilities are endless! This commercial building was formerly utilized as a nursing facility, but has the versatility to be so much more! I’m talking a beauty or barber school, home health care facility, vendor warehouse, salon with individual leased suites, multi-family with leased rooms and shared kitchen, etc! There’s tons of storage areas along with an attached garage. The second level is waiting on your finishing touches. Property is being sold in As-is condition with the Seller to complete no inspe
Key facts
- Cafe lounge
- Recreation room
- Attached garage
Tags
Property features AI
Finance
- Other: Address: 2754 Bacon St, St. Louis, MO 63106
- Financial info: No second mortgage reported; Seller may consider concessions; Annual tax noted (for reference only): $2,913 (2024)
Exterior
- Parking: Attached garage
- Utilities: Electric service by Ameren
- Home design: Residential income property; Five-family (5+ units)
- Construction: Brick construction
- Exterior features: Lot approximately 0.622 acre; Neighborhood: Jeff-Vander-Lou
Interior
- Bedrooms: No main or upper level bedrooms listed
- Bathrooms: No main or upper level bathrooms listed
- Heating & cooling: Central air; Ceiling fans
- Interior features: Ceiling fans; Central air
- Laundry & utility: Laundry on the main level
Neighborhood map
What this means for you Summary
Snapshot
- This is a multifamily listed at $370k. Condition is rated fair.
Deal economics
- At list price, monthly cash flow is $7k ($80k/yr) — positive.
- The deal already cash-flows at list — no discount required.
- Meets the 1% rule at list price ($12k rent vs $370k).
- Recommended offer: $326k (12.0% below list) — sets the bar for market timing.
- Cap rate 27.8% vs local median 5.0% in St. Louis — top-decile yield for the area; either an underpriced asset or a hidden risk that comps aren't pricing in. Stress-test before assuming the spread holds.
Location & tenants
- Location reads: area grade B — affects rentability + tenant quality, not the cash-flow math above.
- St. Louis City (urban): math 10% / reading 18% proficiency, ranked #312 of 324 in MO (top 96%) — low school quality limits family demand, transient renter base, plan for 1-2y turnover; 80% free/reduced lunch — lower-income household profile, screen leases tightly.
- Zoned schools: Columbia Elem. Comm. Ed. Ctr. (math 2% / reading 12%, grade F, #1,058 of 1,115 statewide, top 96%, 221 students, 99% FRL); Vashon High (math 2% / reading 2%, grade F, #520 of 521 statewide, top 100%, 568 students, 100% FRL) — zoned schools average 99% FRL vs 80% district-wide (19 pts higher); higher-poverty schools than district average — tighter screening recommended.
- Market conditions: 15 active listings in the ZIP; 40 comparable units currently listed for rent nearby; rentals at typical pace (median 24d on market — plan ~3-4 weeks tenant-placement turnaround); 45% of comp listings sitting > 30 days — soft ceiling on asking rent; 294 units permitted in St. Louis city in 2024 (227 in 5+ unit buildings).
Forward outlook
- In year one you build about $10k of equity ($3k loan paydown + $7k appreciation (1.9% local appreciation)).
- St. Louis County population projected to shrink 6% by 2050 — rents likely to lag national; underwrite the cash flow, not the appreciation.
- At projected returns (1.9% appreciation + 3.0% rent growth), your $104k cash investment doubles in ~2 years — after that, you're playing with house money.
- By year 4, paydown + projected appreciation supports a ~$33k cash-out refi (75% LTV) — recoverable capital for the next deal without selling this one.
Negotiation context
- It's been on market 228 days — a 12% lower offer ($326k) is reasonable based on typical stale-listing flexibility.
- 2 sale attempts; this cycle's ask has dropped $60k (14%) from the opening price — seller is motivated, your offer sets the floor, not the list.
Questions for the listing agent
- It's been on market 228 days. Have you received any prior offers? Is the seller open to a 12% concession, seller financing, or rate buy-down credit?
- Have any recent inspections been done? Can we get a copy of the seller's disclosures and any deferred-maintenance estimates?
- Built in 1971 — when were the roof, HVAC, electrical panel, plumbing, and water heater last replaced?
- Why hasn't it sold? Are there any deal-killer items the seller is aware of (foundation, flood, title, zoning, code violations)?
- Is there a deadline driving the sale (1031 exchange, divorce, estate, relocation)? That informs how much negotiation room exists.
- What's the average days-on-market for RENTAL listings here right now (not sales)? A rising rental-DOM trend means longer vacancies and softer asking-rent achievability than the comps imply.
- What's the recent tenant-quality profile in this submarket — average credit score on applications, eviction rate, late-payment / NSF rate, and stable-employment percentage? A property-management company in the area should have these aggregated.
- How much new apartment / multifamily construction is in the pipeline within 1–3 miles? Heavy new supply (>2% of stock underway) typically softens rents 12–24 months out; light construction supports rent growth.
Investment metrics
- 1% rule
- 3.14% ✓
- Cap rate
- 27.81%
- Cash-on-cash
- 76.85%
- DSCR
- 4.42
- GRM
- 2.7
CMA / ARV
- ARV (median comp)
- $57,385
- List price
- $369,900
- Delta
- 544.59%
- Verdict
- OVERPRICED
- Comps
- 20 within 1.0 mi
Show comp detail 12 sales within ~0.75 mi
| Address | Dist | Beds/Ba | Sqft | Sold | Price | $/sf | Match |
|---|---|---|---|---|---|---|---|
| 2902 Sullivan Ave | 0.35mi | —/— | 2,658 | 1mo | $40,000 | $15 | 70 |
| 3843 Saint Ferdinand Ave | 0.42mi | 6/2.0 | 2,788 | 1mo | $325,000 | $117 | 67 |
| 2901 Greer Ave | 0.33mi | 12/4.0 | 5,886 | 8mo | $90,000 | $15 | 66 |
| 3858 Greer Ave | 0.49mi | —/— | 3,156 | 0mo | $160,000 | $51 | 64 |
| 3840 Saint Louis Ave | 0.40mi | 5/3.0 | 2,880 | 11mo | $55,000 | $19 | 60 |
| 2927 Natural Bridge Ave | 0.58mi | 4/2.0 | 2,110 | 2mo | $25,000 | $12 | 59 |
| 4023 Kennerly Ave | 0.64mi | 8/4.0 | 1,936 | 4mo | $70,000 | $36 | 54 |
| 3920 Ashland Ave | 0.62mi | —/— | — | 6mo | $80,000 | — | 54 |
| 2535 W Hebert St | 0.57mi | —/— | 13,344 | 9mo | $200,000 | $15 | 53 |
| 2529 W Hebert St | 0.58mi | —/— | 13,344 | 9mo | $200,000 | $15 | 53 |
| 3939 Greer Ave | 0.59mi | —/— | 2,756 | 10mo | $89,900 | $33 | 51 |
| 3965 Ashland Ave | 0.71mi | 12/4.0 | 2,678 | 10mo | $134,900 | $50 | 46 |
Match score weights: distance 35% · size 25% · config 20% · recency 20%. Top-matched comps best support the ARV.
Projected returns pro-forma
1.91% appreciation · 3.0% rent growth · sell at horizon
- IRR
- 80.5%
- Equity multiple
- 5.31×
- Total profit
- $446,244
- Equity at exit
- $144,037
- IRR
- 80.8%
- Equity multiple
- 10.89×
- Total profit
- $1,024,095
- Equity at exit
- $205,994
Cash invested: $103,572 (down + closing). Projections, not guarantees.
Landlord ↔ Tenant lean methodology
- Overall (STATE)
- 81 Strongly Landlord-Friendly
- State Missouri
- 81 Strongly Landlord-Friendly · R+10
- County
- — inherits STATE
- City
- — inherits STATE
ZIP-level market 63106
- Home prices YoY
- 1.4%
- Active inventory
- 15
- Price-to-rent
- 26.5×
Monthly cashflow live
- Estimated rent
- $11,632 high interval (Pro) →
- Mortgage (P&I)
- −$1,940
- Tax est. 1.5%
- −$462 /mo · $5,548/yr
- Insurance
- −$154
- HOA
- −$0
- Vacancy / Maint / Mgmt
- −$2,443
- Net cashflow
- $6,633
Break-even live
10-unit breakdown (identical units grouped — click to expand)
| Units | Beds | Baths | Est. rent |
|---|---|---|---|
| 10× units | 1 | 1 | $11,630 |
| #1 | 1 | 1 | $1,163 |
| #2 | 1 | 1 | $1,163 |
| #3 | 1 | 1 | $1,163 |
| #4 | 1 | 1 | $1,163 |
| #5 | 1 | 1 | $1,163 |
| #6 | 1 | 1 | $1,163 |
| #7 | 1 | 1 | $1,163 |
| #8 | 1 | 1 | $1,163 |
| #9 | 1 | 1 | $1,163 |
| #10 | 1 | 1 | $1,163 |
| Total (10 units) | $11,632 | ||
UW: 25.0% down · 7.5% · 30yr · 1.5% tax · 5.0% vac · 8.0% maint · 8.0% mgmt
Financing live
Cash to close
- Down payment
- $92,475
- Closing costs
- $11,097
- Reserves months
- —
- Total cash needed
- —
Loan-product check · same deal, 3 products live
Conventional
25% down · 7.5% · 30yr
- Down + closing
- —
- Monthly P&I
- —
- Monthly cashflow
- —
- DSCR
- —
- Eligible?
- —
Personal DTI + credit; lowest rate.
DSCR
20% down · 8.5% · 30yr
- Down + closing
- —
- Monthly P&I
- —
- Monthly cashflow
- —
- DSCR
- —
- Eligible?
- —
No personal income docs; deal must DSCR.
Hard money
10% down · 12.0% · 12mo
- Down + closing
- —
- Monthly P&I
- —
- Monthly cashflow
- —
- DSCR
- —
- Eligible?
- —
Short-term bridge; refi at stabilization.
Rent comps 40 comps
| Address | Beds | Baths | Sqft | Rent | $/sqft | DOM | Units | Dist |
|---|---|---|---|---|---|---|---|---|
| 3644 Natural Bridge Ave Apt 203 St. Louis, MO | 1.0 | 1.0 | 570 | $680 | $1.19 | 43d | 1 | 0.60mi |
| 3644 Natural Bridge Ave Apt 303 St. Louis, MO | 1.0 | 1.0 | 710 | $825 | $1.16 | 43d | 1 | 0.60mi |
| 3516 Russell Blvd Saint Louis, MO | 1.0 | 1.0 | 560 | $875 | $1.56 | 7d | 1 | 0.62mi |
| 3201 Barrett St Unit 3905-C St. Louis, MO | 2.0 | 1.0 | — | $850 | — | 43d | 1 | 0.74mi |
| 3127 Clay Ave Unit B St. Louis, MO | 1.0 | 1.0 | 3536 | $950 | $0.27 | 43d | 1 | 0.79mi |
| 2239 University St Saint Louis, MO | 3.0 | 1.5 | 1116 | $1,295 | $1.16 | 12d | 1 | 0.80mi |
| 2603 Belle Glade Ave Saint Louis, MO | 2.0 | 1.0 | 945 | $800 | $0.85 | 4d | 1 | 0.81mi |
| 2601 Whittier St Saint Louis, MO | 1.0–2.0 | 1.0 | — | $1,019 | — | 43d | 1 | 0.91mi |
| 4247 Maffitt Ave St. Louis, MO | 3.0 | 1.5 | 1700 | $1,000 | $0.59 | 4d | 1 | 0.96mi |
| 3819 Kossuth Ave Saint Louis, MO | 1.0 | 1.5 | 816 | $725 | $0.89 | 23d | 1 | 0.98mi |
| 2207 Angelica St Unit 1 St. Louis, MO | 2.0 | 1.0 | 1734 | $1,350 | $0.78 | 43d | 1 | 0.99mi |
| 1708 Annie Malone Dr Saint Louis, MO | 3.0 | 1.5 | 924 | $1,500 | $1.62 | 43d | 1 | 1.01mi |
| 4202 Gano Ave Saint Louis, MO | 3.0 | 1.0 | 1650 | $1,168 | $0.71 | 23d | 1 | 1.08mi |
| 4223 W Labadie Ave Saint Louis, MO | 2.0 | 1.0 | — | $950 | — | 7d | 1 | 1.11mi |
| 1910 Agnes St Saint Louis, MO | 3.0 | 1.0 | 704 | $1,200 | $1.70 | 43d | 1 | 1.15mi |
| 3041 Locust St St. Louis, MO | 2.0 | 2.0 | 1243 | $2,072 | $1.67 | 43d | 1 | 1.15mi |
| 3307 Olive St St. Louis, MO | 1.0–2.0 | 1.0 | 912 | $1,220 | $1.34 | 43d | 1 | 1.20mi |
| 1523 Angelrodt St Saint Louis, MO | 2.0 | 1.0 | 3049 | $1,000 | $0.33 | 17d | 1 | 1.21mi |
| 2605-2637 Washington Ave St. Louis, MO | 1.0–2.0 | 1.0–2.0 | 775 | $1,645 | $2.12 | 12d | 7 | 1.27mi |
| 3717-3721 Westminster Pl St. Louis, MO | 3.0 | 1.0–3.0 | 1343 | $2,098 | $1.56 | 16d | 4 | 1.27mi |
| 3681 Lindell Blvd Saint Louis, MO | 3.0 | 1.0–2.5 | 1292 | $2,818 | $2.18 | 1d | 62 | 1.28mi |
| 2647 Locust St St. Louis, MO | 1.0 | 1.5 | 2168 | $2,950 | $1.36 | 43d | 1 | 1.30mi |
| 4301 E Warne Ave St. Louis, MO | 1.0 | 1.0 | 550 | $525 | $0.95 | 43d | 1 | 1.31mi |
| 3701 Lindell Blvd Saint Louis, MO | 3.0 | 1.0–3.0 | 1073 | $1,963 | $1.83 | 1d | 128 | 1.31mi |
| 3701 Lindell Blvd Saint Louis, MO | 3.0 | 1.0–3.0 | 1073 | $1,966 | $1.83 | 16d | 81 | 1.31mi |
| 2650 Locust St St. Louis, MO | 1.0 | 1.0 | 780 | $1,375 | $1.76 | 3d | 2 | 1.32mi |
| 2046 Obear Ave Unit A St. Louis, MO | 3.0 | 1.5 | 1456 | $1,070 | $0.73 | 43d | 1 | 1.32mi |
| 2206 Lucas Ave St. Louis, MO | 1.0–2.0 | 1.0–2.0 | 1047 | $1,900 | $1.81 | 1d | 20 | 1.35mi |
| 2323 Locust St Saint Louis, MO | 1.0–2.0 | 1.0 | 1239 | $1,750 | $1.41 | 43d | 2 | 1.35mi |
| 2323 Locust ST #308 St Louis, MO | 2.0 | 1.0 | 1386 | $1,750 | $1.26 | 23d | 1 | 1.35mi |
| 416 N 23rd St St. Louis, MO | 1.0–2.0 | 1.0 | 780 | $1,775 | $2.28 | 4d | 23 | 1.38mi |
| 715 N 21st St St. Louis, MO | 1.0–2.0 | 1.0–2.0 | 900 | $1,355 | $1.51 | 23d | 1 | 1.39mi |
| 2002 Obear Ave St. Louis, MO | 2.0 | 1.5 | 1024 | $970 | $0.95 | 4d | 1 | 1.39mi |
| 4140 Washington Blvd Saint Louis, MO | 1.0–2.0 | 1.0–2.5 | 907 | $2,035 | $2.24 | 1d | 1 | 1.41mi |
| 4140 Washington Blvd Saint Louis, MO | 1.0 | 1.0 | 495 | $1,010 | $2.04 | 43d | 6 | 1.41mi |
| 2217 Locust St Saint Louis, MO | 2.0 | 2.0 | 830 | $1,475 | $1.78 | 43d | 1 | 1.42mi |
| 2034 Lucas Ave St. Louis, MO | 1.0–2.0 | 1.0 | 1080 | $1,525 | $1.41 | 43d | 1 | 1.43mi |
| 1906 Obear Ave #1 St. Louis, MO | 2.0 | 1.5 | 1024 | $970 | $0.95 | 22d | 1 | 1.45mi |
| 2200 Locust St Saint Louis, MO | 1.0–2.0 | 1.0–1.5 | 862 | $1,695 | $1.97 | 3d | 6 | 1.46mi |
| 4129 Turner Ave Saint Louis, MO | 3.0 | 1.0 | — | $499 | — | 43d | 1 | 1.47mi |
Listing history 8 events
-
2026-05-31days on market $369,900 Active 228 DOM
-
2026-04-14status Active
-
2026-03-01price $369,900
-
2026-02-07price $379,900
-
2025-12-07price $400,000
-
2025-11-07price $410,000
-
2025-10-14$429,900 Active
-
2025-10-14historical $429,900
ⓘ Source: listings_history table (triggers on properties + properties_extension) + one-shot
backfill from property_details.listing_events for pre-trigger history.
Nearby sold comps map
Loading sold comps map…
Walkable amenities ~0.75 mi
Loading nearby amenities…
Taxation est. · year 1
- Rental income
- $139,584
- − Mortgage interest
- −$20,720
- − Property taxes
- −$5,548
- − Insurance
- −$1,850
- − Repairs & maintenance
- −$11,167
- − Management
- −$11,167
- − Depreciation
- −$10,761
- Taxable income
- $78,372
- Est. tax owed @ 24.0%
- −$18,809
- After-tax cash flow
- $60,787/yr
For passive investors: Depreciation is non-cash, so a rental often shows a tax loss while cash-flowing — sheltering income. Rental losses are passive: they offset passive income freely, and up to $25,000/yr can offset ordinary (W-2) income if you actively participate and your MAGI is under $100k (phasing out to $0 by $150k); unused losses carry forward. On sale, claimed depreciation is recaptured at up to 25%, and gains may owe capital-gains tax (a 1031 exchange can defer both). Figures are a year-1 estimate at your 24.0% rate — not tax advice; consult a CPA.
Condition & rehab AI · 6 photos
This multi-family property requires moderate rehabilitation, focusing on exterior and interior painting to enhance its curb appeal and resale value.
Repairs flagged
- Major exterior brick — Weathered and in need of repainting
- Minor interior walls — Painted walls show signs of wear
Value-add opportunities
- Both Paint exterior — Enhances curb appeal and resale value
- Both Paint interior walls — Improves interior appearance and resale value
Renovation cost estimate screening
| Repair item | Severity | Est. cost |
|---|---|---|
| exterior brick · Weathered and in need of repainting | Major | $15,000–50,000 |
| interior walls · Painted walls show signs of wear | Minor | $500–3,000 |
| Total estimated repair cost · 2 items | $15,500–53,000 |
Value-add ROI direction
- Both Paint exterior — Enhances curb appeal and resale value ↑
- Both Paint interior walls — Improves interior appearance and resale value ↑
ⓘ Cost ranges are severity-bucket heuristics (US national rule-of-thumb). Get contractor quotes + a written scope before underwriting a rehab budget.
Schools (NCES district)
- District
- St. Louis City
- NCES district ID
- 2929280
- Math proficiency
- 10% ▼ -6.00%
- Reading proficiency
- 18% ▼ -3.00%
- Median HH income
- $35,685
- Composite
- 11.54/100
- National rank
- #9699
- State rank
- #312 of 324 in MO
Livability — St. Louis
No livability data for this city. (Only ~50 U.S. cities are tracked.)
Census & demographics
- Census place
- St. Louis, MO
- City population
- 283,259
- Population (ZIP)
- 7,742
Population outlook (St. Louis County) Hauer SSP2
- Today (2025)
- 315,737 people
- By 2030
- 313,865 · -0.6%
- By 2040
- 305,439 · -3.3%
- By 2050
- 296,529 · -6.1%
- By 2075
- 271,028 · -14.2%
- By 2100
- 255,359 · -19.1%
Race, ethnicity, and origin ACS 2023
- Neighborhood character
- Predominantly Black (89%)
- Race & ethnicity
- Black 89% White 7% Two or more races 2% Hispanic / Latino 2%
- Foreign-born
- 5% · Canada
- Languages at home
- 93% English-only · Spanish 2%
Political lean MEDSL · St. Louis
- 2024 margin
- Solid D (+64.7) · D 81.4% · R 16.7% · Other 2.0%
- 2008→2024 swing
- -3.5pp toward R · 2008: 68.2pp · 2024: 64.7pp
- All cycles
- 2024: D+64.7 2020: D+66.2 2016: D+63.7 2012: D+66.6 2008: D+68.2
Not yet ingested
- Civics
- —
Market trends
- HPI YoY
- ▲ 1.91%
- Current HPI
- 133.284
- Rent YoY
- —
- Metro
- —
- State GDP YoY
- ▲ 1.84%
- F500 in state
- 20
Industry mix (Fortune 500 HQ in MO)
| Industry | F500 HQs | Revenue |
|---|---|---|
| Healthcare | 1 | $163B |
|
||
| Insurance | 1 | $21B |
|
||
| Industrial Technology | 1 | $17B |
|
||
| Retail | 1 | $16B |
|
||
| Industrial Distribution | 1 | $10B |
|
||
| Utilities | 1 | $9B |
|
||
Price history
-14.0% since first listed7 events — show timeline
- 2026-04-14 Relisted — MARIS as Distributed by MLS Grid
- 2026-03-01 Price Changed $369,900 MARIS as Distributed by MLS Grid
- 2026-02-07 Price Changed $379,900 MARIS as Distributed by MLS Grid
- 2025-12-07 Price Changed $400,000 MARIS as Distributed by MLS Grid
- 2025-11-07 Price Changed $410,000 MARIS as Distributed by MLS Grid
- 2025-10-14 Listed $429,900 MARIS as Distributed by MLS Grid
- 2025-10-14 Coming Soon $429,900 MARIS as Distributed by MLS Grid
Cash-flow waterfall
monthlySold comps — $/sqft
last 12 mo · ≤1 miLoading sold comps…