7751 Sea Level Dr · East Milton, FL
Flood risk No data
- FEMA flood zone
- —
- Chance of flooding over 30 yrs
- —
- Est. flood insurance / yr
- —
Fire risk No data
- Est. fire insurance / yr
- —
Heat risk No data
- Hot days now (above threshold)
- —
- Hot days in 30 yrs
- —
Wind risk No data
- Chance of severe wind over 30 yrs
- —
Air-quality risk No data
- Unhealthy air days now
- —
- Unhealthy air days in 30 yrs
- —
Risk factors via First Street. Map © Google.
Why this score? — see what drove the D+ grade
The composite is a weighted blend of 9 inputs, each scored 0–100. Each bar is that input's sub-score; the figure is the points it added to the 100-point composite (weight × sub-score).
- Cash flow +11.0/30.0
- ARV discount +11.0/15.0
- Schools +5.3/10.0
- Condition / age +4.0/5.0
- Livability +3.9/5.0
- Rent growth +3.6/5.0
- 1% rule +3.2/10.0
- DSCR +3.2/10.0
- Appreciation +0.0/10.0
$283,490
🖨 Deal sheet (PDF) 📄 Offer letter ✓ Due diligence
Listing remarks
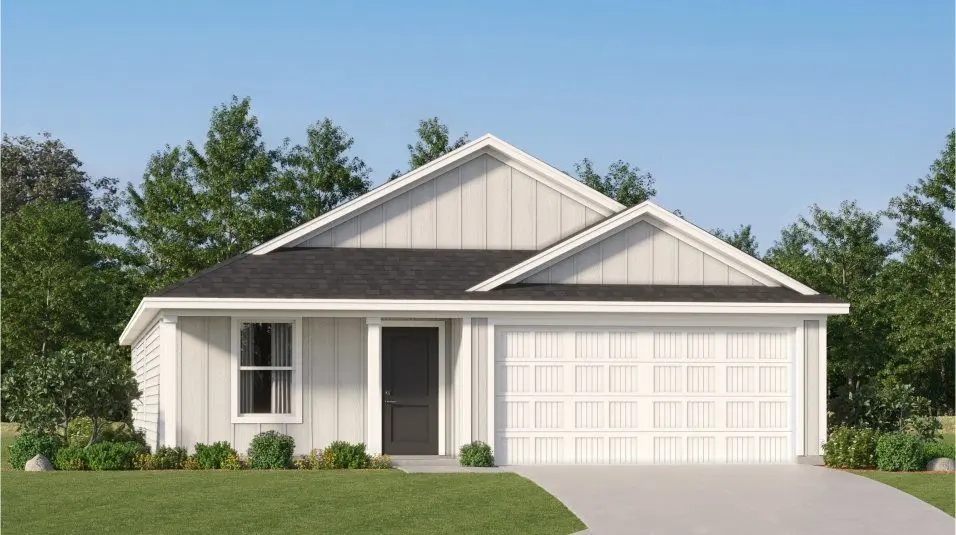
This single-level home showcases a spacious open floorplan shared between the kitchen, dining area and family room for easy entertaining. An owner's suite enjoys a private location in a rear corner of the home, complemented by an en-suite bathroom and walk-in closet. There are three secondary bedrooms at the front of the home, which are comfortable spaces for household members and overnight guests.
Key facts
- Walk-in closet
- Open floorplan
- En-suite bathroom
Tags
Property features AI
Finance
- Other: Address: 7751 Sea Level Dr, Milton FL 32583; Listing provided by Zillow; information deemed reliable but not guaranteed
- Financial info: List price provided
Exterior
- Home design: Single-family home; Active listing
- Construction: Built as part of a new construction inventory (Spec); Oxford plan
- Exterior features: Living area approximately 1,707 (living area value provided)
Interior
- Bedrooms: 4 bedrooms
- Bathrooms: 2 full bathrooms
- Interior features: Spec new-construction home (Oxford plan)
Neighborhood map
What this means for you Summary
Snapshot
- This is a 4-bed/2.0-bath single-family listed at $283k. Condition is rated good.
Deal economics
- At list price, monthly cash flow is $-117 ($-1k/yr) — negative.
- To cash-flow at today's rent, offer at most $267k (6.0% below list).
- To meet the 1% rule (rent ≥ 1% of price), the offer needs to be $233k (17.7% below list).
- Recommended offer: $233k (17.7% below list) — sets the bar for 1% rule.
- Cap rate 5.8% vs local median 4.6% in East Milton — meaningfully above typical; check what's discounted (condition, days-on-market, listing class) to confirm the premium yield is real.
Location & tenants
- Location reads 77/100 on livability (#199 in FL, #3,139 nationally) — a middle-class / working-renter tenant base. Strengths: cost of living A+, housing A+, health & safety A+; Watch: crime C-, amenities C-, commute F.
- Santa Rosa (suburban): math 63% / reading 60% proficiency, ranked #8 of 73 in FL (top 11%) — acceptable for families but not a draw, mixed tenant base, ~2y average lease.
- Zoned schools: Martin Luther King Middle School (math 38% / reading 41%, grade F, #373 of 571 statewide, top 66%, 660 students, 69% FRL); Milton High School (math 44% / reading 42%, grade F, #255 of 667 statewide, top 39%, 2,085 students, 54% FRL) — zoned schools average 62% FRL vs 36% district-wide (25 pts higher); higher-poverty schools than district average — tighter screening recommended.
- Zoned-school proficiency averages 41% at this address vs 62% district-wide (-20 pts) — the specific schools serving this property underperform the Santa Rosa average; the district grade overstates school quality for this exact location.
- Market conditions: Rents rising fast (+4.5%/yr); 822 active listings in the ZIP; 1 comparable units currently listed for rent nearby; solid renter incomes; 1,983 units permitted in Santa Rosa County in 2024 (128 in 5+ unit buildings).
- This rent runs 33% of the median local income ($85k/yr) — at the standard rent-burdened threshold; future hikes will face affordability resistance.
Forward outlook
- Local home prices are declining (-3.0%/yr); year-one equity from $2k of loan paydown is wiped out by about $9k of value loss. Plan a longer hold.
- Santa Rosa County population projected at +31% by 2050 — long-run rental-demand tailwind backs the buy-and-hold thesis.
Negotiation context
- It's been on market 33 days — a 3% lower offer ($275k) is reasonable based on typical stale-listing flexibility.
Questions for the listing agent
- What do current leases actually rent for vs. the listed asking? Can we see a recent rent roll and the last 12 months of T-12 income?
- It's been on market 33 days. Have you received any prior offers? Is the seller open to a 18% concession, seller financing, or rate buy-down credit?
- Is there a deadline driving the sale (1031 exchange, divorce, estate, relocation)? That informs how much negotiation room exists.
- Schools are B-rated — typically a magnet for longer-tenancy family renters. What's the average tenant stay here, and is there a school-zone premium baked into asking?
- The area grade is low — what's the realistic commute time and amenity access for the typical tenant pool here? Any planned neighborhood developments (good or bad) we should know about?
- What's the average days-on-market for RENTAL listings here right now (not sales)? A rising rental-DOM trend means longer vacancies and softer asking-rent achievability than the comps imply.
- What's the recent tenant-quality profile in this submarket — average credit score on applications, eviction rate, late-payment / NSF rate, and stable-employment percentage? A property-management company in the area should have these aggregated.
- How much new for-sale + rental construction is in the pipeline within 1–3 miles? Heavy new supply typically softens prices + rents 12–24 months out; constrained supply supports both.
Investment metrics
- 1% rule
- 0.82% ✗
- Cap rate
- 5.80%
- Cash-on-cash
- -1.77%
- DSCR
- 0.92
- GRM
- 10.1
CMA / ARV
- ARV (on-the-fly)
- $307,260
- Comps found
- 12
Show comp detail 12 sales within ~0.75 mi
| Address | Dist | Beds/Ba | Sqft | Sold | Price | $/sf | Match |
|---|---|---|---|---|---|---|---|
| 5341 Horizons Edge Ln Lot 5G | 0.05mi | 4/2.0 | 1,707 (0%) | 0mo | $292,509 | $171 | 97 |
| 7752 Sea Level Dr Lot 8F | 0.03mi | 4/2.0 | 1,707 (0%) | 2mo | $279,990 | $164 | 97 |
| 5315 Hidden Pines Cir | 0.27mi | 3/2.0 (-1) | 1,634 (-4%) | 1mo | $331,900 | $203 | 74 |
| 5327 Hidden Pines Cir | 0.29mi | 4/2.0 | 1,820 (+7%) | 1mo | $321,707 | $177 | 74 |
| 7633 Small Pines St | 0.33mi | 4/2.0 | 1,810 (+6%) | 1mo | $327,231 | $181 | 74 |
| 5338 Hidden Pines Cir | 0.33mi | 4/2.0 | 1,820 (+7%) | 1mo | $326,707 | $180 | 73 |
| 7768 Three Mile View Dr Lot 6G | 0.04mi | 3/2.0 (-1) | 1,474 (-14%) | 2mo | $264,990 | $180 | 69 |
| 5368 Horizons Edge Ln Lot 21A | 0.04mi | 3/2.0 (-1) | 1,474 (-14%) | 3mo | $265,190 | $180 | 68 |
| 5307 Hidden Pines Cir | 0.25mi | 3/2.0 (-1) | 1,530 (-10%) | 2mo | $312,000 | $204 | 64 |
| 7651 Small Pines St | 0.31mi | 4/2.0 | 1,920 (+12%) | 1mo | $341,131 | $178 | 64 |
| 5369 Hidden Pines Cir | 0.37mi | 4/2.0 | 1,920 (+12%) | 2mo | $337,231 | $176 | 61 |
| 7684 Pine Bark St | 0.31mi | 3/2.0 (-1) | 1,901 (+11%) | 2mo | $385,648 | $203 | 60 |
Match score weights: distance 35% · size 25% · config 20% · recency 20%. Top-matched comps best support the ARV.
Projected returns pro-forma
-3.0% appreciation · 4.53% rent growth · sell at horizon
- IRR
- -17.5%
- Equity multiple
- 0.37×
- Total profit
- $-49,711
- Equity at exit
- $42,269
- IRR
- -6.9%
- Equity multiple
- 0.53×
- Total profit
- $-37,313
- Equity at exit
- $24,511
Cash invested: $79,377 (down + closing). Projections, not guarantees.
Landlord ↔ Tenant lean methodology
- Overall (STATE)
- 87 Strongly Landlord-Friendly
- State Florida
- 87 Strongly Landlord-Friendly · R+3
- County
- — inherits STATE
- City
- — inherits STATE
ZIP-level market 32583
- Home prices YoY
- -11.3%
- Rents YoY
- 4.5%
- Active inventory
- 822
- Price-to-rent
- 10.1×
Monthly cashflow live
- Estimated rent
- $2,332 medium interval (Pro) →
- Mortgage (P&I)
- −$1,487
- Tax est. 1.5%
- −$354 /mo · $4,252/yr
- Insurance
- −$118
- HOA
- −$0
- Vacancy / Maint / Mgmt
- −$490
- Net cashflow
- $-117
Break-even live
Sensitivity live
| Price | -10% $79 | -5% $-19 | +0% $-117 | +5% $-215 | +10% $-313 |
|---|---|---|---|---|---|
| Rent | -10% $-301 | -5% $-209 | +0% $-117 | +5% $-25 | +10% $67 |
| Rate | -1.0pp $26 | -0.5pp $-45 | base $-117 | +0.5pp $-190 | +1.0pp $-265 |
UW: 25.0% down · 7.5% · 30yr · 1.5% tax · 5.0% vac · 8.0% maint · 8.0% mgmt
Financing live
Cash to close
- Down payment
- $70,872
- Closing costs
- $8,505
- Reserves months
- —
- Total cash needed
- —
Loan-product check · same deal, 3 products live
Conventional
25% down · 7.5% · 30yr
- Down + closing
- —
- Monthly P&I
- —
- Monthly cashflow
- —
- DSCR
- —
- Eligible?
- —
Personal DTI + credit; lowest rate.
DSCR
20% down · 8.5% · 30yr
- Down + closing
- —
- Monthly P&I
- —
- Monthly cashflow
- —
- DSCR
- —
- Eligible?
- —
No personal income docs; deal must DSCR.
Hard money
10% down · 12.0% · 12mo
- Down + closing
- —
- Monthly P&I
- —
- Monthly cashflow
- —
- DSCR
- —
- Eligible?
- —
Short-term bridge; refi at stabilization.
Rent comps 1 comps
| Address | Beds | Baths | Sqft | Rent | $/sqft | DOM | Units | Dist |
|---|---|---|---|---|---|---|---|---|
| 8057 Fir Tree Dr Milton, FL | 5.0 | 3.0 | 2107 | $2,400 | $1.14 | 25d | 1 | 0.79mi |
Listing history 17 events
-
2026-06-22days on market $283,490 Active 33 DOM
-
2026-06-18days on market $283,490 Active 30 DOM
-
2026-06-17days on market $283,490 Active 29 DOM
-
2026-06-16days on market $283,490 Active 28 DOM
-
2026-06-15days on market $283,490 Active 27 DOM
-
2026-06-14pricedays on market $283,490 Active 25 DOM
-
2026-06-10days on market $285,490 Active 22 DOM
-
2026-06-09days on market $285,490 Active 21 DOM
-
2026-06-08days on market $285,490 Active 20 DOM
-
2026-06-07days on market $285,490 Active 19 DOM
-
2026-06-05pricedays on market $285,490 Active 16 DOM
-
2026-06-03days on market $282,490 Active 15 DOM
-
2026-06-03price $282,490 Active 14 DOM
-
2026-06-02days on market $287,490 Active 14 DOM
-
2026-06-01days on market $287,490 Active 13 DOM
-
2026-05-31days on market $287,490 Active 12 DOM
-
2026-05-31pricedays on market $287,490 Active 11 DOM
ⓘ Source: listings_history table (triggers on properties + properties_extension) + one-shot
backfill from property_details.listing_events for pre-trigger history.
Nearby sold comps map
Loading sold comps map…
Walkable amenities ~0.75 mi
Loading nearby amenities…
Taxation est. · year 1
- Rental income
- $27,982
- − Mortgage interest
- −$15,880
- − Property taxes
- −$4,252
- − Insurance
- −$1,417
- − Repairs & maintenance
- −$2,239
- − Management
- −$2,239
- − Depreciation
- −$8,247
- Taxable loss
- −$6,292
- Est. tax savings @ 24.0%
- +$1,510
- After-tax cash flow
- $106/yr
For passive investors: Depreciation is non-cash, so a rental often shows a tax loss while cash-flowing — sheltering income. Rental losses are passive: they offset passive income freely, and up to $25,000/yr can offset ordinary (W-2) income if you actively participate and your MAGI is under $100k (phasing out to $0 by $150k); unused losses carry forward. On sale, claimed depreciation is recaptured at up to 25%, and gains may owe capital-gains tax (a 1031 exchange can defer both). Figures are a year-1 estimate at your 24.0% rate — not tax advice; consult a CPA.
Condition & rehab AI · 1 photo
This single-level home is in good condition with a good exterior and interior. It has a spacious floorplan and a well-maintained landscaping. The highest-ROI updates would be painting, landscaping, new flooring, lighting, and window treatments.
Value-add opportunities
- Both Painting exterior and interior — Fresh paint enhances curb appeal and interior aesthetics.
- Both Landscaping improvements — Enhances curb appeal and adds value to the property.
- Both New flooring in bathrooms and kitchen — Modern flooring improves aesthetics and adds value for both resale and rental.
- Both New lighting fixtures — Modern lighting enhances the home's appeal and can increase its value.
- Both New window treatments — New window treatments improve the home's curb appeal and can increase its value for both resale and rental.
Renovation cost estimate screening
Value-add ROI direction
- Both Painting exterior and interior — Fresh paint enhances curb appeal and interior aesthetics. ↑
- Both Landscaping improvements — Enhances curb appeal and adds value to the property. ↑
- Both New flooring in bathrooms and kitchen — Modern flooring improves aesthetics and adds value for both resale and rental. ↑
- Both New lighting fixtures — Modern lighting enhances the home's appeal and can increase its value. ↑
- Both New window treatments — New window treatments improve the home's curb appeal and can increase its value for both resale and rental. ↑
ⓘ Cost ranges are severity-bucket heuristics (US national rule-of-thumb). Get contractor quotes + a written scope before underwriting a rehab budget.
Schools (NCES district)
- District
- Santa Rosa
- NCES district ID
- 1201650
- Math proficiency
- 63% ▼ -6.00%
- Reading proficiency
- 60% ▼ -5.00%
- Median HH income
- $58,161
- Composite
- 53.12/100
- National rank
- #1511
- State rank
- #8 of 73 in FL
Livability — East Milton
- Score
- 77/100
- State rank
- #199
- US rank
- #3139
Category grades
Schools grade is shown separately in the Schools card above.
Census & demographics
- Census place
- East Milton, FL
- County
- Santa Rosa County · 194,764 people
- Metro
- Pensacola-Ferry Pass-Brent, FL
- Population (ZIP)
- 31,828
- Household income
- $85,440
- Rent vs Own
- Severe rent burden
- 122.0
Population outlook (Santa Rosa County) Hauer SSP2
- Today (2025)
- 195,978 people
- By 2030
- 209,782 · +7.0%
- By 2040
- 235,293 · +20.1%
- By 2050
- 256,408 · +30.8%
- By 2075
- 298,074 · +52.1%
- By 2100
- 303,216 · +54.7%
Race, ethnicity, and origin ACS 2023
- Neighborhood character
- Predominantly White (74%)
- Race & ethnicity
- White 74% Black 11% Two or more races 10% Hispanic / Latino 6% Asian 1%
- Hispanic origin (detail)
- Mexican 3% Puerto Rican 2% Cuban 1%
- Common ancestry
- Italian 3% Slovak 2% Serbian 2%
- Foreign-born
- 3% · Canada
- Languages at home
- 94% English-only · Spanish 3%
Political lean MEDSL · Santa Rosa
- 2024 margin
- Solid R (+51.0) · D 24.1% · R 75.0%
- 2008→2024 swing
- -3.0pp toward R · 2008: -47.9pp · 2024: -51.0pp
- All cycles
- 2024: R+51.0 2020: R+46.5 2016: R+53.5 2012: R+52.6 2008: R+47.9
Not yet ingested
- Civics
- —
Market trends
- HPI YoY
- ▼ -38.35%
- Current HPI
- 301.8819
- Rent YoY
- ▲ 4.53%
- Metro
- Pensacola-Ferry Pass-Brent, FL
- State GDP YoY
- ▲ 3.28%
- F500 in state
- 36
Industry mix (Fortune 500 HQ in FL)
| Industry | F500 HQs | Revenue |
|---|---|---|
| Industrial Technology | 2 | $29B |
|
||
| Insurance | 2 | $17B |
|
||
| Retail | 1 | $60B |
|
||
| Technology Distribution | 1 | $58B |
|
||
| Homebuilding | 1 | $35B |
|
||
| Technology Manufacturing | 1 | $35B |
|
||
Cash-flow waterfall
monthlySold comps — $/sqft
last 12 mo · ≤1 miLoading sold comps…