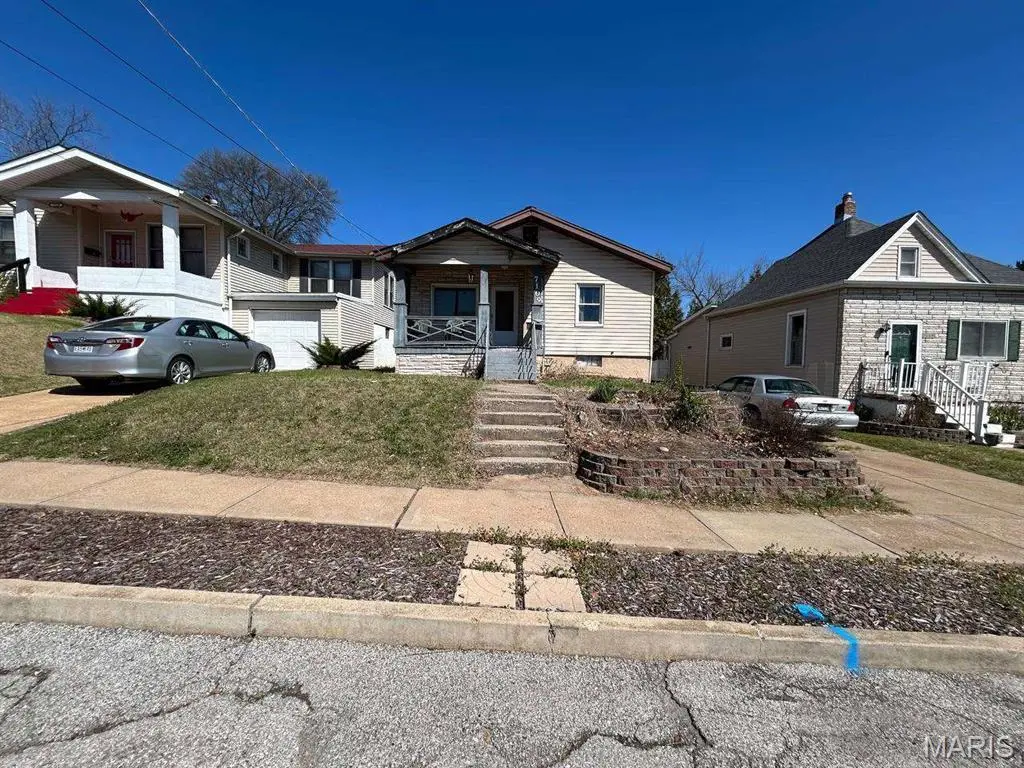
7109 Canterbury Ave · St. Louis, MO
Flood risk 8/10 · Major
- FEMA flood zone
- X (unshaded)
- Chance of flooding over 30 yrs
- 0.99%
- Est. flood insurance / yr
- $473 – $860
Fire risk 1/10 · Minimal
- Est. fire insurance / yr
- $1,054 – $1,958
Heat risk 5/10 · Moderate
- Hot days now (above 107°F)
- 7 days/yr
- Hot days in 30 yrs
- 21 days/yr
Wind risk 2/10 · Minimal
- Chance of severe wind over 30 yrs
- 1.0%
Air-quality risk 3/10 · Minor
- Unhealthy air days now
- 3 days/yr
- Unhealthy air days in 30 yrs
- 4 days/yr
Risk factors via First Street. Map © Google.
Why this score? — see what drove the B grade
The composite is a weighted blend of 9 inputs, each scored 0–100. Each bar is that input's sub-score; the figure is the points it added to the 100-point composite (weight × sub-score).
- Cash flow +30.0/30.0
- ARV discount +15.0/15.0
- DSCR +10.0/10.0
- 1% rule +8.2/10.0
- Rent growth +3.4/5.0
- Livability +2.5/5.0
- Condition / age +2.5/5.0
- Schools +1.2/10.0
- Appreciation +0.0/10.0
$125,000
🖨 Deal sheet 📄 Offer letter ✓ Due diligence
Listing remarks
This 3-bedroom, 1.5-bath home in St. Louis offers potential with a large basement and a convenient location near Hwy 44 and Lindenwood Park. The basement provides extra space for storage or potential room conversion. The property provides easy access to local amenities and downtown. Whether you're an investor looking for a property to renovate or a homeowner looking to personalize, this home offers a solid foundation to make your own.
Key facts
- Large basement
- Convenient location
- 6,298 sq ft lot
Tags
Neighborhood map
What this means for you Summary
Snapshot
- This is a 3-bed/1.0-bath single-family listed at $125k.
Deal economics
- At list price, monthly cash flow is $421 ($5k/yr) — positive.
- The deal already cash-flows at list — no discount required.
- Meets the 1% rule at list price ($2k rent vs $125k).
- Cap rate 10.9% vs local median 5.0% in St. Louis — top-decile yield for the area; either an underpriced asset or a hidden risk that comps aren't pricing in. Stress-test before assuming the spread holds.
Location & tenants
- Location reads: area grade B — affects rentability + tenant quality, not the cash-flow math above.
- St. Louis City (urban): math 10% / reading 18% proficiency, ranked #312 of 324 in MO (top 96%) — low school quality limits family demand, transient renter base, plan for 1-2y turnover; 80% free/reduced lunch — lower-income household profile, screen leases tightly.
- Zoned schools: Mason Elem. (math 22% / reading 37%, grade F, #813 of 1,115 statewide, top 75%, 389 students, 99% FRL); Roosevelt High (math 2% / reading 8%, grade F, #517 of 521 statewide, top 100%, 460 students, 99% FRL) — zoned schools average 99% FRL vs 80% district-wide (19 pts higher); higher-poverty schools than district average — tighter screening recommended.
- Market conditions: Rents rising (+3.8%/yr); 44 active listings in the ZIP; 32 comparable units currently listed for rent nearby; rentals at typical pace (median 18d on market — plan ~3-4 weeks tenant-placement turnaround); 294 units permitted in St. Louis city in 2024 (227 in 5+ unit buildings).
- This rent runs 30% of the median local income ($66k/yr) — at the standard rent-burdened threshold; future hikes will face affordability resistance.
Forward outlook
- Local home prices are declining (-3.0%/yr); year-one equity from $864 of loan paydown is wiped out by about $4k of value loss. Plan a longer hold.
- St. Louis County population projected to shrink 6% by 2050 — rents likely to lag national; underwrite the cash flow, not the appreciation.
- At projected returns (-3.0% appreciation + 3.8% rent growth), your $35k cash investment doubles in ~8 years — after that, you're playing with house money.
Negotiation context
- Only 12 days on market — expect competitive offers; lowballing is unlikely to land.
Risks & watch-outs
- Watch-outs: flood insurance adds $56/mo; built in 1926 — expect roof / HVAC / electrical / plumbing capex.
- Climate carrying-cost: severe flood risk; extreme-heat days projected 7→21/yr by 2055 (HVAC capex compounding) — expect insurance premiums to compound above CPI over the hold.
Questions for the listing agent
- Built in 1926 — when were the roof, HVAC, electrical panel, plumbing, and water heater last replaced?
- What's the actual annual flood-insurance premium (NFIP or private), and is the property in a SFHA with mandatory coverage?
- Is there a deadline driving the sale (1031 exchange, divorce, estate, relocation)? That informs how much negotiation room exists.
- What's the average days-on-market for RENTAL listings here right now (not sales)? A rising rental-DOM trend means longer vacancies and softer asking-rent achievability than the comps imply.
- What's the recent tenant-quality profile in this submarket — average credit score on applications, eviction rate, late-payment / NSF rate, and stable-employment percentage? A property-management company in the area should have these aggregated.
- How much new for-sale + rental construction is in the pipeline within 1–3 miles? Heavy new supply typically softens prices + rents 12–24 months out; constrained supply supports both.
Investment metrics
- 1% rule
- 1.32% ✓
- Cap rate
- 10.86%
- Cash-on-cash
- 16.33%
- DSCR
- 1.73
- GRM
- 6.3
CMA / ARV
- ARV (on-the-fly)
- $201,102
- Comps found
- 12
Show comp detail 12 sales within ~0.75 mi
| Address | Dist | Beds/Ba | Sqft | Sold | Price | $/sf | Match |
|---|---|---|---|---|---|---|---|
| 7120 Rabenberg Pl | 0.18mi | 2/1.0 (-1) | 820 (-1%) | 9mo | $185,000 | $226 | 77 |
| 6635 Arsenal St | 0.51mi | 3/1.0 | 806 (-3%) | 1mo | $90,000 | $112 | 70 |
| 7250 Arsenal St | 0.15mi | 2/1.0 (-1) | 952 (+15%) | 3mo | $245,000 | $257 | 61 |
| 6531 Hoffman Ave | 0.68mi | 2/1.0 (-1) | 800 (-4%) | 2mo | $200,000 | $250 | 56 |
| 6532 Southwest Ave | 0.73mi | 2/1.0 (-1) | 825 (-1%) | 9mo | $205,000 | $248 | 53 |
| 6742 Odell St | 0.41mi | 2/1.0 (-1) | 784 (-6%) | 17mo | $179,900 | $229 | 52 |
| 6591 Scanlan Ave | 0.52mi | 2/1.5 (-1) | 941 (+13%) | 1mo | $269,000 | $286 | 46 |
| 7118 Picadilly Ave | 0.40mi | 2/1.0 (-1) | 912 (+10%) | 18mo | $179,000 | $196 | 45 |
| 6969 Pernod Ave | 0.69mi | 2/2.0 (-1) | 838 (+1%) | 18mo | $240,000 | $286 | 42 |
| 6523 Bradley Ave | 0.65mi | 2/1.0 (-1) | 768 (-8%) | 14mo | $185,000 | $241 | 40 |
| 7122 Drury Ln | 0.63mi | 2/1.0 (-1) | 920 (+11%) | 11mo | $160,000 | $174 | 39 |
| 6746 Marquette | 0.67mi | 2/1.0 (-1) | 929 (+12%) | 12mo | $225,000 | $242 | 34 |
Match score weights: distance 35% · size 25% · config 20% · recency 20%. Top-matched comps best support the ARV.
Projected returns pro-forma
-3.0% appreciation · 3.76% rent growth · sell at horizon
- IRR
- 5.7%
- Equity multiple
- 1.22×
- Total profit
- $7,845
- Equity at exit
- $18,638
- IRR
- 15.8%
- Equity multiple
- 2.34×
- Total profit
- $46,771
- Equity at exit
- $10,808
Cash invested: $35,000 (down + closing). Projections, not guarantees.
Landlord ↔ Tenant lean methodology
- Overall (STATE)
- 81 Strongly Landlord-Friendly
- State Missouri
- 81 Strongly Landlord-Friendly · R+10
- County
- — inherits STATE
- City
- — inherits STATE
ZIP-level market 63143
- Rents YoY
- 3.8%
- Active inventory
- 44
- Price-to-rent
- 6.3×
Monthly cashflow live
- Estimated rent
- $1,648 high interval (Pro) →
- Mortgage (P&I)
- −$656
- Tax from tax record
- −$118 /mo · $1,419/yr
- Insurance
- −$52
- Flood insurance flood zone
- −$56 /mo · $666/yr
- HOA
- −$0
- Vacancy / Maint / Mgmt
- −$346
- Net cashflow
- $421
Break-even live
UW: 25.0% down · 7.5% · 30yr · 1.5% tax · 5.0% vac · 8.0% maint · 8.0% mgmt
Financing live
Cash to close
- Down payment
- $31,250
- Closing costs
- $3,750
- Reserves months
- —
- Total cash needed
- —
Loan-product check · same deal, 3 products live
Conventional
25% down · 7.5% · 30yr
- Down + closing
- —
- Monthly P&I
- —
- Monthly cashflow
- —
- DSCR
- —
- Eligible?
- —
Personal DTI + credit; lowest rate.
DSCR
20% down · 8.5% · 30yr
- Down + closing
- —
- Monthly P&I
- —
- Monthly cashflow
- —
- DSCR
- —
- Eligible?
- —
No personal income docs; deal must DSCR.
Hard money
10% down · 12.0% · 12mo
- Down + closing
- —
- Monthly P&I
- —
- Monthly cashflow
- —
- DSCR
- —
- Eligible?
- —
Short-term bridge; refi at stabilization.
Rent comps 32 comps
| Address | Beds | Baths | Sqft | Rent | $/sqft | DOM | Units | Dist |
|---|---|---|---|---|---|---|---|---|
| 7135 Canterbury Ave Saint Louis, MO | 1.0–2.0 | 1.0–1.5 | 1016 | $2,155 | $2.12 | 19d | 4 | 0.06mi |
| 7210 Lyndover Pl Unit 3E Maplewood, MO | 2.0 | 1.0 | 800 | $1,250 | $1.56 | 7d | 1 | 0.44mi |
| 2624 Roseland Ter Saint Louis, MO | 2.0 | 1.0 | 750 | $1,045 | $1.39 | 2d | 2 | 0.45mi |
| 2262 Yale Ave Saint Louis, MO | 2.0 | 1.0 | 900 | $2,700 | $3.00 | 14d | 1 | 0.49mi |
| 2507 Bellevue Ave Unit 2507 1 Maplewood, MO | 2.0 | 1.0 | 800 | $1,245 | $1.56 | 44d | 1 | 0.50mi |
| 7208 Zephyr Pl Apt 1E Maplewood, MO | 2.0 | 1.0 | 1100 | $1,199 | $1.09 | 44d | 1 | 0.51mi |
| 3717 Cambridge Ave Saint Louis, MO | 2.0 | 1.0 | 1020 | $1,750 | $1.72 | 23d | 1 | 0.75mi |
| 3710 Greenwood Blvd Saint Louis, MO | 1.0–2.0 | 1.0 | 750 | $1,250 | $1.67 | 23d | 4 | 0.75mi |
| 2050 Yale Ave Maplewood, MO | 2.0 | 1.0 | 700 | $1,150 | $1.64 | 23d | 1 | 0.79mi |
| 7047 Mardel Ave Saint Louis, MO | 2.0 | 1.0 | 768 | $1,695 | $2.21 | 18d | 1 | 0.83mi |
| 3308 Watson Rd Unit 9 St. Louis, MO | 2.0 | 1.0 | 675 | $1,100 | $1.63 | 20d | 1 | 0.85mi |
| 3308 Watson Rd Unit 1 St. Louis, MO | 2.0 | 1.0 | 675 | $1,100 | $1.63 | 23d | 1 | 0.85mi |
| 2705 Laclede Station Rd Maplewood, MO | 2.0 | 1.5 | 840 | $1,499 | $1.78 | 4d | 1 | 0.95mi |
| 2533 Tamm Ave Saint Louis, MO | 2.0 | 1.0 | 720 | $1,550 | $2.15 | 4d | 1 | 0.95mi |
| 6228 Arsenal St Unit 1F St. Louis, MO | 2.0 | 1.0 | 1050 | $1,250 | $1.19 | 44d | 1 | 0.96mi |
| 6723 Glades Ave Saint Louis, MO | 3.0 | 1.0 | 980 | $1,750 | $1.79 | 7d | 1 | 0.99mi |
| 6320 Arthur Ave Saint Louis, MO | 2.0 | 1.0 | 864 | $1,500 | $1.74 | 4d | 1 | 0.99mi |
| 6225 Marmaduke Ave Saint Louis, MO | 3.0 | 2.0 | 1008 | $2,179 | $2.16 | 4d | 1 | 1.00mi |
| 7560 Alicia Ave Saint Louis, MO | 2.0 | 1.0 | 960 | $1,650 | $1.72 | 44d | 1 | 1.00mi |
| 31 Sunnen Dr Maplewood, MO | 1.0–2.0 | 1.0–2.0 | 956 | $2,428 | $2.54 | 2d | 17 | 1.03mi |
| 7018 Plateau Ave Saint Louis, MO | 2.0 | 2.0 | 1040 | $1,995 | $1.92 | 2d | 1 | 1.04mi |
| 7027 Plateau Ave Saint Louis, MO | 2.0 | 1.0 | 816 | $1,750 | $2.14 | 44d | 1 | 1.06mi |
| 6048 Southwest Ave St. Louis, MO | 2.0 | 1.0 | 770 | $1,200 | $1.56 | 44d | 1 | 1.13mi |
| 7828 Laclede Forest Dr Maplewood, MO | 1.0–2.0 | 1.0 | 725 | $1,345 | $1.86 | 3d | 2 | 1.14mi |
| 7784 W Bruno Ave Saint Louis, MO | 2.0 | 1.0 | 900 | $950 | $1.06 | 44d | 1 | 1.23mi |
| 5927 Suson Pl St. Louis, MO | 1.0–2.0 | 1.0 | 670 | $1,235 | $1.84 | 2d | 12 | 1.23mi |
| 6312 Lindenwood Ct Saint Louis, MO | 2.0 | 1.0–1.5 | 1100 | $1,384 | $1.26 | 2d | 6 | 1.28mi |
| 1421 Claytonia Ter Unit 1F Richmond Heights, MO | 2.0 | 1.0 | 855 | $1,125 | $1.32 | 10d | 1 | 1.38mi |
| 3132 Park Hampton Ct Saint Louis, MO | 3.0 | 2.5 | 1106 | $2,100 | $1.90 | 44d | 1 | 1.39mi |
| 7030 Nottingham Ave St. Louis, MO | 1.0–2.0 | 1.0 | 910 | $1,550 | $1.70 | 3d | 5 | 1.42mi |
| 6957 Chippewa St Apt 1E St. Louis, MO | 2.0 | 1.0 | 1046 | $1,100 | $1.05 | 44d | 1 | 1.43mi |
| 3227 Jasper Park Saint Louis, MO | 3.0 | 1.0 | 972 | $1,695 | $1.74 | 18d | 1 | 1.49mi |
Listing history 2 events
-
2026-04-27status Pending
-
2026-04-15$125,000 Active
ⓘ Source: listings_history table (triggers on properties + properties_extension) + one-shot
backfill from property_details.listing_events for pre-trigger history.
Tax reassessment forecast MO · Resets to sale price
- Current annual tax
- $1,419 · $118/mo
- Projected year-2 tax
- $1,419 · $118/mo
- Expected delta
- $0/yr ($0/mo · 0.0%)
ⓘ Screening estimate from a state-policy table — verify with the county assessor before closing.
Climate risk First Street
- Flood 8/10 Severe FEMA zone X (unshaded) · 99% chance over 30 yrs
- Wildfire 1/10 Low
- Heat 5/10 Major 7 d/yr ≥107°F today · 21 d/yr by 30 yrs out
- Wind 2/10 Low 100% chance of damaging wind over 30 yrs
- Air quality 3/10 Moderate 3 unhealthy d/yr today · 4 by 30 yrs out
Nearby sold comps map
Loading sold comps map…
Walkable amenities ~0.75 mi
Loading nearby amenities…
Taxation est. · year 1
- Rental income
- $19,779
- − Mortgage interest
- −$7,002
- − Property taxes
- −$1,419
- − Insurance
- −$1,292
- − Repairs & maintenance
- −$1,582
- − Management
- −$1,582
- − Depreciation
- −$3,636
- Taxable income
- $3,265
- Est. tax owed @ 24.0%
- −$784
- After-tax cash flow
- $4,265/yr
For passive investors: Depreciation is non-cash, so a rental often shows a tax loss while cash-flowing — sheltering income. Rental losses are passive: they offset passive income freely, and up to $25,000/yr can offset ordinary (W-2) income if you actively participate and your MAGI is under $100k (phasing out to $0 by $150k); unused losses carry forward. On sale, claimed depreciation is recaptured at up to 25%, and gains may owe capital-gains tax (a 1031 exchange can defer both). Figures are a year-1 estimate at your 24.0% rate — not tax advice; consult a CPA.
Schools (NCES district)
- District
- St. Louis City
- NCES district ID
- 2929280
- Math proficiency
- 10% ▼ -6.00%
- Reading proficiency
- 18% ▼ -3.00%
- Median HH income
- $35,685
- Composite
- 11.54/100
- National rank
- #9699
- State rank
- #312 of 324 in MO
Livability — St. Louis
No livability data for this city. (Only ~50 U.S. cities are tracked.)
Census & demographics
- Census place
- St. Louis, MO
- County
- Saint Louis County · 888,823 people
- City population
- 283,259
- Metro
- St. Louis, MO-IL
- Population (ZIP)
- 8,975
- Household income
- $65,861
- Rent vs Own
- Severe rent burden
- 195.0
Population outlook (St. Louis County) Hauer SSP2
- Today (2025)
- 315,737 people
- By 2030
- 313,865 · -0.6%
- By 2040
- 305,439 · -3.3%
- By 2050
- 296,529 · -6.1%
- By 2075
- 271,028 · -14.2%
- By 2100
- 255,359 · -19.1%
Race, ethnicity, and origin ACS 2023
- Neighborhood character
- Predominantly White (74%)
- Race & ethnicity
- White 74% Two or more races 12% Black 8% Hispanic / Latino 4% Asian 3%
- Common ancestry
- Romanian 4% Slovak 4% Italian 3%
- Foreign-born
- 6% · Canada, China, Vietnam
- Languages at home
- 94% English-only · Spanish 3% Tagalog/Filipino 1%
Political lean MEDSL · St. Louis
- 2024 margin
- Solid D (+64.7) · D 81.4% · R 16.7% · Other 2.0%
- 2008→2024 swing
- -3.5pp toward R · 2008: 68.2pp · 2024: 64.7pp
- All cycles
- 2024: D+64.7 2020: D+66.2 2016: D+63.7 2012: D+66.6 2008: D+68.2
Not yet ingested
- Civics
- —
Market trends
- HPI YoY
- ▼ -226.44%
- Current HPI
- 300.6917
- Rent YoY
- ▲ 3.76%
- Metro
- St. Louis, MO-IL
- State GDP YoY
- ▲ 1.84%
- F500 in state
- 20
Industry mix (Fortune 500 HQ in MO)
| Industry | F500 HQs | Revenue |
|---|---|---|
| Healthcare | 1 | $163B |
|
||
| Insurance | 1 | $21B |
|
||
| Industrial Technology | 1 | $17B |
|
||
| Retail | 1 | $16B |
|
||
| Industrial Distribution | 1 | $10B |
|
||
| Utilities | 1 | $9B |
|
||
Price history
2 events — show timeline
- 2026-04-27 Pending — MARIS as Distributed by MLS Grid
- 2026-04-15 Listed $125,000 MARIS as Distributed by MLS Grid
Property tax history
+5.4%/yrLatest (2024): $1,419 · +5.1% YoY. Source: county tax records.
Cash-flow waterfall
monthlySold comps — $/sqft
last 12 mo · ≤1 miLoading sold comps…