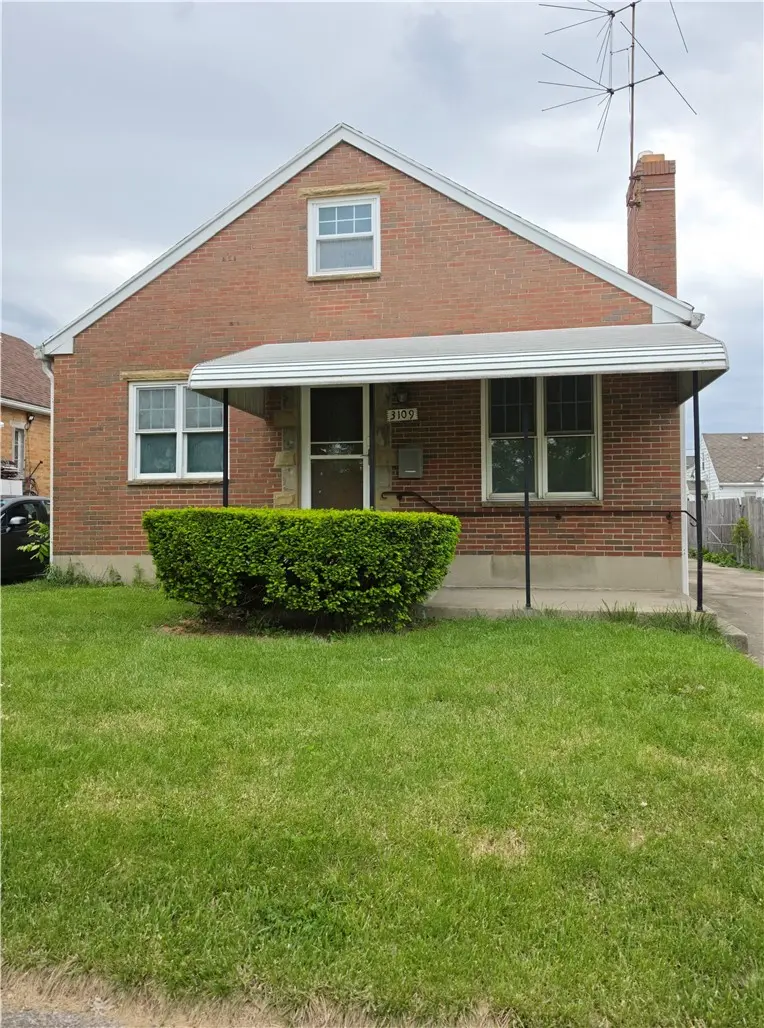
3109 Shroyer Rd · Kettering, OH
Flood risk 1/10 · Minimal
- FEMA flood zone
- X (unshaded)
- Chance of flooding over 30 yrs
- 0.0%
- Est. flood insurance / yr
- $473 – $860
Fire risk 1/10 · Minimal
- Est. fire insurance / yr
- $713 – $1,323
Heat risk 3/10 · Minor
- Hot days now (above 100°F)
- 7 days/yr
- Hot days in 30 yrs
- 17 days/yr
Wind risk 2/10 · Minimal
- Chance of severe wind over 30 yrs
- 0.0%
Air-quality risk 3/10 · Minor
- Unhealthy air days now
- 3 days/yr
- Unhealthy air days in 30 yrs
- 5 days/yr
Risk factors via First Street. Map © Google.
Why this score? — see what drove the D+ grade
The composite is a weighted blend of 9 inputs, each scored 0–100. Each bar is that input's sub-score; the figure is the points it added to the 100-point composite (weight × sub-score).
- ARV discount +15.0/15.0
- Cash flow +11.8/30.0
- 1% rule +5.2/10.0
- Schools +5.2/10.0
- Livability +4.2/5.0
- DSCR +3.5/10.0
- Rent growth +2.5/5.0
- Condition / age +2.5/5.0
- Appreciation +0.0/10.0
$145,000
🖨 Deal sheet (PDF) 📄 Offer letter ✓ Due diligence
Listing remarks
Opportunity awaits in desirable Kettering! This 3-bedroom home with a detached 2-car garage offers strong potential for investors, flippers, or owner-occupants looking to add value and make it their own. The home features a functional floor plan, spacious living areas, and a good-size yard with plenty of room to enjoy outdoor living, gardening, or entertaining. Conveniently located near shopping, dining, parks, schools, and major highways. Property needs TLC and is being sold as-is. Priced aggressively for a quick sale and full of upside potential. Great opportunity to build equity in a sought-after location. Schedule your showing today!
Key facts
- Good-size yard
- Outdoor living
- Conveniently located
Tags
Property features AI
Finance
- Financial info: Offered for sale
Exterior
- Parking: Attached two-car garage
- Utilities: Public water and sewer (standard residential services implied)
- Home design: Two-story; Brick construction
- Construction: Brick exterior
- Exterior features: Residential lot
Interior
- Kitchen: Main level kitchen (approx. 9 x 13)
- Bedrooms: Main level bedroom (approx. 12 x 11); Main level bedroom (approx. 10 x 11); Second level bedroom (approx. 30 x 10)
- Bathrooms: One full bathroom (main level)
- Heating & cooling: Natural gas heating; Central air conditioning
- Interior features: Full, partially finished basement; 6 total rooms
- Laundry & utility: Basement laundry room (approx. 20 x 5)
Neighborhood map
What this means for you Summary
Snapshot
- This is a 2-bed/1.0-bath single-family listed at $145k.
Deal economics
- At list price, monthly cash flow is $-39 ($-464/yr) — negative.
- To cash-flow at today's rent, offer at most $138k (4.7% below list).
- Meets the 1% rule at list price ($1k rent vs $145k).
- Recommended offer: $138k (4.7% below list) — sets the bar for cash-flow.
- Cap rate 6.0% vs local median 4.4% in Kettering — top-decile yield for the area; either an underpriced asset or a hidden risk that comps aren't pricing in. Stress-test before assuming the spread holds.
Location & tenants
- Location reads 83/100 on livability (#61 in OH, #922 nationally) — a professional / high-income tenant draw. Strengths: schools A+, crime A+, cost of living A+; Watch: commute F.
- Kettering City School District (suburban): math 54% / reading 68% proficiency, ranked #277 of 656 in OH (top 42%) — acceptable for families but not a draw, mixed tenant base, ~2y average lease.
- Market conditions: 81 active listings in the ZIP; 9 comparable units currently listed for rent nearby; rentals at typical pace (median 22d on market — plan ~3-4 weeks tenant-placement turnaround); solid renter incomes; 907 units permitted in Montgomery County in 2024 (416 in 5+ unit buildings).
Forward outlook
- Local home prices are declining (-3.0%/yr); year-one equity from $1k of loan paydown is wiped out by about $4k of value loss. Plan a longer hold.
- Montgomery County population projected at -10% by 2050 — secular population decline; favor cash flow + early exit over multi-decade hold.
Negotiation context
- It's been on market 41 days — a 3% lower offer ($141k) is reasonable based on typical stale-listing flexibility.
Risks & watch-outs
- Watch-outs: property tax is 3.2% of price; built in 1946 — expect roof / HVAC / electrical / plumbing capex.
Questions for the listing agent
- What do current leases actually rent for vs. the listed asking? Can we see a recent rent roll and the last 12 months of T-12 income?
- It's been on market 41 days. Have you received any prior offers? Is the seller open to a 5% concession, seller financing, or rate buy-down credit?
- Built in 1946 — when were the roof, HVAC, electrical panel, plumbing, and water heater last replaced?
- Property tax is high relative to price — has the assessment been appealed recently, and will the sale trigger a re-assessment?
- Is there a deadline driving the sale (1031 exchange, divorce, estate, relocation)? That informs how much negotiation room exists.
- Schools are A-rated — typically a magnet for longer-tenancy family renters. What's the average tenant stay here, and is there a school-zone premium baked into asking?
- The area grade is low — what's the realistic commute time and amenity access for the typical tenant pool here? Any planned neighborhood developments (good or bad) we should know about?
- What's the average days-on-market for RENTAL listings here right now (not sales)? A rising rental-DOM trend means longer vacancies and softer asking-rent achievability than the comps imply.
- What's the recent tenant-quality profile in this submarket — average credit score on applications, eviction rate, late-payment / NSF rate, and stable-employment percentage? A property-management company in the area should have these aggregated.
- How much new for-sale + rental construction is in the pipeline within 1–3 miles? Heavy new supply typically softens prices + rents 12–24 months out; constrained supply supports both.
Investment metrics
- 1% rule
- 1.02% ✓
- Cap rate
- 5.97%
- Cash-on-cash
- -1.14%
- DSCR
- 0.95
- GRM
- 8.2
CMA / ARV
- ARV (median comp)
- $217,395
- List price
- $145,000
- Delta
- -33.30%
- Verdict
- UNDERPRICED
- Comps
- 20 within 1.0 mi
Show comp detail 12 sales within ~0.75 mi
| Address | Dist | Beds/Ba | Sqft | Sold | Price | $/sf | Match |
|---|---|---|---|---|---|---|---|
| 2913 San Rae Dr | 0.26mi | 2/1.0 | 960 (-4%) | 3mo | $210,000 | $219 | 79 |
| 2725 Shroyer Rd | 0.28mi | 3/1.0 (+1) | 967 (-3%) | 1mo | $235,000 | $243 | 76 |
| 308 E Dorothy Ln | 0.26mi | 2/2.0 | 888 (-11%) | 4mo | $212,500 | $239 | 62 |
| 2637 Oakley Ave | 0.65mi | 3/1.5 (+1) | 998 (0%) | 1mo | $205,000 | $205 | 62 |
| 321 E Dorothy Ln | 0.25mi | 3/1.0 (+1) | 888 (-11%) | 4mo | $172,000 | $194 | 62 |
| 2601 Oakley Ave | 0.71mi | 3/1.0 (+1) | 998 (0%) | 4mo | $181,000 | $181 | 58 |
| 2513 Hazelwood Ave | 0.73mi | 3/1.0 (+1) | 1,008 (+1%) | 5mo | $175,000 | $174 | 56 |
| 2721 Aerial Ave | 0.42mi | 3/1.0 (+1) | 1,128 (+13%) | 2mo | $200,000 | $177 | 52 |
| 825 Brookfield Rd | 0.61mi | 2/1.0 | 1,104 (+11%) | 4mo | $168,500 | $153 | 51 |
| 3826 California Ave | 0.74mi | 2/1.0 | 1,104 (+11%) | 3mo | $195,602 | $177 | 46 |
| 355 Hadley Ave | 0.74mi | 2/2.0 | 1,120 (+12%) | 5mo | $290,000 | $259 | 37 |
| 2600 Oakley Ave | 0.72mi | 3/2.0 (+1) | 1,140 (+14%) | 1mo | $215,000 | $189 | 32 |
Match score weights: distance 35% · size 25% · config 20% · recency 20%. Top-matched comps best support the ARV.
Projected returns pro-forma
-3.0% appreciation · 3.0% rent growth · sell at horizon
- IRR
- -18.0%
- Equity multiple
- 0.36×
- Total profit
- $-25,812
- Equity at exit
- $21,620
- IRR
- -10.1%
- Equity multiple
- 0.38×
- Total profit
- $-25,054
- Equity at exit
- $12,537
Cash invested: $40,600 (down + closing). Projections, not guarantees.
Landlord ↔ Tenant lean methodology
- Overall (STATE)
- 73 Landlord-Friendly
- State Ohio
- 73 Landlord-Friendly · R+6
- County
- — inherits STATE
- City
- — inherits STATE
ZIP-level market 45429
- Active inventory
- 81
- Price-to-rent
- 8.2×
Monthly cashflow live
- Estimated rent
- $1,474 high interval (Pro) →
- Mortgage (P&I)
- −$760
- Tax from tax record
- −$382 /mo · $4,589/yr
- Insurance
- −$60
- HOA
- −$0
- Vacancy / Maint / Mgmt
- −$310
- Net cashflow
- $-39
Break-even live
Sensitivity live
| Price | -10% $43 | -5% $2 | +0% $-39 | +5% $-80 | +10% $-121 |
|---|---|---|---|---|---|
| Rent | -10% $-155 | -5% $-97 | +0% $-39 | +5% $20 | +10% $78 |
| Rate | -1.0pp $34 | -0.5pp $-2 | base $-39 | +0.5pp $-76 | +1.0pp $-114 |
UW: 25.0% down · 7.5% · 30yr · 1.5% tax · 5.0% vac · 8.0% maint · 8.0% mgmt
Financing live
Cash to close
- Down payment
- $36,250
- Closing costs
- $4,350
- Reserves months
- —
- Total cash needed
- —
Loan-product check · same deal, 3 products live
Conventional
25% down · 7.5% · 30yr
- Down + closing
- —
- Monthly P&I
- —
- Monthly cashflow
- —
- DSCR
- —
- Eligible?
- —
Personal DTI + credit; lowest rate.
DSCR
20% down · 8.5% · 30yr
- Down + closing
- —
- Monthly P&I
- —
- Monthly cashflow
- —
- DSCR
- —
- Eligible?
- —
No personal income docs; deal must DSCR.
Hard money
10% down · 12.0% · 12mo
- Down + closing
- —
- Monthly P&I
- —
- Monthly cashflow
- —
- DSCR
- —
- Eligible?
- —
Short-term bridge; refi at stabilization.
Rent comps 9 comps
| Address | Beds | Baths | Sqft | Rent | $/sqft | DOM | Units | Dist |
|---|---|---|---|---|---|---|---|---|
| 508 Schuyler Dr Dayton, OH | 3.0 | 1.0 | 1120 | $2,075 | $1.85 | 3d | 1 | 0.66mi |
| 2820 Harvey Ave Dayton, OH | 2.0 | 1.0 | 900 | $1,350 | $1.50 | 44d | 1 | 0.69mi |
| 539 Corona Ave Unit A Dayton, OH | 1.0 | 1.0 | 700 | $900 | $1.29 | 44d | 1 | 0.77mi |
| 719 Wiltshire Blvd Apt 2 Dayton, OH | 1.0 | 1.0 | 600 | $895 | $1.49 | 3d | 1 | 0.91mi |
| 719 Wiltshire Blvd Unit 1 Dayton, OH | 1.0 | 1.0 | 600 | $895 | $1.49 | 22d | 1 | 0.91mi |
| 440 Lonsdale Ave #1 Dayton, OH | 2.0 | 1.0 | 1050 | $1,450 | $1.38 | 12d | 1 | 1.05mi |
| 516 Mossoak Dr Unit 520 Mossoak Kettering, OH | 1.0 | 1.0 | 725 | $925 | $1.28 | 44d | 1 | 1.05mi |
| 4421 Grayson St Dayton, OH | 3.0 | 1.0 | 1040 | $1,745 | $1.68 | 24d | 1 | 1.36mi |
| 301 Henrich Dr Dayton, OH | 3.0 | 1.0 | 1040 | $1,745 | $1.68 | 3d | 1 | 1.46mi |
Listing history 16 events
-
2026-06-18days on market $145,000 Active 41 DOM
-
2026-06-17days on market $145,000 Active 40 DOM
-
2026-06-16days on market $145,000 Active 39 DOM
-
2026-06-15days on market $145,000 Active 38 DOM
-
2026-06-14days on market $145,000 Active 36 DOM
-
2026-06-13days on market $145,000 Active 35 DOM
-
2026-06-10days on market $145,000 Active 33 DOM
-
2026-06-09days on market $145,000 Active 32 DOM
-
2026-06-08days on market $145,000 Active 31 DOM
-
2026-06-07days on market $145,000 Active 30 DOM
-
2026-06-05days on market $145,000 Active 27 DOM
-
2026-06-03days on market $145,000 Active 26 DOM
-
2026-06-02days on market $145,000 Active 25 DOM
-
2026-06-01days on market $145,000 Active 24 DOM
-
2026-05-31days on market $145,000 Active 23 DOM
-
2026-05-08$150,000 Active 645-char remark
ⓘ Source: listings_history table (triggers on properties + properties_extension) + one-shot
backfill from property_details.listing_events for pre-trigger history.
Tax reassessment forecast OH · Partial reset (capped growth)
- Current annual tax
- $4,589 · $382/mo
- Projected year-2 tax
- $4,589 · $382/mo
- Expected delta
- $0/yr ($0/mo · 0.0%)
ⓘ Screening estimate from a state-policy table — verify with the county assessor before closing.
Climate risk First Street
- Flood 1/10 Low FEMA zone X (unshaded) · 0% chance over 30 yrs
- Wildfire 1/10 Low
- Heat 3/10 Moderate 7 d/yr ≥100°F today · 17 d/yr by 30 yrs out
- Wind 2/10 Low 0% chance of damaging wind over 30 yrs
- Air quality 3/10 Moderate 3 unhealthy d/yr today · 5 by 30 yrs out
Nearby sold comps map
Loading sold comps map…
Walkable amenities ~0.75 mi
Loading nearby amenities…
Taxation est. · year 1
- Rental income
- $17,689
- − Mortgage interest
- −$8,122
- − Property taxes
- −$4,589
- − Insurance
- −$725
- − Repairs & maintenance
- −$1,415
- − Management
- −$1,415
- − Depreciation
- −$4,218
- Taxable loss
- −$2,795
- Est. tax savings @ 24.0%
- +$671
- After-tax cash flow
- $207/yr
For passive investors: Depreciation is non-cash, so a rental often shows a tax loss while cash-flowing — sheltering income. Rental losses are passive: they offset passive income freely, and up to $25,000/yr can offset ordinary (W-2) income if you actively participate and your MAGI is under $100k (phasing out to $0 by $150k); unused losses carry forward. On sale, claimed depreciation is recaptured at up to 25%, and gains may owe capital-gains tax (a 1031 exchange can defer both). Figures are a year-1 estimate at your 24.0% rate — not tax advice; consult a CPA.
Schools (NCES district)
- District
- Kettering City School District
- NCES district ID
- 3904418
- Math proficiency
- 54% ▼ -21.00%
- Reading proficiency
- 68% ▼ -9.00%
- Median HH income
- $50,353
- Composite
- 51.89/100
- National rank
- #1653
- State rank
- #277 of 656 in OH
Livability — Kettering
- Score
- 83/100
- State rank
- #61
- US rank
- #922
Category grades
Schools grade is shown separately in the Schools card above.
Census & demographics
- Census place
- Kettering, OH
- County
- Montgomery County · 459,541 people
- City population
- 73,116
- Metro
- Dayton-Kettering, OH
- Population (ZIP)
- 26,347
- Household income
- $80,210
- Rent vs Own
- Severe rent burden
- 889.0
Population outlook (Montgomery County) Hauer SSP2
- Today (2025)
- 523,241 people
- By 2030
- 514,948 · -1.6%
- By 2040
- 493,378 · -5.7%
- By 2050
- 469,639 · -10.2%
- By 2075
- 418,360 · -20.0%
- By 2100
- 353,315 · -32.5%
Race, ethnicity, and origin ACS 2023
- Neighborhood character
- Predominantly White (86%)
- Race & ethnicity
- White 86% Two or more races 5% Black 5% Hispanic / Latino 3% Asian 2%
- Common ancestry
- Italian 3% Lithuanian 3% Slovak 2%
- Foreign-born
- 5% · Canada, China
- Languages at home
- 95% English-only · Spanish 2% Arabic 1%
Political lean MEDSL · Montgomery
- 2024 margin
- Toss-up / Even · D 49.8% · R 49.3%
- 2008→2024 swing
- -5.8pp toward R · 2008: 6.2pp · 2024: 0.5pp
- All cycles
- 2024: D+0.5 2020: D+2.2 2016: R+1.2 2012: D+3.1 2008: D+6.2
Not yet ingested
- Civics
- —
Market trends
- HPI YoY
- ▼ -172.24%
- Current HPI
- 274.1505
- Rent YoY
- —
- Metro
- Dayton-Kettering, OH
- State GDP YoY
- ▲ 1.98%
- F500 in state
- 48
Industry mix (Fortune 500 HQ in OH)
| Industry | F500 HQs | Revenue |
|---|---|---|
| Insurance | 3 | $145B |
|
||
| Industrial Machinery | 3 | $49B |
|
||
| Financial Services | 3 | $24B |
|
||
| Consumer Goods | 2 | $93B |
|
||
| Aerospace / Defense | 2 | $47B |
|
||
| Utilities | 2 | $33B |
|
||
Price history
-3.3% since first listed2 events — show timeline
- 2026-05-28 Price Changed $145,000 Dayton MLS
- 2026-05-08 Listed $150,000 Dayton MLS
Property tax history
+10.8%/yrLatest (2025): $4,589 · +12.1% YoY. Source: county tax records.
Cash-flow waterfall
monthlySold comps — $/sqft
last 12 mo · ≤1 miLoading sold comps…