2107 265th St · Winterset, IA
Flood risk No data
- FEMA flood zone
- —
- Chance of flooding over 30 yrs
- —
- Est. flood insurance / yr
- —
Fire risk No data
- Est. fire insurance / yr
- —
Heat risk No data
- Hot days now (above threshold)
- —
- Hot days in 30 yrs
- —
Wind risk No data
- Chance of severe wind over 30 yrs
- —
Air-quality risk No data
- Unhealthy air days now
- —
- Unhealthy air days in 30 yrs
- —
Risk factors via First Street. Map © Google.
Why this score? — see what drove the D+ grade
The composite is a weighted blend of 9 inputs, each scored 0–100. Each bar is that input's sub-score; the figure is the points it added to the 100-point composite (weight × sub-score).
- Cash flow +15.0/30.0
- ARV discount +7.5/15.0
- Schools +6.0/10.0
- 1% rule +5.0/10.0
- DSCR +5.0/10.0
- Livability +3.9/5.0
- Rent growth +2.5/5.0
- Condition / age +2.5/5.0
- Appreciation +0.0/10.0
$2
🖨 Deal sheet (PDF) 📄 Offer letter ✓ Due diligence
Listing remarks MLS
The currently tilled farmland consists of low-80s to low-90s CSR2 soils. This highly productive ground has the ability to perform year after year. This is a farm that not only produces, but has the soil quality to sustain long-term appreciation and value. For the lifestyle and recreational buyer, the eastern tract is truly special. It offers an outstanding hunting setup with excellent access, strong edge habitat, a flowing creek and water sources, and CRP grasses ideal for bedding, plus cedar trees for thermal cover. Surrounded by miles of intermittent timber, CRP, and crop fields, this landscape creates the perfect environment for whitetail deer to hide, adapt, and thrive. When it comes to the homesite, this property stands at the pinnacle of country living. The newer home is in excellent condition and features quality upgrades throughout. The proven, well-established pond and additional surrounding acreage bring everything together into the ideal family or lifestyle retreat. Homes with a developed, productive pond are rare and highly sought after. The outbuildings complete the package and will impress any horse or livestock enthusiast. With pasture and hay ground on site, you can raise your own feed, expand livestock operations, or design the ultimate hobby farm. The possibilities with this property are truly endless, and we invite you to place your bids online.
Key facts
- Water sources
- Hunting setup
- Crp grasses
Tags
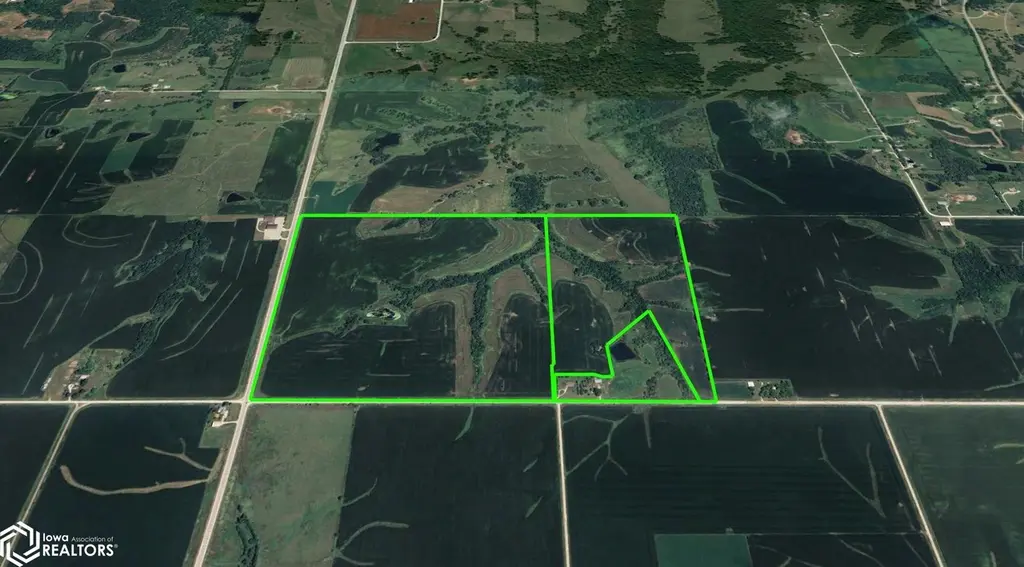
Neighborhood map
What this means for you Summary
Snapshot
- This is a 3-bed/2.0-bath single-family listed at $2.
Deal economics
- At list price, monthly cash flow is $1k ($15k/yr) — positive.
- The deal already cash-flows at list — no discount required.
- Meets the 1% rule at list price ($2k rent vs $2).
- Recommended offer: $1 (50.0% below list) — sets the bar for market timing.
- Cap rate 734750.1% vs local median 2.1% in Winterset — top-decile yield for the area; either an underpriced asset or a hidden risk that comps aren't pricing in. Stress-test before assuming the spread holds.
Location & tenants
- Location reads 78/100 on livability (#139 in IA, #2,547 nationally) — a middle-class / working-renter tenant base. Strengths: cost of living A+, housing A+, health & safety A+; Watch: amenities F, commute F.
- Winterset Community School District (town): math 73% / reading 69% proficiency, ranked #123 of 289 in IA (top 43%) — strong family-tenant draw, lease renewals of 3-5y typical.
- Zoned schools: Winterset Elementary School (math 82% / reading 47%, grade B, #317 of 616 statewide, top 58%, 499 students, 32% FRL); Winterset Middle School (math 72% / reading 74%, grade A, #87 of 246 statewide, top 36%, 358 students, 35% FRL); Winterset Senior High School (math 71% / reading 72%, grade B+, #134 of 336 statewide, top 41%, 565 students, 35% FRL).
- Market conditions: 122 active listings in the ZIP; 125 units permitted in Madison County in 2024 (51 in 5+ unit buildings).
Forward outlook
- Local home prices are declining (-3.0%/yr); year-one equity from $0 of loan paydown is wiped out by about $0 of value loss. Plan a longer hold.
- Madison County population projected to shrink 7% by 2050 — rents likely to lag national; underwrite the cash flow, not the appreciation.
- At projected returns (-3.0% appreciation + 3.0% rent growth), your $1 cash investment doubles in ~1 year — after that, you're playing with house money.
Negotiation context
- It's been on market 120 days — a 9% lower offer ($1) is reasonable based on typical stale-listing flexibility.
Questions for the listing agent
- It's been on market 120 days. Have you received any prior offers? Is the seller open to a 50% concession, seller financing, or rate buy-down credit?
- Why hasn't it sold? Are there any deal-killer items the seller is aware of (foundation, flood, title, zoning, code violations)?
- Is there a deadline driving the sale (1031 exchange, divorce, estate, relocation)? That informs how much negotiation room exists.
- Schools are B-rated — typically a magnet for longer-tenancy family renters. What's the average tenant stay here, and is there a school-zone premium baked into asking?
- The area grade is low — what's the realistic commute time and amenity access for the typical tenant pool here? Any planned neighborhood developments (good or bad) we should know about?
- What's the average days-on-market for RENTAL listings here right now (not sales)? A rising rental-DOM trend means longer vacancies and softer asking-rent achievability than the comps imply.
- What's the recent tenant-quality profile in this submarket — average credit score on applications, eviction rate, late-payment / NSF rate, and stable-employment percentage? A property-management company in the area should have these aggregated.
- How much new for-sale + rental construction is in the pipeline within 1–3 miles? Heavy new supply typically softens prices + rents 12–24 months out; constrained supply supports both.
Investment metrics
- 1% rule
- 77505.50% ✓
- Cap rate
- 734750.14%
- Cash-on-cash
- 2624085.17%
- DSCR
- 116758.02
- GRM
- 0.0
CMA / ARV
No comps found within radius.
Projected returns pro-forma
-3.0% appreciation · 3.0% rent growth · sell at horizon
- IRR
- —
- Equity multiple
- 139316.67×
- Total profit
- $78,017
- Equity at exit
- $0
- IRR
- —
- Equity multiple
- 300822.46×
- Total profit
- $168,460
- Equity at exit
- $0
Cash invested: $1 (down + closing). Projections, not guarantees.
Landlord ↔ Tenant lean methodology
- Overall (STATE)
- 83 Strongly Landlord-Friendly
- State Iowa
- 83 Strongly Landlord-Friendly · R+6
- County
- — inherits STATE
- City
- — inherits STATE
ZIP-level market 50273
- Home prices YoY
- -14.1%
- Active inventory
- 122
Monthly cashflow live
- Estimated rent
- $1,550 medium interval (Pro) →
- Mortgage (P&I)
- −$0
- Tax est. 1.5%
- −$0 /mo · $0/yr
- Insurance
- −$0
- HOA
- −$0
- Lot rent
- −$0
- Vacancy / Maint / Mgmt
- −$326
- Net cashflow
- $1,225
Break-even live
Sensitivity live
| Price | -10% $1,225 | -5% $1,225 | +0% $1,225 | +5% $1,225 | +10% $1,225 |
|---|---|---|---|---|---|
| Rent | -10% $1,102 | -5% $1,163 | +0% $1,225 | +5% $1,286 | +10% $1,347 |
| Rate | -1.0pp $1,225 | -0.5pp $1,225 | base $1,225 | +0.5pp $1,225 | +1.0pp $1,225 |
UW: 25.0% down · 7.5% · 30yr · 1.5% tax · 5.0% vac · 8.0% maint · 8.0% mgmt
Financing live
Cash to close
- Down payment
- $0
- Closing costs
- $0
- Reserves months
- —
- Total cash needed
- —
Loan-product check · same deal, 3 products live
Conventional
25% down · 7.5% · 30yr
- Down + closing
- —
- Monthly P&I
- —
- Monthly cashflow
- —
- DSCR
- —
- Eligible?
- —
Personal DTI + credit; lowest rate.
DSCR
20% down · 8.5% · 30yr
- Down + closing
- —
- Monthly P&I
- —
- Monthly cashflow
- —
- DSCR
- —
- Eligible?
- —
No personal income docs; deal must DSCR.
Hard money
10% down · 12.0% · 12mo
- Down + closing
- —
- Monthly P&I
- —
- Monthly cashflow
- —
- DSCR
- —
- Eligible?
- —
Short-term bridge; refi at stabilization.
Listing history 7 events
-
2026-06-05days on market $2 Active 120 DOM
-
2026-06-03days on market $2 Active 119 DOM
-
2026-06-02days on market $2 Active 118 DOM
-
2026-06-01days on market $2 Active 117 DOM
-
2026-05-31days on market $2 Active 116 DOM
-
2026-05-31days on market $2 Active 115 DOM
-
2026-01-28$2 Active 1386-char remark
Show marketing remark (1386 chars)
The currently tilled farmland consists of low-80s to low-90s CSR2 soils. This highly productive ground has the ability to perform year after year. This is a farm that not only produces, but has the soil quality to sustain long-term appreciation and value. For the lifestyle and recreational buyer, the eastern tract is truly special. It offers an outstanding hunting setup with excellent access, strong edge habitat, a flowing creek and water sources, and CRP grasses ideal for bedding, plus cedar trees for thermal cover. Surrounded by miles of intermittent timber, CRP, and crop fields, this landscape creates the perfect environment for whitetail deer to hide, adapt, and thrive. When it comes to the homesite, this property stands at the pinnacle of country living. The newer home is in excellent condition and features quality upgrades throughout. The proven, well-established pond and additional surrounding acreage bring everything together into the ideal family or lifestyle retreat. Homes with a developed, productive pond are rare and highly sought after. The outbuildings complete the package and will impress any horse or livestock enthusiast. With pasture and hay ground on site, you can raise your own feed, expand livestock operations, or design the ultimate hobby farm. The possibilities with this property are truly endless, and we invite you to place your bids online.
ⓘ Source: listings_history table (triggers on properties + properties_extension) + one-shot
backfill from property_details.listing_events for pre-trigger history.
Nearby sold comps map
Loading sold comps map…
Walkable amenities ~0.75 mi
Loading nearby amenities…
Taxation est. · year 1
- Rental income
- $18,601
- − Mortgage interest
- −$0
- − Property taxes
- −$0
- − Insurance
- −$0
- − Repairs & maintenance
- −$1,488
- − Management
- −$1,488
- − Depreciation
- −$0
- Taxable income
- $15,625
- Est. tax owed @ 24.0%
- −$3,750
- After-tax cash flow
- $10,945/yr
For passive investors: Depreciation is non-cash, so a rental often shows a tax loss while cash-flowing — sheltering income. Rental losses are passive: they offset passive income freely, and up to $25,000/yr can offset ordinary (W-2) income if you actively participate and your MAGI is under $100k (phasing out to $0 by $150k); unused losses carry forward. On sale, claimed depreciation is recaptured at up to 25%, and gains may owe capital-gains tax (a 1031 exchange can defer both). Figures are a year-1 estimate at your 24.0% rate — not tax advice; consult a CPA.
Schools (NCES district)
- District
- Winterset Community School District
- NCES district ID
- 1931860
- Math proficiency
- 73% ▼ -5.00%
- Reading proficiency
- 69% ▼ -1.00%
- Median HH income
- $52,350
- Composite
- 60.45/100
- National rank
- #848
- State rank
- #123 of 289 in IA
Livability — Winterset
- Score
- 78/100
- State rank
- #139
- US rank
- #2547
Category grades
Schools grade is shown separately in the Schools card above.
Census & demographics
- Population (ZIP)
- 9,123
Population outlook (Madison County) Hauer SSP2
- Today (2025)
- 15,715 people
- By 2030
- 15,565 · -1.0%
- By 2040
- 15,203 · -3.3%
- By 2050
- 14,640 · -6.8%
- By 2075
- 13,384 · -14.8%
- By 2100
- 11,967 · -23.8%
Race, ethnicity, and origin ACS 2023
- Neighborhood character
- Predominantly White (94%)
- Race & ethnicity
- White 94% Hispanic / Latino 3% Two or more races 2%
- Common ancestry
- Iranian 4% Portuguese 4% Polish 3%
- Foreign-born
- 0%
- Languages at home
- 97% English-only · German/W. Germanic 3%
Political lean MEDSL · Madison
- 2024 margin
- Solid R (+38.6) · D 30.1% · R 68.7% · Other 1.2%
- 2008→2024 swing
- -28.6pp toward R · 2008: -10.0pp · 2024: -38.6pp
- All cycles
- 2024: R+38.6 2020: R+34.3 2016: R+31.3 2012: R+12.1 2008: R+10.0
Not yet ingested
- Civics
- —
Market trends
- HPI YoY
- ▼ -45.44%
- Current HPI
- 276.4611
- Rent YoY
- —
- Metro
- —
- State GDP YoY
- ▲ 2.48%
- F500 in state
- 4
Industry mix (Fortune 500 HQ in IA)
| Industry | F500 HQs | Revenue |
|---|---|---|
| Financial Services | 1 | $16B |
|
||
| Retail / Convenience | 1 | $15B |
|
||
Cash-flow waterfall
monthlySold comps — $/sqft
last 12 mo · ≤1 miLoading sold comps…