2071 Bristlecone Ln · Idaho Falls, ID
Flood risk 1/10 · Minimal
- FEMA flood zone
- X
- Chance of flooding over 30 yrs
- 0.0%
- Est. flood insurance / yr
- $507 – $1,088
Fire risk 1/10 · Minimal
- Est. fire insurance / yr
- $584 – $1,086
Heat risk 3/10 · Minor
- Hot days now (above 91°F)
- 7 days/yr
- Hot days in 30 yrs
- 17 days/yr
Wind risk 1/10 · Minimal
- Chance of severe wind over 30 yrs
- —
Air-quality risk 4/10 · Minor
- Unhealthy air days now
- 5 days/yr
- Unhealthy air days in 30 yrs
- 6 days/yr
Risk factors via First Street. Map © Google.
Why this score? — see what drove the D- grade
The composite is a weighted blend of 9 inputs, each scored 0–100. Each bar is that input's sub-score; the figure is the points it added to the 100-point composite (weight × sub-score).
- 1% rule +10.0/10.0
- ARV discount +7.5/15.0
- Cash flow +7.1/30.0
- Livability +4.3/5.0
- Schools +4.2/10.0
- Rent growth +2.6/5.0
- Condition / age +2.5/5.0
- DSCR +1.3/10.0
- Appreciation +0.0/10.0
$94,900
🖨 Deal sheet 📄 Offer letter ✓ Due diligence
Listing remarks MLS
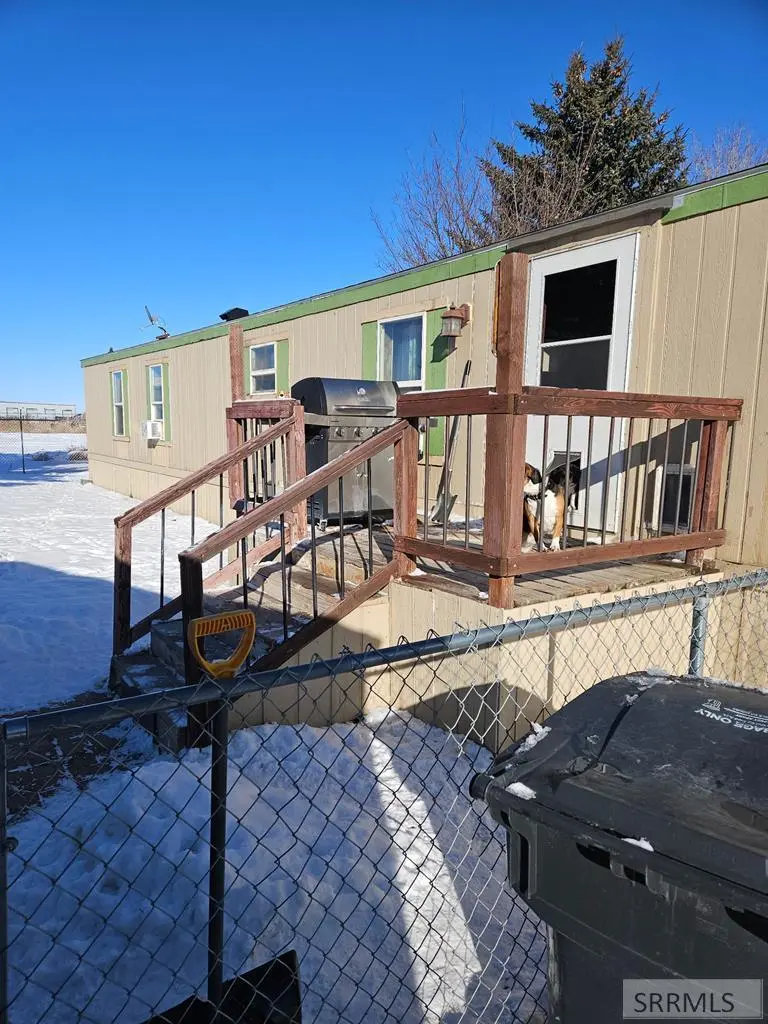
This updated mobile home has some amazing features which include: a remodeled kitchen including a newer fridge, range and dishwasher. The house also includes newer carpet and an updated master bath. The outside of the home includes a new roof that was replaced within the last five years and two spacious storage sheds to boot. Come take a look today!
Key facts
- Updated master bath
- Remodeled kitchen
- Newer fridge
Tags
Property features AI
Finance
- Other: Located in the Pine Wood Estates subdivision
- Financial info:
- HOA & community: Homeowners association with a monthly fee of $727
Exterior
- Parking: Gravel parking
- Security:
- Utilities: Shared well water; Public sewer; Natural gas available
- Home design: Single-family residence; One story
- Construction:
- Exterior features: Chain link fencing; Shed(s)
Interior
- Kitchen: Includes dishwasher, microwave, and refrigerator
- Bedrooms:
- Flooring: Carpet; Laminate
- Bathrooms: 2 full bathrooms
- Heating & cooling: Forced air heating (natural gas); Ceiling fan cooling
- Interior features: Dishwasher, Microwave, Refrigerator; Ceiling fan(s); Fireplace (1)
- Laundry & utility:
Neighborhood map
What this means for you Summary
Snapshot
- This is a ?-bed/2.0-bath manufactured listed at $95k.
Deal economics
- At list price, monthly cash flow is $-136 ($-2k/yr) — negative.
- To cash-flow at today's rent, offer at most $71k (25.3% below list).
- Meets the 1% rule at list price ($1k rent vs $95k).
- Recommended offer: $71k (25.3% below list) — sets the bar for cash-flow.
Location & tenants
- Location reads 86/100 on livability (#3 in ID, #428 nationally) — a professional / high-income tenant draw. Strengths: amenities A+, cost of living A+, housing A+.
- Bonneville Joint District (suburban): math 41% / reading 57% proficiency, ranked #30 of 92 in ID (top 33%) — families likely to look elsewhere, expect single-tenant / working-renter base with shorter leases.
- Zoned schools: Summit Hills Elementary School (math 39% / reading 55%, grade D-, #176 of 357 statewide, top 53%, 503 students, 35% FRL); Rocky Mountain Middle School (math 39% / reading 59%, grade C-, #34 of 109 statewide, top 34%, 536 students, 32% FRL) — zoned schools at 34% FRL track the district average.
- Market conditions: Rents flat; 397 active listings in the ZIP; 6 comparable units currently listed for rent nearby; rentals at typical pace (median 21d on market — plan ~3-4 weeks tenant-placement turnaround); solid renter incomes; 2,253 units permitted in Bonneville County in 2024 (1,051 in 5+ unit buildings).
Forward outlook
- Local home prices are declining (-3.0%/yr); year-one equity from $656 of loan paydown is wiped out by about $3k of value loss. Plan a longer hold.
- Bonneville County population projected at +18% by 2050 — long-run rental-demand tailwind backs the buy-and-hold thesis.
Negotiation context
- It's been on market 28 days — a 2% lower offer ($93k) is reasonable based on typical stale-listing flexibility.
- 2 sale attempts; this cycle's ask has dropped $5k (5%) from the opening price — seller is motivated, your offer sets the floor, not the list.
Risks & watch-outs
- Watch-outs: HOA is 50% of rent.
Questions for the listing agent
- What do current leases actually rent for vs. the listed asking? Can we see a recent rent roll and the last 12 months of T-12 income?
- What does the HOA fee cover, when was the last increase, and are there any pending special assessments or reserve-fund shortfalls?
- Is there a deadline driving the sale (1031 exchange, divorce, estate, relocation)? That informs how much negotiation room exists.
- The area grade is low — what's the realistic commute time and amenity access for the typical tenant pool here? Any planned neighborhood developments (good or bad) we should know about?
- What's the average days-on-market for RENTAL listings here right now (not sales)? A rising rental-DOM trend means longer vacancies and softer asking-rent achievability than the comps imply.
- What's the recent tenant-quality profile in this submarket — average credit score on applications, eviction rate, late-payment / NSF rate, and stable-employment percentage? A property-management company in the area should have these aggregated.
- How much new for-sale + rental construction is in the pipeline within 1–3 miles? Heavy new supply typically softens prices + rents 12–24 months out; constrained supply supports both.
Investment metrics
- 1% rule
- 1.53% ✓
- Cap rate
- 4.57%
- Cash-on-cash
- -6.15%
- DSCR
- 0.73
- GRM
- 5.5
CMA / ARV
No comps found within radius.
Projected returns pro-forma
-3.0% appreciation · 0.51% rent growth · sell at horizon
- IRR
- -32.6%
- Equity multiple
- -0.02×
- Total profit
- $-27,188
- Equity at exit
- $14,150
- IRR
- -82.0%
- Equity multiple
- -0.77×
- Total profit
- $-47,028
- Equity at exit
- $8,205
Cash invested: $26,572 (down + closing). Projections, not guarantees.
Landlord ↔ Tenant lean methodology
- Overall (STATE)
- 91 Strongly Landlord-Friendly
- State Idaho
- 91 Strongly Landlord-Friendly · R+18
- County
- — inherits STATE
- City
- — inherits STATE
ZIP-level market 83401
- Home prices YoY
- -30.6%
- Rents YoY
- 0.5%
- Active inventory
- 397
- Price-to-rent
- 5.5×
Monthly cashflow live
- Estimated rent
- $1,450 high interval (Pro) →
- Mortgage (P&I)
- −$498
- Tax from tax record
- −$18 /mo · $211/yr
- Insurance
- −$40
- HOA
- −$727
- Vacancy / Maint / Mgmt
- −$305
- Net cashflow
- $-136
Break-even live
UW: 25.0% down · 7.5% · 30yr · 1.5% tax · 5.0% vac · 8.0% maint · 8.0% mgmt
Financing live
Cash to close
- Down payment
- $23,725
- Closing costs
- $2,847
- Reserves months
- —
- Total cash needed
- —
Loan-product check · same deal, 3 products live
Conventional
25% down · 7.5% · 30yr
- Down + closing
- —
- Monthly P&I
- —
- Monthly cashflow
- —
- DSCR
- —
- Eligible?
- —
Personal DTI + credit; lowest rate.
DSCR
20% down · 8.5% · 30yr
- Down + closing
- —
- Monthly P&I
- —
- Monthly cashflow
- —
- DSCR
- —
- Eligible?
- —
No personal income docs; deal must DSCR.
Hard money
10% down · 12.0% · 12mo
- Down + closing
- —
- Monthly P&I
- —
- Monthly cashflow
- —
- DSCR
- —
- Eligible?
- —
Short-term bridge; refi at stabilization.
Rent comps 6 comps
| Address | Beds | Baths | Sqft | Rent | $/sqft | DOM | Units | Dist |
|---|---|---|---|---|---|---|---|---|
| 1522 Quail Dr Idaho Falls, ID | 3.0 | 2.0 | 1204 | $1,865 | $1.55 | 13d | 1 | 0.56mi |
| 1522 Quail Dr Unit 1207 Idaho Falls, ID | 2.0 | 2.0 | 990 | $1,545 | $1.56 | 21d | 1 | 0.62mi |
| 1428 Red RD Idaho Falls, ID | 2.0–3.0 | 2.0–2.5 | 1327 | $1,549 | $1.17 | 13d | 25 | 0.64mi |
| 1522 Quail Dr Unit 3108 Idaho Falls, ID | 3.0 | 2.0 | 1204 | $1,865 | $1.55 | 21d | 1 | 0.66mi |
| 2910 E Lincoln Rd Idaho Falls, ID | 2.0 | 1.0 | 900 | $1,150 | $1.28 | 21d | 1 | 0.98mi |
| 4285 N Yellowstone Hwy #6 Idaho Falls, ID | 2.0 | 2.0 | 770 | $1,929 | $2.51 | 21d | 1 | 1.38mi |
HOA detail
- Monthly dues
- $727 · $8,724/yr
Listing history 18 events
-
2026-06-19days on market $94,900 Active 28 DOM
-
2026-06-18days on market $94,900 Active 27 DOM
-
2026-06-17days on market $94,900 Active 26 DOM
-
2026-06-16days on market $94,900 Active 25 DOM
-
2026-06-15days on market $94,900 Active 24 DOM
-
2026-06-14days on market $94,900 Active 22 DOM
-
2026-06-13pricedays on market $94,900 Active 21 DOM
-
2026-06-10days on market $99,900 Active 19 DOM
-
2026-06-09days on market $99,900 Active 18 DOM
-
2026-06-08days on market $99,900 Active 17 DOM
-
2026-06-07days on market $99,900 Active 16 DOM
-
2026-06-02days on market $99,900 Active 11 DOM
-
2026-06-01days on market $99,900 Active 10 DOM
-
2026-05-31days on market $99,900 Active 9 DOM
-
2026-05-30days on market $99,900 Active 8 DOM
-
2026-05-21$99,900 Active 351-char remark
Show marketing remark (351 chars)
This updated mobile home has some amazing features which include: a remodeled kitchen including a newer fridge, range and dishwasher. The house also includes newer carpet and an updated master bath. The outside of the home includes a new roof that was replaced within the last five years and two spacious storage sheds to boot. Come take a look today!
-
2026-05-21$99,900 Active
Show marketing remark (351 chars)
This updated mobile home has some amazing features which include: a remodeled kitchen including a newer fridge, range and dishwasher. The house also includes newer carpet and an updated master bath. The outside of the home includes a new roof that was replaced within the last five years and two spacious storage sheds to boot. Come take a look today!
-
2025-03-05price $100,000
ⓘ Source: listings_history table (triggers on properties + properties_extension) + one-shot
backfill from property_details.listing_events for pre-trigger history.
Tax reassessment forecast ID · Resets to sale price
- Current annual tax
- $211 · $18/mo
- Projected year-2 tax
- $655 · $55/mo
- Expected delta
- +$444/yr (+$37/mo · 210.3%)
ⓘ Screening estimate from a state-policy table — verify with the county assessor before closing.
Climate risk First Street
- Flood 1/10 Low FEMA zone X · 0% chance over 30 yrs
- Wildfire 1/10 Low
- Heat 3/10 Moderate 7 d/yr ≥91°F today · 17 d/yr by 30 yrs out
- Wind 1/10 Low
- Air quality 4/10 Moderate 5 unhealthy d/yr today · 6 by 30 yrs out
Nearby sold comps map
Loading sold comps map…
Walkable amenities ~0.75 mi
Loading nearby amenities…
Taxation est. · year 1
- Rental income
- $17,402
- − Mortgage interest
- −$5,316
- − Property taxes
- −$211
- − Insurance
- −$474
- − Repairs & maintenance
- −$1,392
- − Management
- −$1,392
- − HOA
- −$8,724
- − Depreciation
- −$2,761
- Taxable loss
- −$2,868
- Est. tax savings @ 24.0%
- +$688
- After-tax cash flow
- $-945/yr
For passive investors: Depreciation is non-cash, so a rental often shows a tax loss while cash-flowing — sheltering income. Rental losses are passive: they offset passive income freely, and up to $25,000/yr can offset ordinary (W-2) income if you actively participate and your MAGI is under $100k (phasing out to $0 by $150k); unused losses carry forward. On sale, claimed depreciation is recaptured at up to 25%, and gains may owe capital-gains tax (a 1031 exchange can defer both). Figures are a year-1 estimate at your 24.0% rate — not tax advice; consult a CPA.
Schools (NCES district)
- District
- Bonneville Joint District
- NCES district ID
- 1600930
- Math proficiency
- 41% ▼ -2.00%
- Reading proficiency
- 57% ▲ 1.00%
- Median HH income
- $55,775
- Composite
- 42.45/100
- National rank
- #3219
- State rank
- #30 of 92 in ID
Livability — Idaho Falls
- Score
- 86/100
- State rank
- #3
- US rank
- #428
Category grades
Schools grade is shown separately in the Schools card above.
Census & demographics
- Census place
- Idaho Falls, ID
- County
- Bonneville County · 125,162 people
- City population
- 105,466
- Metro
- Idaho Falls, ID
- Population (ZIP)
- 47,972
- Household income
- $78,497
- Rent vs Own
- Severe rent burden
- 422.0
Population outlook (Bonneville County) Hauer SSP2
- Today (2025)
- 120,170 people
- By 2030
- 124,993 · +4.0%
- By 2040
- 134,091 · +11.6%
- By 2050
- 142,122 · +18.3%
- By 2075
- 157,767 · +31.3%
- By 2100
- 160,316 · +33.4%
Race, ethnicity, and origin ACS 2023
- Neighborhood character
- Predominantly White (80%)
- Race & ethnicity
- White 80% Hispanic / Latino 15% Two or more races 8%
- Hispanic origin (detail)
- Mexican 11% Puerto Rican 1%
- Common ancestry
- Italian 4% Slovak 3% Portuguese 2%
- Foreign-born
- 4% · Canada
- Languages at home
- 90% English-only · Spanish 9%
Political lean MEDSL · Bonneville
- 2024 margin
- Solid R (+45.4) · D 25.6% · R 71.0% · Other 3.4%
- 2008→2024 swing
- -2.4pp toward R · 2008: -43.0pp · 2024: -45.4pp
- All cycles
- 2024: R+45.4 2020: R+43.6 2016: R+40.2 2012: R+51.8 2008: R+43.0
Not yet ingested
- Civics
- —
Market trends
- HPI YoY
- ▼ -164.87%
- Current HPI
- 374.2807
- Rent YoY
- ▲ 0.51%
- Metro
- Idaho Falls, ID
- State GDP YoY
- ▲ 4.51%
- F500 in state
- 6
Industry mix (Fortune 500 HQ in ID)
| Industry | F500 HQs | Revenue |
|---|---|---|
| Retail | 1 | $79B |
|
||
| Technology | 1 | $25B |
|
||
| Food / Agriculture | 1 | $6B |
|
||
Price history
-0.1% since first listed3 events — show timeline
- 2026-05-21 Listed $99,900 SRMLS
- 2026-05-21 Listed $99,900 PCTMLS
- 2025-03-05 Price Changed $100,000 SRMLS
Cash-flow waterfall
monthlySold comps — $/sqft
last 12 mo · ≤1 miLoading sold comps…