1400 S Sunkist St #46 · Anaheim, CA
Flood risk 1/10 · Minimal
- FEMA flood zone
- X (shaded)
- Chance of flooding over 30 yrs
- 0.0%
- Est. flood insurance / yr
- $507 – $1,088
Fire risk 1/10 · Minimal
- Est. fire insurance / yr
- $659 – $1,223
Heat risk 6/10 · Moderate
- Hot days now (above 94°F)
- 7 days/yr
- Hot days in 30 yrs
- 22 days/yr
Wind risk 1/10 · Minimal
- Chance of severe wind over 30 yrs
- —
Air-quality risk 6/10 · Moderate
- Unhealthy air days now
- 12 days/yr
- Unhealthy air days in 30 yrs
- 13 days/yr
Risk factors via First Street. Map © Google.
Why this score? — see what drove the C- grade
The composite is a weighted blend of 9 inputs, each scored 0–100. Each bar is that input's sub-score; the figure is the points it added to the 100-point composite (weight × sub-score).
- Cash flow +22.1/30.0
- ARV discount +7.5/15.0
- DSCR +7.1/10.0
- 1% rule +5.8/10.0
- Livability +3.5/5.0
- Condition / age +2.5/5.0
- Rent growth +2.3/5.0
- Schools +2.3/10.0
- Appreciation +0.0/10.0
$359,000
🖨 Deal sheet (PDF) 📄 Offer letter ✓ Due diligence
Listing remarks
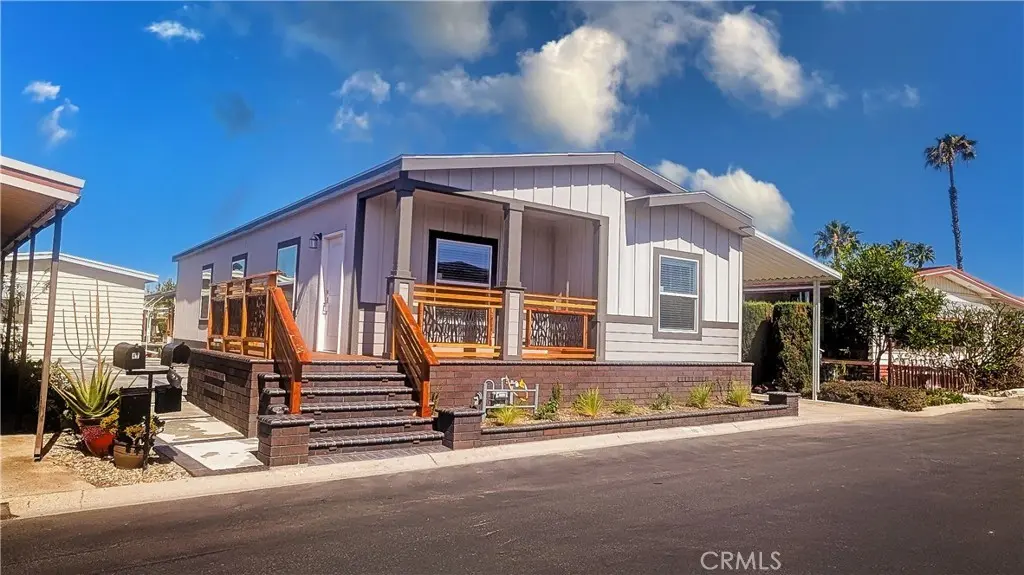
WOW GORGEOUS INSIDE AND OUTSIDE!! Step into this, BRAND NEW 2026 Manufactured Home it Featuring 3 bedrooms, 2 baths a dining area and a separate laundry room with an Open Floor Concept. This Home its Located in a Senior COMMUNITY IN ORANGE COUNTY. Perfect Located close from Disneyland, Angel Stadium, Yorba Regional Park, Horse Trails nearby, but not a touristy area still very peaceful and quiet! Once inside, you’re greeted by 9-foot ceilings, a skylight that fills the home with natural light, recessed lighting in living room and kitchen, ceiling fans and Central Heating and Air conditioning that keeps you comfortable year-round. Kitchen featuring luxurious quartz countertops, a Gorge
Key facts
- 3 garage spots
- Community pool
- Built 2026
Property features AI
Finance
- Other: Manager approval required
- Financial info: Land lease applies
- HOA & community: Senior community; Sunkist Gardens Mobile Home Park; Park amenities include pool and clubhouse
Exterior
- Parking: Total of 6 parking spaces; 3 covered carport spaces; 3 garage spaces
- Utilities: Public sewer; District/Public water
- Home design: Single-story mobile home (double body); Limited Series model; Turnkey condition; Front door entry; 58' x 27' mobile dimensions; Faces front (entry at front door)
- Construction: Shingle roof; Drywall walls; Built as a single-story unit; Year built recorded in public records
- Exterior features: Front and rear porches; Deck; Brick accents; Awning; Has patio; Community pool; Park nearby; Close to clubhouse
Interior
- Kitchen: Energy Star appliances; Built-in range; Microwave; Refrigerator; Dishwasher; Garbage disposal; Walk-in pantry; Self-closing cabinet doors; Quartz counters
- Bedrooms: Entry on first level (single-story home)
- Flooring: Vinyl flooring
- Bathrooms: Two full bathrooms with bathtub and shower; Quartz counters in bathrooms
- Heating & cooling: Central heating (furnace); Central cooling
- Interior features: Quartz counters throughout; High (9'+) ceilings; Ceiling fan; Pantry; Recessed lighting; Open floor plan; Coffered ceilings; Double pane windows; Skylights; Energy Star windows; Blinds; Community spa access
- Laundry & utility: Indoor laundry in a dedicated room
Neighborhood map
What this means for you Summary
Snapshot
- This is a 3-bed/2.0-bath manufactured listed at $359k.
Deal economics
- At list price, monthly cash flow is $579 ($7k/yr) — positive.
- The deal already cash-flows at list — no discount required.
- Meets the 1% rule at list price ($4k rent vs $359k).
- Recommended offer: $337k (6.0% below list) — sets the bar for market timing.
- Cap rate 8.2% vs local median 2.1% in Anaheim — top-decile yield for the area; either an underpriced asset or a hidden risk that comps aren't pricing in. Stress-test before assuming the spread holds.
Location & tenants
- Location reads 70/100 on livability (#240 in CA) — a middle-class / working-renter tenant base. Strengths: amenities A+, commute A+, employment A+; Watch: health & safety C-, crime F, cost of living F.
- Anaheim Elementary (urban): math 25% / reading 25% proficiency, ranked #386 of 517 in CA (top 75%) — low school quality limits family demand, transient renter base, plan for 1-2y turnover; 73% free/reduced lunch — lower-income household profile, screen leases tightly.
- Market conditions: Rents soft (-0.8%/yr); 41 active listings in the ZIP; 20 comparable units currently listed for rent nearby; rentals leasing fast (median 0d on market — plan ~1-2 weeks tenant-placement turnaround); solid renter incomes; 6,974 units permitted in Orange County in 2024 (3,839 in 5+ unit buildings).
- At $3,873/mo this rent would consume 48% of the median local household income ($97k/yr) (locally 2171% of renters already pay >50% of income on rent) — very limited rent-growth headroom before tenants either downsize or default.
Forward outlook
- Local home prices are declining (-3.0%/yr); year-one equity from $2k of loan paydown is wiped out by about $11k of value loss. Plan a longer hold.
- Orange County population projected at +14% by 2050 — modest demand growth; plan on rents tracking national, not racing it.
Negotiation context
- It's been on market 65 days — a 6% lower offer ($337k) is reasonable based on typical stale-listing flexibility.
Risks & watch-outs
- Climate carrying-cost: extreme-heat days projected 7→22/yr by 2055 (HVAC capex compounding) — expect insurance premiums to compound above CPI over the hold.
Questions for the listing agent
- It's been on market 65 days. Have you received any prior offers? Is the seller open to a 6% concession, seller financing, or rate buy-down credit?
- Why hasn't it sold? Are there any deal-killer items the seller is aware of (foundation, flood, title, zoning, code violations)?
- Is there a deadline driving the sale (1031 exchange, divorce, estate, relocation)? That informs how much negotiation room exists.
- Crime grade is F in this area — have there been break-ins, vandalism, or insurance claims at this property in the last 3 years? What carrier currently insures it and at what premium?
- What's the average days-on-market for RENTAL listings here right now (not sales)? A rising rental-DOM trend means longer vacancies and softer asking-rent achievability than the comps imply.
- What's the recent tenant-quality profile in this submarket — average credit score on applications, eviction rate, late-payment / NSF rate, and stable-employment percentage? A property-management company in the area should have these aggregated.
- How much new for-sale + rental construction is in the pipeline within 1–3 miles? Heavy new supply typically softens prices + rents 12–24 months out; constrained supply supports both.
Investment metrics
- 1% rule
- 1.08% ✓
- Cap rate
- 8.23%
- Cash-on-cash
- 6.91%
- DSCR
- 1.31
- GRM
- 7.7
CMA / ARV
- ARV (on-the-fly)
- $168,000
- Comps found
- 2
Show comp detail 2 sales within ~0.75 mi
| Address | Dist | Beds/Ba | Sqft | Sold | Price | $/sf | Match |
|---|---|---|---|---|---|---|---|
| 1400 S Sunkist #80 | 0.00mi | 2/2.0 (-1) | 1,690 (+13%) | 1mo | $189,900 | $112 | 73 |
| 1400 S Sunkist St #163 | 0.00mi | 2/2.0 (-1) | 1,680 (+12%) | 14mo | $153,000 | $91 | 64 |
Match score weights: distance 35% · size 25% · config 20% · recency 20%. Top-matched comps best support the ARV.
Projected returns pro-forma
-3.0% appreciation · 0.0% rent growth · sell at horizon
- IRR
- -9.1%
- Equity multiple
- 0.68×
- Total profit
- $-32,618
- Equity at exit
- $53,528
- IRR
- -4.3%
- Equity multiple
- 0.76×
- Total profit
- $-24,582
- Equity at exit
- $31,040
Cash invested: $100,520 (down + closing). Projections, not guarantees.
Landlord ↔ Tenant lean methodology
- Overall (STATE)
- 18 Strongly Tenant-Friendly
- State California
- 18 Strongly Tenant-Friendly · D+13
- County
- — inherits STATE
- City
- — inherits STATE
ZIP-level market 92806
- Rents YoY
- -0.8%
- Active inventory
- 41
- Price-to-rent
- 7.7×
Monthly cashflow live
- Estimated rent
- $3,873 high interval (Pro) →
- Mortgage (P&I)
- −$1,883
- Tax est. 1.5%
- −$449 /mo · $5,385/yr
- Insurance
- −$150
- HOA
- −$0
- Vacancy / Maint / Mgmt
- −$813
- Net cashflow
- $579
Break-even live
Sensitivity live
| Price | -10% $827 | -5% $703 | +0% $579 | +5% $454 | +10% $330 |
|---|---|---|---|---|---|
| Rent | -10% $273 | -5% $426 | +0% $579 | +5% $731 | +10% $884 |
| Rate | -1.0pp $759 | -0.5pp $670 | base $579 | +0.5pp $485 | +1.0pp $391 |
UW: 25.0% down · 7.5% · 30yr · 1.5% tax · 5.0% vac · 8.0% maint · 8.0% mgmt
Financing live
Cash to close
- Down payment
- $89,750
- Closing costs
- $10,770
- Reserves months
- —
- Total cash needed
- —
Loan-product check · same deal, 3 products live
Conventional
25% down · 7.5% · 30yr
- Down + closing
- —
- Monthly P&I
- —
- Monthly cashflow
- —
- DSCR
- —
- Eligible?
- —
Personal DTI + credit; lowest rate.
DSCR
20% down · 8.5% · 30yr
- Down + closing
- —
- Monthly P&I
- —
- Monthly cashflow
- —
- DSCR
- —
- Eligible?
- —
No personal income docs; deal must DSCR.
Hard money
10% down · 12.0% · 12mo
- Down + closing
- —
- Monthly P&I
- —
- Monthly cashflow
- —
- DSCR
- —
- Eligible?
- —
Short-term bridge; refi at stabilization.
Rent comps 20 comps
| Address | Beds | Baths | Sqft | Rent | $/sqft | DOM | Units | Dist |
|---|---|---|---|---|---|---|---|---|
| 2100 E Katella Ave Anaheim, CA | 1.0–2.0 | 2.0 | 1205 | $3,810 | $3.16 | 0d | 7 | 0.81mi |
| 1801 E Katella Ave Anaheim, CA | 1.0–2.0 | 1.0–2.0 | 911 | $3,075 | $3.37 | 23d | 6 | 0.84mi |
| 1801 E Katella Ave Anaheim, CA | 1.0–2.0 | 1.0–2.0 | 919 | $3,000 | $3.26 | 0d | 3 | 0.84mi |
| 1801 E Katella Ave Anaheim, CA | 1.0–2.0 | 1.0–2.0 | 911 | $3,075 | $3.37 | 25d | 4 | 0.84mi |
| 1801 E Katella Ave Anaheim, CA | 1.0–2.0 | 1.0–2.0 | 911 | $3,075 | $3.37 | 2d | 4 | 0.84mi |
| 1818 S State College Blvd Anaheim, CA | 1.0–2.0 | 1.0–2.0 | 1033 | $3,280 | $3.17 | 0d | 13 | 0.90mi |
| 987 E Mason Ln #129 Anaheim, CA | 3.0 | 2.5 | 1967 | $4,500 | $2.29 | 18d | 1 | 1.00mi |
| 1730 Anaheim, CA | 4.0 | 3.5 | 2102 | $5,500 | $2.62 | 0d | 1 | 1.00mi |
| 977 E Mason Ln #116 Anaheim, CA | 3.0 | 2.5 | 1967 | $4,300 | $2.19 | 16d | 1 | 1.04mi |
| 1912 S Jacaranda St Anaheim, CA | 3.0 | 1.0–2.0 | 993 | $4,731 | $4.76 | 0d | 21 | 1.11mi |
| 1676 S Lewis St Anaheim, CA | 3.0 | 2.5 | 1821 | $5,200 | $2.86 | 0d | 1 | 1.14mi |
| 1690 S Lewis St Anaheim, CA | 3.0 | 2.5 | 1772 | $12,000 | $6.77 | 0d | 1 | 1.15mi |
| 1893 S Union St #120 Anaheim, CA | 3.0 | 2.0 | 1700 | $3,950 | $2.32 | 22d | 1 | 1.16mi |
| 1815 S Westside Dr Anaheim, CA | 2.0 | 1.0–2.5 | 1033 | $3,995 | $3.87 | 0d | 28 | 1.17mi |
| 1910 S Union St Anaheim, CA | 2.0 | 1.0–2.0 | 1135 | $3,802 | $3.35 | 0d | 19 | 1.17mi |
| 1891 S Union St #111 Anaheim, CA | 2.0 | 2.0 | 1599 | $3,900 | $2.44 | 0d | 1 | 1.17mi |
| 1921 S Union St Anaheim, CA | 3.0 | 1.0–2.0 | 962 | $4,392 | $4.57 | 0d | 17 | 1.23mi |
| 2221 E Viking Ave Anaheim, CA | 3.0 | 2.0 | 1470 | $4,450 | $3.03 | 0d | 1 | 1.27mi |
| 1817 E Morava Ave Anaheim, CA | 3.0 | 2.0 | 1616 | $4,350 | $2.69 | 5d | 1 | 1.29mi |
| 299 N State College Blvd Orange, CA | 2.0 | 1.0–2.0 | 1006 | $4,805 | $4.78 | 0d | 74 | 1.45mi |
Listing history 17 events
-
2026-06-21days on market $359,000 Active 65 DOM
-
2026-06-18days on market $359,000 Active 62 DOM
-
2026-06-17days on market $359,000 Active 61 DOM
-
2026-06-16days on market $359,000 Active 60 DOM
-
2026-06-15days on market $359,000 Active 59 DOM
-
2026-06-13days on market $359,000 Active 57 DOM
-
2026-06-13days on market $359,000 Active 56 DOM
-
2026-06-09days on market $359,000 Active 53 DOM
-
2026-06-08days on market $359,000 Active 52 DOM
-
2026-06-07days on market $359,000 Active 51 DOM
-
2026-06-04days on market $359,000 Active 48 DOM
-
2026-06-03days on market $359,000 Active 47 DOM
-
2026-06-02days on market $359,000 Active 46 DOM
-
2026-06-01days on market $359,000 Active 45 DOM
-
2026-05-31days on market $359,000 Active 44 DOM
-
2026-04-17$359,000 Active
-
2026-04-16historical $359,000
ⓘ Source: listings_history table (triggers on properties + properties_extension) + one-shot
backfill from property_details.listing_events for pre-trigger history.
Climate risk First Street
- Flood 1/10 Low FEMA zone X (shaded) · 0% chance over 30 yrs
- Wildfire 1/10 Low
- Heat 6/10 Major 7 d/yr ≥94°F today · 22 d/yr by 30 yrs out
- Wind 1/10 Low
- Air quality 6/10 Major 12 unhealthy d/yr today · 13 by 30 yrs out
Nearby sold comps map
Loading sold comps map…
Walkable amenities ~0.75 mi
Loading nearby amenities…
Taxation est. · year 1
- Rental income
- $46,473
- − Mortgage interest
- −$20,110
- − Property taxes
- −$5,385
- − Insurance
- −$1,795
- − Repairs & maintenance
- −$3,718
- − Management
- −$3,718
- − Depreciation
- −$10,444
- Taxable income
- $1,304
- Est. tax owed @ 24.0%
- −$313
- After-tax cash flow
- $6,629/yr
For passive investors: Depreciation is non-cash, so a rental often shows a tax loss while cash-flowing — sheltering income. Rental losses are passive: they offset passive income freely, and up to $25,000/yr can offset ordinary (W-2) income if you actively participate and your MAGI is under $100k (phasing out to $0 by $150k); unused losses carry forward. On sale, claimed depreciation is recaptured at up to 25%, and gains may owe capital-gains tax (a 1031 exchange can defer both). Figures are a year-1 estimate at your 24.0% rate — not tax advice; consult a CPA.
Schools (NCES district)
- District
- Anaheim Elementary
- NCES district ID
- 0602610
- Math proficiency
- 25% ▼ -3.00%
- Reading proficiency
- 25% ▼ -9.00%
- Median HH income
- $55,235
- Composite
- 22.56/100
- National rank
- #8078
- State rank
- #386 of 517 in CA
Livability — Anaheim
- Score
- 70/100
- State rank
- #240
- US rank
- #7861
Category grades
Schools grade is shown separately in the Schools card above.
Census & demographics
- Census place
- Anaheim, CA
- County
- Orange County · 3,096,323 people
- City population
- 361,715
- Metro
- Los Angeles-Long Beach-Anaheim, CA
- Population (ZIP)
- 41,003
- Household income
- $97,265
- Rent vs Own
- Severe rent burden
- 2171.0
Population outlook (Orange County) Hauer SSP2
- Today (2025)
- 3,477,456 people
- By 2030
- 3,613,117 · +3.9%
- By 2040
- 3,835,945 · +10.3%
- By 2050
- 3,968,736 · +14.1%
- By 2075
- 4,097,053 · +17.8%
- By 2100
- 3,903,633 · +12.3%
Race, ethnicity, and origin ACS 2023
- Neighborhood character
- Diverse neighborhood (Simpson 0.59)
- Race & ethnicity
- Hispanic / Latino 58% Two or more races 25% White 24% Asian 13% Black 2% Native American 2%
- Hispanic origin (detail)
- Mexican 54%
- Common ancestry
- Portuguese 1% Lithuanian 1% Scandinavian 1%
- Foreign-born
- 31% · Canada, Vietnam, China
- Languages at home
- 43% English-only · Spanish 44% Vietnamese 3% Other Indo-European 3%
Political lean MEDSL · Orange
- 2024 margin
- Toss-up / Even · D 49.7% · R 47.1% · Other 3.2%
- 2008→2024 swing
- +5.2pp toward D · 2008: -2.6pp · 2024: 2.6pp
- All cycles
- 2024: D+2.6 2020: D+9.0 2016: D+7.7 2012: R+8.3 2008: R+2.6
Not yet ingested
- Civics
- —
Market trends
- HPI YoY
- ▼ -783.76%
- Current HPI
- 404.0916
- Rent YoY
- ▼ -0.79%
- Metro
- Los Angeles-Long Beach-Anaheim, CA
- State GDP YoY
- ▲ 3.21%
- F500 in state
- 116
Industry mix (Fortune 500 HQ in CA)
| Industry | F500 HQs | Revenue |
|---|---|---|
| Technology | 27 | $1,492B |
|
||
| Financial Services | 3 | $174B |
|
||
| Retail | 3 | $44B |
|
||
| Insurance | 3 | $26B |
|
||
| Media / Entertainment | 2 | $115B |
|
||
| Pharmaceuticals / Biotech | 2 | $62B |
|
||
Price history
+0.0% since first listed2 events — show timeline
- 2026-04-17 Listed $359,000 CRMLS
- 2026-04-16 Coming Soon $359,000 CRMLS
Property tax history
-1.3%/yrLatest (2025): $138 · +3.4% YoY. Source: county tax records.
Cash-flow waterfall
monthlySold comps — $/sqft
last 12 mo · ≤1 miLoading sold comps…