10211 Sugar Branch Dr #396 · Houston, TX
Flood risk 1/10 · Minimal
- FEMA flood zone
- X (shaded)
- Chance of flooding over 30 yrs
- 0.0%
- Est. flood insurance / yr
- $507 – $1,088
Fire risk 1/10 · Minimal
- Est. fire insurance / yr
- $1,222 – $2,270
Heat risk 9/10 · Severe
- Hot days now (above 111°F)
- 7 days/yr
- Hot days in 30 yrs
- 24 days/yr
Wind risk 9/10 · Severe
- Chance of severe wind over 30 yrs
- 99.0%
Air-quality risk 2/10 · Minimal
- Unhealthy air days now
- 2 days/yr
- Unhealthy air days in 30 yrs
- 2 days/yr
Risk factors via First Street. Map © Google.
Why this score? — see what drove the D grade
The composite is a weighted blend of 9 inputs, each scored 0–100. Each bar is that input's sub-score; the figure is the points it added to the 100-point composite (weight × sub-score).
- 1% rule +10.0/10.0
- ARV discount +7.5/15.0
- Cash flow +7.3/30.0
- Appreciation +4.6/10.0
- Livability +3.7/5.0
- Condition / age +2.5/5.0
- Schools +2.1/10.0
- DSCR +1.5/10.0
- Rent growth +0.8/5.0
$77,000
🖨 Deal sheet 📄 Offer letter ✓ Due diligence
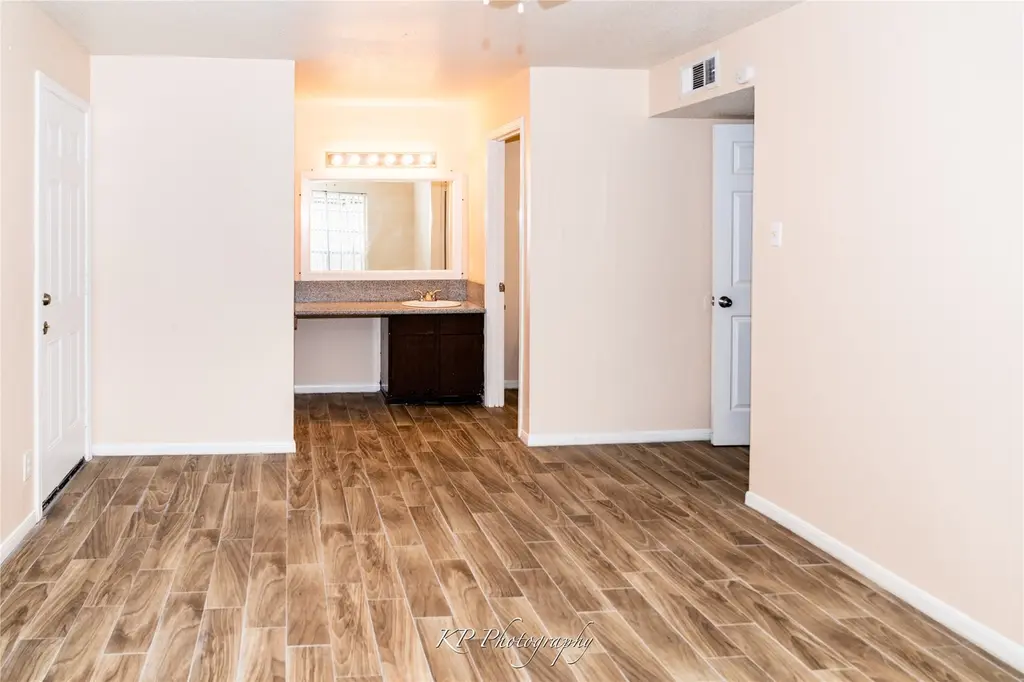
Listing remarks
Spacious 2 bedroom 2 bath condo. Ready for its new home owner or tenant. Located in a gated community with a private balcony from living room. Stacked washer & dryer connection available, all appliances in the condo are included in sale.
Key facts
- Gated community
- Private balcony
- $421 HOA
Tags
Property features AI
Finance
- Financial info: Lease considered
- HOA & community: Forum Park Three HOA with monthly fee; HOA fee covers common areas, gas, insurance, grounds and structure maintenance, sewer and water
Exterior
- Utilities: Public water; Public sewer
- Home design: Single-story residential property; Full ownership; Entry level: single level
- Construction: Built in 1982; Brick and wood siding exterior; Shingle and wood roof; Slab foundation
- Exterior features: Community pool; Gated community
Interior
- Bathrooms: Two full bathrooms
- Heating & cooling: Central heating (electric); Central air conditioning (electric)
- Interior features: One fireplace; Two total rooms
Neighborhood map
What this means for you Summary
Snapshot
- This is a 2-bed/2.0-bath condo listed at $77k.
Deal economics
- At list price, monthly cash flow is $-102 ($-1k/yr) — negative.
- To cash-flow at today's rent, offer at most $59k (23.3% below list).
- Meets the 1% rule at list price ($1k rent vs $77k).
- Recommended offer: $59k (23.3% below list) — sets the bar for cash-flow.
- Cap rate 4.7% vs local median 3.2% in Houston — top-decile yield for the area; either an underpriced asset or a hidden risk that comps aren't pricing in. Stress-test before assuming the spread holds.
Location & tenants
- Location reads 74/100 on livability (#184 in TX, #4,771 nationally) — a middle-class / working-renter tenant base. Strengths: amenities A+, cost of living A+, housing A+; Watch: crime F.
- Alief ISD (urban): math 23% / reading 28% proficiency, ranked #717 of 826 in TX (top 87%) — low school quality limits family demand, transient renter base, plan for 1-2y turnover; 74% free/reduced lunch — lower-income household profile, screen leases tightly.
- Zoned schools: Olle Middle (math 16% / reading 32%, grade F, #1,301 of 1,662 statewide, top 79%, 1,067 students, 90% FRL) — zoned schools average 90% FRL vs 74% district-wide (15 pts higher); higher-poverty schools than district average — tighter screening recommended.
- Market conditions: Rents falling (-6.6%/yr); 200 active listings in the ZIP; 40 comparable units currently listed for rent nearby; rentals at typical pace (median 25d on market — plan ~3-4 weeks tenant-placement turnaround); 42% of comp listings sitting > 30 days — soft ceiling on asking rent; 29,883 units permitted in Harris County in 2024 (8,621 in 5+ unit buildings).
- This rent runs 31% of the median local income ($46k/yr) — at the standard rent-burdened threshold; future hikes will face affordability resistance.
Forward outlook
- Local home prices are declining (-0.7%/yr); year-one equity from $532 of loan paydown is wiped out by about $563 of value loss. Plan a longer hold.
- Harris County population projected at +47% by 2050 — long-run rental-demand tailwind backs the buy-and-hold thesis.
Negotiation context
- It's been on market 16 days — a 2% lower offer ($76k) is reasonable based on typical stale-listing flexibility.
- 2 sale attempts since 22y ago with the ask held roughly flat each time — persistent listings suggest the price (not the market) is what's stuck; bring a comps-based counter.
Risks & watch-outs
- Watch-outs: property tax is 2.8% of price; HOA is 36% of rent.
- Climate carrying-cost: severe wind risk, 99% chance of damaging wind over 30y; extreme-heat days projected 7→24/yr by 2055 (HVAC capex compounding) — expect insurance premiums to compound above CPI over the hold.
Questions for the listing agent
- What do current leases actually rent for vs. the listed asking? Can we see a recent rent roll and the last 12 months of T-12 income?
- Property tax is high relative to price — has the assessment been appealed recently, and will the sale trigger a re-assessment?
- What does the HOA fee cover, when was the last increase, and are there any pending special assessments or reserve-fund shortfalls?
- Any open or pending special assessments — roof, HVAC, plumbing, elevator, façade? What's the per-unit balance and payoff schedule, and is the seller paying it off at close or rolling it to the buyer?
- Is there a deadline driving the sale (1031 exchange, divorce, estate, relocation)? That informs how much negotiation room exists.
- Schools are D-rated, which usually means shorter tenancies and higher turnover. Who's the typical renter profile here, and what's been the actual vacancy rate?
- Crime grade is F in this area — have there been break-ins, vandalism, or insurance claims at this property in the last 3 years? What carrier currently insures it and at what premium?
- The area grade is low — what's the realistic commute time and amenity access for the typical tenant pool here? Any planned neighborhood developments (good or bad) we should know about?
- What's the average days-on-market for RENTAL listings here right now (not sales)? A rising rental-DOM trend means longer vacancies and softer asking-rent achievability than the comps imply.
- What's the recent tenant-quality profile in this submarket — average credit score on applications, eviction rate, late-payment / NSF rate, and stable-employment percentage? A property-management company in the area should have these aggregated.
- How much new apartment / multifamily construction is in the pipeline within 1–3 miles? Heavy new supply (>2% of stock underway) typically softens rents 12–24 months out; light construction supports rent growth.
Investment metrics
- 1% rule
- 1.54% ✓
- Cap rate
- 4.71%
- Cash-on-cash
- -5.65%
- DSCR
- 0.75
- GRM
- 5.4
CMA / ARV
No comps found within radius.
Projected returns pro-forma
-0.73% appreciation · 0.0% rent growth · sell at horizon
- IRR
- -16.0%
- Equity multiple
- 0.33×
- Total profit
- $-14,472
- Equity at exit
- $19,585
- IRR
- -15.0%
- Equity multiple
- -0.19×
- Total profit
- $-25,764
- Equity at exit
- $21,430
Cash invested: $21,560 (down + closing). Projections, not guarantees.
Landlord ↔ Tenant lean methodology
- Overall (STATE)
- 87 Strongly Landlord-Friendly
- State Texas
- 87 Strongly Landlord-Friendly · R+5
- County
- — inherits STATE
- City
- — inherits STATE
ZIP-level market 77036
- Home prices YoY
- -0.3%
- Rents YoY
- -6.6%
- Active inventory
- 200
- Price-to-rent
- 5.4×
Monthly cashflow live
- Estimated rent
- $1,185 high interval (Pro) →
- Mortgage (P&I)
- −$404
- Tax from tax record
- −$181 /mo · $2,169/yr
- Insurance
- −$32
- HOA
- −$421
- Vacancy / Maint / Mgmt
- −$249
- Net cashflow
- $-102
Break-even live
UW: 25.0% down · 7.5% · 30yr · 1.5% tax · 5.0% vac · 8.0% maint · 8.0% mgmt
Financing live
Cash to close
- Down payment
- $19,250
- Closing costs
- $2,310
- Reserves months
- —
- Total cash needed
- —
Loan-product check · same deal, 3 products live
Conventional
25% down · 7.5% · 30yr
- Down + closing
- —
- Monthly P&I
- —
- Monthly cashflow
- —
- DSCR
- —
- Eligible?
- —
Personal DTI + credit; lowest rate.
DSCR
20% down · 8.5% · 30yr
- Down + closing
- —
- Monthly P&I
- —
- Monthly cashflow
- —
- DSCR
- —
- Eligible?
- —
No personal income docs; deal must DSCR.
Hard money
10% down · 12.0% · 12mo
- Down + closing
- —
- Monthly P&I
- —
- Monthly cashflow
- —
- DSCR
- —
- Eligible?
- —
Short-term bridge; refi at stabilization.
Rent comps 40 comps
| Address | Beds | Baths | Sqft | Rent | $/sqft | DOM | Units | Dist |
|---|---|---|---|---|---|---|---|---|
| 10286 Forum West Dr Houston, TX | 2.0 | 2.0 | 1046 | $1,200 | $1.15 | 24d | 1 | 0.07mi |
| 10101 W Sam Houston Pkwy S Houston, TX | 1.0–2.0 | 1.0–2.0 | 809 | $1,145 | $1.41 | 44d | 1 | 0.13mi |
| 10110 Forum Park Dr Houston, TX | 1.0–2.0 | 1.0–2.0 | 976 | $999 | $1.02 | 44d | 2 | 0.15mi |
| 10225 Bissonnet St Houston, TX | 1.0–2.0 | 1.0–2.5 | 992 | $1,480 | $1.49 | 2d | 49 | 0.28mi |
| 9898 Forum Park Dr Unit 6406 Houston, TX | 1.0 | 1.0 | 750 | $925 | $1.23 | 44d | 1 | 0.32mi |
| 10107 Forum Park Dr Houston, TX | 2.0 | 2.0 | 1100 | $970 | $0.88 | 24d | 1 | 0.33mi |
| 10101 Forum Park Dr Houston, TX | 1.0–2.0 | 1.0–2.0 | 825 | $1,323 | $1.60 | 2d | 21 | 0.34mi |
| 10009 Forum Park Dr Houston, TX | 2.0 | 2.0 | 969 | $979 | $1.01 | 24d | 1 | 0.37mi |
| 10440 South Dr Houston, TX | 1.0–2.0 | 1.0–2.0 | 773 | $1,340 | $1.73 | 1d | 27 | 0.40mi |
| 9707 Forum Park Dr Houston, TX | 2.0 | 2.0 | 1147 | $992 | $0.86 | 44d | 1 | 0.42mi |
| 9502 Woodfair Dr Houston, TX | 1.0–2.0 | 1.0–2.0 | 711 | $1,093 | $1.54 | 3d | 31 | 0.63mi |
| 9502 Woodfair Dr Houston, TX | 1.0–2.0 | 1.0 | 636 | $950 | $1.49 | 44d | 31 | 0.63mi |
| 10306 S Wilcrest Dr Houston, TX | 3.0 | 2.0 | 1200 | $1,349 | $1.12 | 44d | 1 | 0.64mi |
| 9430 Concourse Dr Houston, TX | 1.0 | 1.0 | 719 | $842 | $1.17 | 13d | 1 | 0.69mi |
| 10300 S Wilcrest Dr Unit 10333 Houston, TX | 3.0 | 2.0 | 1200 | $1,321 | $1.10 | 3d | 1 | 0.70mi |
| 9475 W Sam Houston Pkwy S Houston, TX | 1.0–2.0 | 1.0–2.0 | 725 | $1,284 | $1.77 | 5d | 18 | 0.70mi |
| 9445 Concourse Dr Houston, TX | 1.0–2.0 | 1.0–2.0 | 715 | $1,104 | $1.54 | 1d | 21 | 0.72mi |
| 14 W Sam Houston Pkwy S Houston, TX | 2.0 | 2.0 | 1000 | $1,054 | $1.05 | 24d | 1 | 0.73mi |
| 9350 Country Creek St Houston, TX | 3.0 | 2.0 | 1272 | $1,500 | $1.18 | 44d | 1 | 0.85mi |
| 9303 Woodfair Dr Houston, TX | 1.0–2.0 | 1.0–2.0 | 791 | $1,045 | $1.32 | 44d | 42 | 0.90mi |
| 8606 S Course Dr Houston, TX | 2.0 | 2.0 | 913 | $1,050 | $1.15 | 44d | 1 | 0.93mi |
| 9907 Club Creek Dr Houston, TX | 2.0 | 1.0 | 1170 | $1,120 | $0.96 | 24d | 1 | 1.00mi |
| 10411 South Dr Houston, TX | 1.0–2.0 | 1.0–2.0 | 757 | $1,495 | $1.97 | 44d | 1 | 1.00mi |
| 8600 S Course Dr Houston, TX | 1.0–2.0 | 1.0–2.0 | 706 | $1,218 | $1.72 | 1d | 31 | 1.01mi |
| 9901 Club Creek Dr Houston, TX | 1.0–3.0 | 1.0–2.0 | 855 | $992 | $1.16 | 1d | 13 | 1.01mi |
| 10925 Stancliff Rd Houston, TX | 2.0 | 2.0 | 931 | $1,425 | $1.53 | 44d | 1 | 1.02mi |
| 9255 W Sam Houston Pkwy S Houston, TX | 1.0 | 1.0 | 750 | $1,049 | $1.40 | 44d | 1 | 1.04mi |
| 10919 Stancliff Rd Unit 10976 Houston, TX | 2.0 | 2.0 | 931 | $1,544 | $1.66 | 44d | 1 | 1.05mi |
| 10919 Stancliff Rd Unit 2162 Houston, TX | 2.0 | 2.0 | 931 | $1,519 | $1.63 | 5d | 1 | 1.05mi |
| 10919 Stancliff Rd Unit 2112 Houston, TX | 2.0 | 2.0 | 931 | $1,511 | $1.62 | 3d | 1 | 1.05mi |
| 10919 Stancliff Rd Unit 422 Houston, TX | 2.0 | 2.0 | 931 | $1,519 | $1.63 | 7d | 1 | 1.05mi |
| 10919 Stancliff Rd Unit 3174 Houston, TX | 3.0 | 2.0 | 1239 | $1,923 | $1.55 | 10d | 1 | 1.05mi |
| 10919 Stancliff Rd Unit 10952 Houston, TX | 3.0 | 2.0 | 1346 | $1,974 | $1.47 | 44d | 1 | 1.05mi |
| 10919 Stancliff Rd Unit 3148 Houston, TX | 3.0 | 2.0 | 1239 | $1,891 | $1.53 | 3d | 1 | 1.05mi |
| 10919 Stancliff Rd Unit 2174 Houston, TX | 2.0 | 2.0 | 931 | $1,543 | $1.66 | 10d | 1 | 1.05mi |
| 9797 Leawood Blvd Houston, TX | 2.0 | 2.0 | 1095 | $1,175 | $1.07 | 44d | 2 | 1.05mi |
| 10919 Stancliff Rd Unit 3047 Houston, TX | 3.0 | 2.0 | 1239 | $1,934 | $1.56 | 11d | 1 | 1.06mi |
| 10919 Stancliff Rd Houston, TX | 2.0 | 2.0 | 931 | $1,529 | $1.64 | 44d | 1 | 1.06mi |
| 10250 Lands End Dr Houston, TX | 2.0 | 1.0–2.0 | 750 | $1,399 | $1.86 | 24d | 16 | 1.10mi |
| 10356 Lands End Dr Houston, TX | 3.0 | 2.0 | 1133 | $1,377 | $1.22 | 44d | 1 | 1.14mi |
HOA detail condo
- Monthly dues
- $421 · $5,052/yr
- Likely covers
- security
- Assessments
- None detected in remarks — confirm with the listing agent.
Listing history 11 events
-
2026-06-18days on market $77,000 Active 16 DOM
-
2026-06-17days on market $77,000 Active 15 DOM
-
2026-06-16days on market $77,000 Active 14 DOM
-
2026-06-15days on market $77,000 Active 13 DOM
-
2026-06-13days on market $77,000 Active 11 DOM
-
2026-06-09days on market $77,000 Active 7 DOM
-
2026-06-08days on market $77,000 Active 6 DOM
-
2026-06-07days on market $77,000 Active 5 DOM
-
2026-06-04days on market $77,000 Active 2 DOM
-
2026-06-02remarks 239-char remark
-
2026-06-02$77,000 Active 1 DOM
ⓘ Source: listings_history table (triggers on properties + properties_extension) + one-shot
backfill from property_details.listing_events for pre-trigger history.
Tax reassessment forecast TX · Resets to sale price
- Current annual tax
- $2,169 · $181/mo
- Projected year-2 tax
- $2,169 · $181/mo
- Expected delta
- $0/yr ($0/mo · 0.0%)
ⓘ Screening estimate from a state-policy table — verify with the county assessor before closing.
Climate risk First Street
- Flood 1/10 Low FEMA zone X (shaded) · 0% chance over 30 yrs
- Wildfire 1/10 Low
- Heat 9/10 Extreme 7 d/yr ≥111°F today · 24 d/yr by 30 yrs out
- Wind 9/10 Extreme 99% chance of damaging wind over 30 yrs
- Air quality 2/10 Low 2 unhealthy d/yr today · 2 by 30 yrs out
Nearby sold comps map
Loading sold comps map…
Walkable amenities ~0.75 mi
Loading nearby amenities…
Taxation est. · year 1
- Rental income
- $14,218
- − Mortgage interest
- −$4,313
- − Property taxes
- −$2,169
- − Insurance
- −$385
- − Repairs & maintenance
- −$1,137
- − Management
- −$1,137
- − HOA
- −$5,052
- − Depreciation
- −$2,240
- Taxable loss
- −$2,215
- Est. tax savings @ 24.0%
- +$532
- After-tax cash flow
- $-687/yr
For passive investors: Depreciation is non-cash, so a rental often shows a tax loss while cash-flowing — sheltering income. Rental losses are passive: they offset passive income freely, and up to $25,000/yr can offset ordinary (W-2) income if you actively participate and your MAGI is under $100k (phasing out to $0 by $150k); unused losses carry forward. On sale, claimed depreciation is recaptured at up to 25%, and gains may owe capital-gains tax (a 1031 exchange can defer both). Figures are a year-1 estimate at your 24.0% rate — not tax advice; consult a CPA.
Schools (NCES district)
- District
- Alief ISD
- NCES district ID
- 4807830
- Math proficiency
- 23% ▼ -19.00%
- Reading proficiency
- 28% ▼ -8.00%
- Median HH income
- $37,775
- Composite
- 21.29/100
- National rank
- #8391
- State rank
- #717 of 826 in TX
Livability — Houston
- Score
- 74/100
- State rank
- #184
- US rank
- #4771
Category grades
Schools grade is shown separately in the Schools card above.
Census & demographics
- Census place
- Houston, TX
- County
- Harris County · 4,702,590 people
- City population
- 3,226,434
- Metro
- Houston-The Woodlands-Sugar Land, TX
- Population (ZIP)
- 71,770
- Household income
- $45,716
- Rent vs Own
- Severe rent burden
- 4374.0
Population outlook (Harris County) Hauer SSP2
- Today (2025)
- 5,571,493 people
- By 2030
- 6,089,821 · +9.3%
- By 2040
- 7,142,806 · +28.2%
- By 2050
- 8,185,864 · +46.9%
- By 2075
- 10,574,329 · +89.8%
- By 2100
- 12,109,958 · +117.4%
Race, ethnicity, and origin ACS 2023
- Neighborhood character
- Predominantly Hispanic (71%)
- Race & ethnicity
- Hispanic / Latino 71% Two or more races 28% Black 11% Asian 9% White 7%
- Hispanic origin (detail)
- Mexican 33% Cuban 3%
- Foreign-born
- 55% · Canada, China, Vietnam
- Languages at home
- 20% English-only · Spanish 66% Chinese 5% Vietnamese 2%
Political lean MEDSL · Harris
- 2024 margin
- Lean D (+5.5) · D 52.0% · R 46.4% · Other 1.6%
- 2008→2024 swing
- +3.9pp toward D · 2008: 1.6pp · 2024: 5.5pp
- All cycles
- 2024: D+5.5 2020: D+13.3 2016: D+12.4 2012: D+0.1 2008: D+1.6
Not yet ingested
- Civics
- —
Market trends
- HPI YoY
- ▼ -0.73%
- Current HPI
- 221.1045
- Rent YoY
- ▼ -6.62%
- Metro
- Houston-The Woodlands-Sugar Land, TX
- State GDP YoY
- ▲ 3.95%
- F500 in state
- 110
Industry mix (Fortune 500 HQ in TX)
| Industry | F500 HQs | Revenue |
|---|---|---|
| Energy | 16 | $1,198B |
|
||
| Technology | 5 | $198B |
|
||
| Engineering / Construction | 4 | $72B |
|
||
| Energy Services | 3 | $60B |
|
||
| Utilities | 3 | $41B |
|
||
| Healthcare | 2 | $330B |
|
||
Price history
-89.6% since first listed8 events — show timeline
- 2026-06-02 Listed $77,000 HARMLS
- 2015-04-07 Sold (Public Records) — Public Records
- 2015-03-25 Sold (Public Records) — Public Records
- 2014-07-09 Sold (Public Records) — Public Records
- 2005-12-28 Sold (Public Records) — Public Records
- 2004-09-14 Listing Removed — HARMLS
- 2004-08-10 Listed $742,500 HARMLS
- 1998-12-08 Sold (Public Records) — Public Records
Property tax history
+9.8%/yrLatest (2025): $2,169 · -0.8% YoY. Source: county tax records.
Cash-flow waterfall
monthlySold comps — $/sqft
last 12 mo · ≤1 miLoading sold comps…