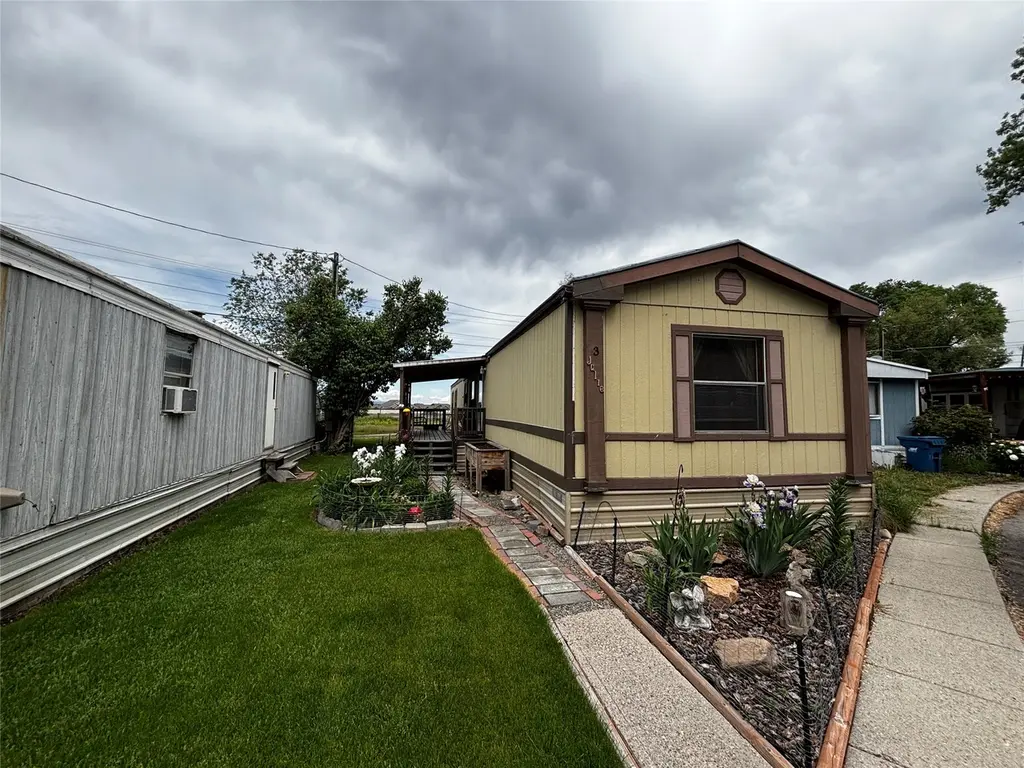
3 Julie Ave · Missoula, MT
Flood risk 4/10 · Minor
- FEMA flood zone
- X (unshaded)
- Chance of flooding over 30 yrs
- 0.21%
- Est. flood insurance / yr
- $507 – $1,088
Fire risk 8/10 · Major
- Est. fire insurance / yr
- $918 – $1,706
Heat risk 3/10 · Minor
- Hot days now (above 92°F)
- 6 days/yr
- Hot days in 30 yrs
- 13 days/yr
Wind risk 1/10 · Minimal
- Chance of severe wind over 30 yrs
- —
Air-quality risk 10/10 · Severe
- Unhealthy air days now
- 26 days/yr
- Unhealthy air days in 30 yrs
- 32 days/yr
Risk factors via First Street. Map © Google.
Why this score? — see what drove the B grade
The composite is a weighted blend of 9 inputs, each scored 0–100. Each bar is that input's sub-score; the figure is the points it added to the 100-point composite (weight × sub-score).
- Cash flow +30.0/30.0
- 1% rule +10.0/10.0
- DSCR +10.0/10.0
- ARV discount +7.5/15.0
- Livability +4.0/5.0
- Schools +3.5/10.0
- Rent growth +3.1/5.0
- Condition / age +2.2/5.0
- Appreciation +0.0/10.0
$99,000
🖨 Deal sheet 📄 Offer letter ✓ Due diligence
Key facts
- Covered front porch
- Spacious kitchen
- Additional parking
Tags
Property features AI
Finance
- HOA & community: Has homeowners association; Association fee $640 monthly; Association amenities include parking; Association fee includes water, sewer, and trash
Exterior
- Parking: Additional parking; Association provides parking
- Utilities: Water included in association fee; Sewer included in association fee; Trash included in association fee; Land is leased
- Home design: Manufactured home (Single Wide); Residential property
- Construction: Foundation: see remarks
- Exterior features: Located in a mobile home park; Additional parking
Interior
- Kitchen: Dishwasher; Range; Refrigerator
- Bathrooms: 2 full bathrooms
- Interior features: Dryer; Dishwasher; Range; Refrigerator; Washer
- Laundry & utility: Washer hookup; Washer; Dryer
Neighborhood map
What this means for you Summary
Snapshot
- This is a 3-bed/2.0-bath single-family listed at $99k. Condition is rated fair.
Deal economics
- At list price, monthly cash flow is $537 ($6k/yr) — positive.
- The deal already cash-flows at list — no discount required.
- Meets the 1% rule at list price ($2k rent vs $99k).
- Recommended offer: $98k (1.5% below list) — sets the bar for market timing.
- Cap rate 12.8% vs local median 1.7% in Missoula — top-decile yield for the area; either an underpriced asset or a hidden risk that comps aren't pricing in. Stress-test before assuming the spread holds.
Location & tenants
- Location reads 79/100 on livability (#17 in MT, #2,351 nationally) — a middle-class / working-renter tenant base. Strengths: amenities A+, commute A+, health & safety A+; Watch: employment C-, crime F.
- Missoula H S (urban): math 31% / reading 52% proficiency, ranked #53 of 116 in MT (top 46%) — families likely to look elsewhere, expect single-tenant / working-renter base with shorter leases.
- Market conditions: Rents rising (+2.4%/yr); 248 active listings in the ZIP; 7 comparable units currently listed for rent nearby; rentals lingering (median 44d on market — plan ~5-8 weeks vacancy on turnover, expect pricing pressure); 100% of comp listings sitting > 30 days — soft ceiling on asking rent; solid renter incomes; 773 units permitted in Missoula County in 2024 (354 in 5+ unit buildings).
- This rent runs 35% of the median local income ($80k/yr) — at the standard rent-burdened threshold; future hikes will face affordability resistance.
Forward outlook
- Local home prices are declining (-3.0%/yr); year-one equity from $684 of loan paydown is wiped out by about $3k of value loss. Plan a longer hold.
- Missoula County population projected at +23% by 2050 — long-run rental-demand tailwind backs the buy-and-hold thesis.
- At projected returns (-3.0% appreciation + 2.4% rent growth), your $28k cash investment doubles in ~6 years — after that, you're playing with house money.
Negotiation context
- It's been on market 16 days — a 2% lower offer ($98k) is reasonable based on typical stale-listing flexibility.
Risks & watch-outs
- Watch-outs: HOA is 27% of rent.
- Climate carrying-cost: severe wildfire risk — expect insurance premiums to compound above CPI over the hold.
Questions for the listing agent
- Have any recent inspections been done? Can we get a copy of the seller's disclosures and any deferred-maintenance estimates?
- What does the HOA fee cover, when was the last increase, and are there any pending special assessments or reserve-fund shortfalls?
- Is there a deadline driving the sale (1031 exchange, divorce, estate, relocation)? That informs how much negotiation room exists.
- Schools are B-rated — typically a magnet for longer-tenancy family renters. What's the average tenant stay here, and is there a school-zone premium baked into asking?
- Crime grade is F in this area — have there been break-ins, vandalism, or insurance claims at this property in the last 3 years? What carrier currently insures it and at what premium?
- What's the average days-on-market for RENTAL listings here right now (not sales)? A rising rental-DOM trend means longer vacancies and softer asking-rent achievability than the comps imply.
- What's the recent tenant-quality profile in this submarket — average credit score on applications, eviction rate, late-payment / NSF rate, and stable-employment percentage? A property-management company in the area should have these aggregated.
- How much new for-sale + rental construction is in the pipeline within 1–3 miles? Heavy new supply typically softens prices + rents 12–24 months out; constrained supply supports both.
Investment metrics
- 1% rule
- 2.38% ✓
- Cap rate
- 12.80%
- Cash-on-cash
- 23.25%
- DSCR
- 2.03
- GRM
- 3.5
CMA / ARV
- ARV (on-the-fly)
- $470,592
- Comps found
- 12
Show comp detail 12 sales within ~0.75 mi
| Address | Dist | Beds/Ba | Sqft | Sold | Price | $/sf | Match |
|---|---|---|---|---|---|---|---|
| 2845 Mary Jane Blvd | 0.39mi | 3/2.0 | 1,259 (+4%) | 4mo | $465,000 | $369 | 73 |
| 2629 Mary Jane Blvd | 0.50mi | 3/2.0 | 1,243 (+2%) | 4mo | $514,000 | $414 | 70 |
| 3005 Mary Jane Blvd | 0.39mi | 3/2.0 | 1,259 (+4%) | 7mo | $450,000 | $357 | 70 |
| 2960 Sheffield Dr | 0.31mi | 3/2.0 | 1,296 (+7%) | 9mo | $515,000 | $397 | 67 |
| 3814 Standish Way | 0.20mi | 3/2.0 | 1,340 (+10%) | 9mo | $524,900 | $392 | 66 |
| 2920 Sheffield Dr | 0.31mi | 3/2.0 | 1,296 (+7%) | 11mo | $529,000 | $408 | 66 |
| 3817 Concord Dr | 0.29mi | 3/2.0 | 1,299 (+7%) | 12mo | $525,000 | $404 | 65 |
| 4328 Bantry Ct | 0.69mi | 3/2.0 | 1,255 (+3%) | 1mo | $429,000 | $342 | 61 |
| 15 Pamela St | 0.09mi | 2/1.0 (-1) | 1,056 (-13%) | 7mo | $20,000 | $19 | 59 |
| 2987 Mary Jane Blvd | 0.39mi | 3/2.0 | 1,371 (+13%) | 6mo | $449,900 | $328 | 56 |
| 3086 Stratford Ln | 0.42mi | 3/2.0 | 1,372 (+13%) | 10mo | $530,000 | $386 | 51 |
| 2259 Depot Way | 0.64mi | 3/2.5 | 1,344 (+10%) | 1mo | $520,000 | $387 | 50 |
Match score weights: distance 35% · size 25% · config 20% · recency 20%. Top-matched comps best support the ARV.
Projected returns pro-forma
-3.0% appreciation · 2.35% rent growth · sell at horizon
- IRR
- 15.5%
- Equity multiple
- 1.62×
- Total profit
- $17,061
- Equity at exit
- $14,761
- IRR
- 23.6%
- Equity multiple
- 2.96×
- Total profit
- $54,442
- Equity at exit
- $8,560
Cash invested: $27,720 (down + closing). Projections, not guarantees.
Landlord ↔ Tenant lean methodology
- Overall (STATE)
- 82 Strongly Landlord-Friendly
- State Montana
- 82 Strongly Landlord-Friendly · R+11
- County
- — inherits STATE
- City
- — inherits STATE
ZIP-level market 59808
- Rents YoY
- 2.4%
- Active inventory
- 248
- Price-to-rent
- 3.5×
Monthly cashflow live
- Estimated rent
- $2,356 high interval (Pro) →
- Mortgage (P&I)
- −$519
- Tax est. 1.5%
- −$124 /mo · $1,485/yr
- Insurance
- −$41
- HOA
- −$640
- Vacancy / Maint / Mgmt
- −$495
- Net cashflow
- $537
Break-even live
UW: 25.0% down · 7.5% · 30yr · 1.5% tax · 5.0% vac · 8.0% maint · 8.0% mgmt
Financing live
Cash to close
- Down payment
- $24,750
- Closing costs
- $2,970
- Reserves months
- —
- Total cash needed
- —
Loan-product check · same deal, 3 products live
Conventional
25% down · 7.5% · 30yr
- Down + closing
- —
- Monthly P&I
- —
- Monthly cashflow
- —
- DSCR
- —
- Eligible?
- —
Personal DTI + credit; lowest rate.
DSCR
20% down · 8.5% · 30yr
- Down + closing
- —
- Monthly P&I
- —
- Monthly cashflow
- —
- DSCR
- —
- Eligible?
- —
No personal income docs; deal must DSCR.
Hard money
10% down · 12.0% · 12mo
- Down + closing
- —
- Monthly P&I
- —
- Monthly cashflow
- —
- DSCR
- —
- Eligible?
- —
Short-term bridge; refi at stabilization.
Rent comps 7 comps
| Address | Beds | Baths | Sqft | Rent | $/sqft | DOM | Units | Dist |
|---|---|---|---|---|---|---|---|---|
| 3705 England Blvd Missoula, MT | 3.0 | 2.0 | 1275 | $2,525 | $1.98 | 43d | 1 | 0.37mi |
| 3735 W Broadway St Missoula, MT | 1.0–3.0 | 1.0–2.0 | 1050 | $2,600 | $2.48 | 43d | 6 | 0.50mi |
| 4000 Mullan Rd Missoula, MT | 1.0–3.0 | 1.0–2.0 | 1041 | $2,995 | $2.88 | 43d | 8 | 0.78mi |
| 2175 Sagebrush Rd Missoula, MT | 1.0–3.0 | 1.0–2.0 | 1055 | $3,116 | $2.95 | 43d | 128 | 0.84mi |
| 2620 George Elmer Dr Missoula, MT | 1.0–2.0 | 1.0 | 734 | $1,700 | $2.31 | 43d | 35 | 1.15mi |
| 5306 Elyn Loop Missoula, MT | 1.0–2.0 | 1.0–2.0 | 891 | $2,065 | $2.32 | 43d | 35 | 1.34mi |
| 4710 Expressway Missoula, MT | 1.0–2.0 | 1.0 | 780 | $1,375 | $1.76 | 43d | 4 | 1.37mi |
HOA detail
- Monthly dues
- $640 · $7,680/yr
Listing history 13 events
-
2026-06-19days on market $99,000 Active 16 DOM
-
2026-06-18price $99,000 Active 15 DOM
-
2026-06-18days on market $110,000 Active 15 DOM
-
2026-06-17days on market $110,000 Active 14 DOM
-
2026-06-16days on market $110,000 Active 13 DOM
-
2026-06-15days on market $110,000 Active 12 DOM
-
2026-06-14days on market $110,000 Active 10 DOM
-
2026-06-13days on market $110,000 Active 9 DOM
-
2026-06-10days on market $110,000 Active 7 DOM
-
2026-06-09days on market $110,000 Active 6 DOM
-
2026-06-08days on market $110,000 Active 5 DOM
-
2026-06-07days on market $110,000 Active 4 DOM
-
2026-06-03$110,000 Active 1 DOM
ⓘ Source: listings_history table (triggers on properties + properties_extension) + one-shot
backfill from property_details.listing_events for pre-trigger history.
Climate risk First Street
- Flood 4/10 Moderate FEMA zone X (unshaded) · 21% chance over 30 yrs
- Wildfire 8/10 Severe
- Heat 3/10 Moderate 6 d/yr ≥92°F today · 13 d/yr by 30 yrs out
- Wind 1/10 Low
- Air quality 10/10 Extreme 26 unhealthy d/yr today · 32 by 30 yrs out
Nearby sold comps map
Loading sold comps map…
Walkable amenities ~0.75 mi
Loading nearby amenities…
Taxation est. · year 1
- Rental income
- $28,272
- − Mortgage interest
- −$5,546
- − Property taxes
- −$1,485
- − Insurance
- −$495
- − Repairs & maintenance
- −$2,262
- − Management
- −$2,262
- − HOA
- −$7,680
- − Depreciation
- −$2,880
- Taxable income
- $5,663
- Est. tax owed @ 24.0%
- −$1,359
- After-tax cash flow
- $5,086/yr
For passive investors: Depreciation is non-cash, so a rental often shows a tax loss while cash-flowing — sheltering income. Rental losses are passive: they offset passive income freely, and up to $25,000/yr can offset ordinary (W-2) income if you actively participate and your MAGI is under $100k (phasing out to $0 by $150k); unused losses carry forward. On sale, claimed depreciation is recaptured at up to 25%, and gains may owe capital-gains tax (a 1031 exchange can defer both). Figures are a year-1 estimate at your 24.0% rate — not tax advice; consult a CPA.
Condition & rehab AI · 2 photos
The home requires significant repairs and maintenance, including a new roof and exterior paint, to improve its condition and value.
Repairs flagged
- Major roof — Significant wear and tear visible in the independent image.
- Major exterior siding — Severe peeling and weathering of the siding.
- Major exterior paint — Severe peeling and weathering of the exterior paint.
- Major landscaping — Overgrown and poorly maintained landscaping.
- Major curb appeal — Low curb appeal due to lack of maintenance and overgrown landscaping.
Value-add opportunities
- Both Paint the exterior — Fresh paint can significantly improve the home's curb appeal and resale value.
- Both Replace the roof — A new roof will protect the home from water damage and improve its overall condition.
- Both Trim and maintain the landscaping — Well-maintained landscaping can enhance the home's curb appeal and increase its resale value.
Renovation cost estimate screening
| Repair item | Severity | Est. cost |
|---|---|---|
| roof · Significant wear and tear visible in the independent image. | Major | $15,000–50,000 |
| exterior siding · Severe peeling and weathering of the siding. | Major | $15,000–50,000 |
| exterior paint · Severe peeling and weathering of the exterior paint. | Major | $15,000–50,000 |
| landscaping · Overgrown and poorly maintained landscaping. | Major | $15,000–50,000 |
| curb appeal · Low curb appeal due to lack of maintenance and overgrown landscaping. | Major | $15,000–50,000 |
| Total estimated repair cost · 5 items | $75,000–250,000 |
Value-add ROI direction
- Both Paint the exterior — Fresh paint can significantly improve the home's curb appeal and resale value. ↑
- Both Replace the roof — A new roof will protect the home from water damage and improve its overall condition. ↑
- Both Trim and maintain the landscaping — Well-maintained landscaping can enhance the home's curb appeal and increase its resale value. ↑
ⓘ Cost ranges are severity-bucket heuristics (US national rule-of-thumb). Get contractor quotes + a written scope before underwriting a rehab budget.
Schools (NCES district)
- District
- Missoula H S
- NCES district ID
- 3018540
- Math proficiency
- 31% ▼ -8.00%
- Reading proficiency
- 52% ▼ -1.00%
- Median HH income
- $41,814
- Composite
- 34.87/100
- National rank
- #5087
- State rank
- #53 of 116 in MT
Livability — Missoula
- Score
- 79/100
- State rank
- #17
- US rank
- #2351
Category grades
Schools grade is shown separately in the Schools card above.
Census & demographics
- Census place
- Missoula, MT
- County
- Missoula County · 100,878 people
- City population
- 100,878
- Metro
- Missoula, MT
- Population (ZIP)
- 23,574
- Household income
- $80,239
- Rent vs Own
- Severe rent burden
- 1022.0
Population outlook (Missoula County) Hauer SSP2
- Today (2025)
- 127,248 people
- By 2030
- 133,571 · +5.0%
- By 2040
- 144,833 · +13.8%
- By 2050
- 156,753 · +23.2%
- By 2075
- 189,373 · +48.8%
- By 2100
- 217,637 · +71.0%
Race, ethnicity, and origin ACS 2023
- Neighborhood character
- Predominantly White (87%)
- Race & ethnicity
- White 87% Two or more races 5% Hispanic / Latino 3% Asian 3% Native American 2%
- Common ancestry
- Portuguese 6% Lithuanian 3% Italian 3%
- Foreign-born
- 3% · Canada
- Languages at home
- 94% English-only · Other Asian/Pacific 2% Spanish 2% Russian/Polish/Slavic 1%
Political lean MEDSL · Missoula
- 2024 margin
- Strong D (+21.4) · D 59.0% · R 37.5% · Other 3.5%
- 2008→2024 swing
- -5.3pp toward R · 2008: 26.7pp · 2024: 21.4pp
- All cycles
- 2024: D+21.4 2020: D+23.6 2016: D+15.8 2012: D+18.7 2008: D+26.7
Not yet ingested
- Civics
- —
Market trends
- HPI YoY
- ▼ -165.87%
- Current HPI
- 269.9288
- Rent YoY
- ▲ 2.35%
- Metro
- Missoula, MT
- State GDP YoY
- ▲ 3.41%
- F500 in state
- 2
Industry mix (Fortune 500 HQ in MT)
| Industry | F500 HQs | Revenue |
|---|---|---|
| Technology / Analytics | 1 | $2B |
|
||
Price history
1 event — show timeline
- 2026-06-03 Listed $110,000 MRMLS
Cash-flow waterfall
monthlySold comps — $/sqft
last 12 mo · ≤1 miLoading sold comps…