123 Madrid · Tustin, CA
Flood risk 1/10 · Minimal
- FEMA flood zone
- X (unshaded)
- Chance of flooding over 30 yrs
- 0.0%
- Est. flood insurance / yr
- $507 – $1,088
Fire risk 1/10 · Minimal
- Est. fire insurance / yr
- $659 – $1,223
Heat risk 6/10 · Moderate
- Hot days now (above 90°F)
- 6 days/yr
- Hot days in 30 yrs
- 18 days/yr
Wind risk 1/10 · Minimal
- Chance of severe wind over 30 yrs
- —
Air-quality risk 4/10 · Minor
- Unhealthy air days now
- 3 days/yr
- Unhealthy air days in 30 yrs
- 5 days/yr
Risk factors via First Street. Map © Google.
Why this score? — see what drove the C+ grade
The composite is a weighted blend of 9 inputs, each scored 0–100. Each bar is that input's sub-score; the figure is the points it added to the 100-point composite (weight × sub-score).
- Cash flow +29.6/30.0
- DSCR +10.0/10.0
- 1% rule +8.3/10.0
- Schools +5.0/10.0
- Livability +3.6/5.0
- Rent growth +3.5/5.0
- Condition / age +2.5/5.0
- ARV discount +0.0/15.0
- Appreciation +0.0/10.0
$274,000
🖨 Deal sheet 📄 Offer letter ✓ Due diligence
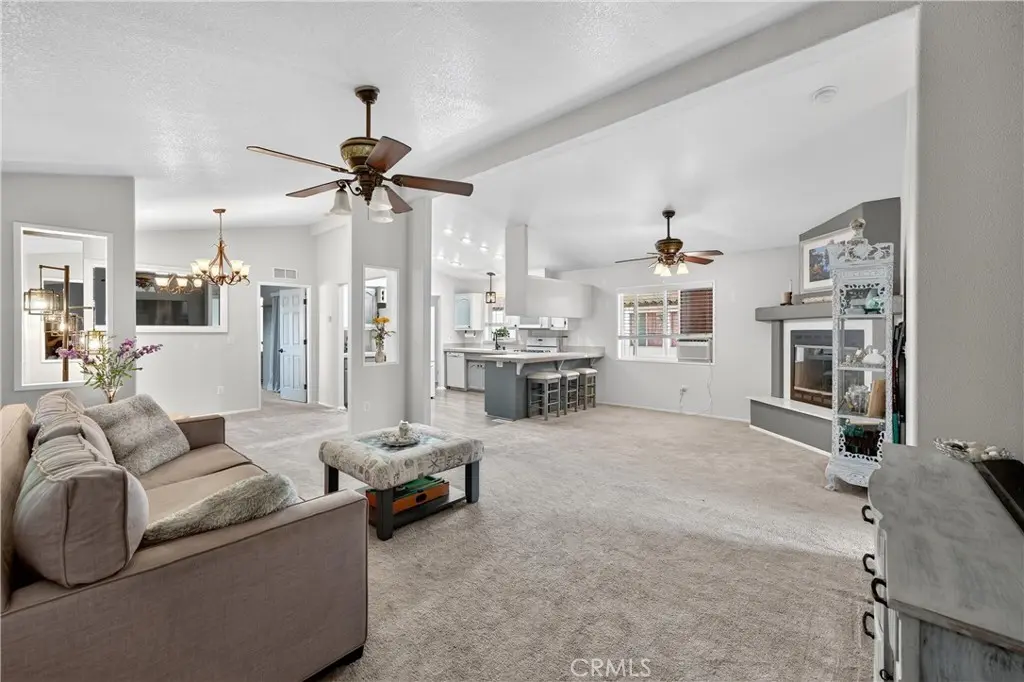
Listing remarks
This isn’t just a space, it’s where years of family dinners, celebrations, and everyday moments quietly built a life. Now, it’s ready for its next chapter. This double wide home offers an open layout that creates a natural flow between living spaces, making it easy to gather, host, and feel at home. One of the few in the community with a matchingjavascript:__doPostBack('m_lbValidate', '') storage shed, adding both function and convenience. Set within the heart of Tustin, you’re surrounded by a community known for its top rated schools, walkable neighborhoods, and a lifestyle that blends convenience with a true neighborhood feel. Just minutes from Old Town Tustin, loc
Key facts
- 17.94 acre lot
- Community pool
- Built 2005
Property features AI
Finance
- Other: Located in Villa Valencia Mobile Estates; Paved road access; Directions: Go into Villa Valencia community. Left on Madrid.
- HOA & community: Park land lease; Land lease approximately $1,755 monthly; Community features: biking, dog park, street lighting, sidewalks, park; Manager approval required
Exterior
- Parking: Located in Villa Valencia Mobile Estates
- Utilities: Public sewer; District/public water; Water available; Sewer available; Natural gas available; Cable available; Electricity available
- Home design: Single-story; Front entry
- Construction: Mobile home remains on site; Mobile home dimensions approximately 264 by 56; Year built source: seller
- Exterior features: Deck; Patio; Fenced pool; Community pool; Landscaped
Interior
- Kitchen: Kitchen island; Microwave; Gas range; Gas oven; Dishwasher
- Bedrooms: Primary bedroom; All bedrooms on one level; Primary suite with primary bathroom
- Bathrooms: 2 full bathrooms; Shower in tub; Separate shower
- Heating & cooling: Wall/window cooling
- Interior features: Open floor plan; Storage space; Community spa
- Laundry & utility: Laundry inside
Neighborhood map
What this means for you Summary
Snapshot
- This is a 3-bed/2.0-bath manufactured listed at $274k.
Deal economics
- At list price, monthly cash flow is $985 ($12k/yr) — positive.
- The deal already cash-flows at list — no discount required.
- Meets the 1% rule at list price ($4k rent vs $274k).
- Recommended offer: $266k (3.0% below list) — sets the bar for market timing.
- Cap rate 10.6% vs local median 1.9% in Tustin — top-decile yield for the area; either an underpriced asset or a hidden risk that comps aren't pricing in. Stress-test before assuming the spread holds.
Location & tenants
- Location reads 71/100 on livability (#215 in CA) — a middle-class / working-renter tenant base. Strengths: employment A+, commute B; Watch: health & safety D+, cost of living F.
- Tustin Unified (urban): math 46% / reading 65% proficiency, ranked #91 of 517 in CA (top 18%) — acceptable for families but not a draw, mixed tenant base, ~2y average lease.
- Market conditions: Rents rising fast (+4.1%/yr); 70 active listings in the ZIP; 40 comparable units currently listed for rent nearby; rentals at typical pace (median 16d on market — plan ~3-4 weeks tenant-placement turnaround); solid renter incomes; 6,974 units permitted in Orange County in 2024 (3,839 in 5+ unit buildings).
- This rent runs 43% of the median local income ($101k/yr) — at the standard rent-burdened threshold; future hikes will face affordability resistance.
Forward outlook
- Local home prices are declining (-3.0%/yr); year-one equity from $2k of loan paydown is wiped out by about $8k of value loss. Plan a longer hold.
- Orange County population projected at +14% by 2050 — modest demand growth; plan on rents tracking national, not racing it.
- At projected returns (-3.0% appreciation + 4.1% rent growth), your $77k cash investment doubles in ~8 years — after that, you're playing with house money.
Negotiation context
- It's been on market 50 days — a 3% lower offer ($266k) is reasonable based on typical stale-listing flexibility.
- 2 sale attempts with the ask held roughly flat each time — persistent listings suggest the price (not the market) is what's stuck; bring a comps-based counter.
Risks & watch-outs
- Climate carrying-cost: extreme-heat days projected 6→18/yr by 2055 (HVAC capex compounding) — expect insurance premiums to compound above CPI over the hold.
Questions for the listing agent
- It's been on market 50 days. Have you received any prior offers? Is the seller open to a 3% concession, seller financing, or rate buy-down credit?
- Is there a deadline driving the sale (1031 exchange, divorce, estate, relocation)? That informs how much negotiation room exists.
- What's the average days-on-market for RENTAL listings here right now (not sales)? A rising rental-DOM trend means longer vacancies and softer asking-rent achievability than the comps imply.
- What's the recent tenant-quality profile in this submarket — average credit score on applications, eviction rate, late-payment / NSF rate, and stable-employment percentage? A property-management company in the area should have these aggregated.
- How much new for-sale + rental construction is in the pipeline within 1–3 miles? Heavy new supply typically softens prices + rents 12–24 months out; constrained supply supports both.
Investment metrics
- 1% rule
- 1.33% ✓
- Cap rate
- 10.61%
- Cash-on-cash
- 15.40%
- DSCR
- 1.69
- GRM
- 6.3
CMA / ARV
- ARV (median comp)
- $220,000
- List price
- $274,000
- Delta
- 24.55%
- Verdict
- OVERPRICED
- Comps
- 3 within 1.0 mi
Show comp detail 7 sales within ~0.75 mi
| Address | Dist | Beds/Ba | Sqft | Sold | Price | $/sf | Match |
|---|---|---|---|---|---|---|---|
| 46 Malaga St | 0.06mi | 3/2.0 | 1,500 (+13%) | 3mo | $215,000 | $143 | 73 |
| 104 Malaga #104 | 0.05mi | 2/2.0 (-1) | 1,200 (-9%) | 14mo | $250,000 | $208 | 66 |
| 5 Granada | 0.08mi | 3/2.0 | 1,431 (+8%) | 22mo | $340,000 | $238 | 64 |
| 33 Madrid | 0.09mi | 3/2.0 | 1,450 (+9%) | 19mo | $379,000 | $261 | 64 |
| 107 Malaga | 0.02mi | 2/2.0 (-1) | 1,440 (+9%) | 20mo | $202,000 | $140 | 63 |
| 149 Granada #149 | 0.09mi | 2/2.0 (-1) | 1,440 (+9%) | 19mo | $260,000 | $181 | 60 |
| 52 Malaga Ave #52 | 0.09mi | 4/2.0 (+1) | 1,464 (+10%) | 16mo | $275,000 | $188 | 60 |
Match score weights: distance 35% · size 25% · config 20% · recency 20%. Top-matched comps best support the ARV.
Projected returns pro-forma
-3.0% appreciation · 4.12% rent growth · sell at horizon
- IRR
- 7.4%
- Equity multiple
- 1.29×
- Total profit
- $22,528
- Equity at exit
- $40,854
- IRR
- 17.7%
- Equity multiple
- 2.54×
- Total profit
- $118,032
- Equity at exit
- $23,691
Cash invested: $76,720 (down + closing). Projections, not guarantees.
Landlord ↔ Tenant lean methodology
- Overall (STATE)
- 18 Strongly Tenant-Friendly
- State California
- 18 Strongly Tenant-Friendly · D+13
- County
- — inherits STATE
- City
- — inherits STATE
ZIP-level market 92780
- Rents YoY
- 4.1%
- Active inventory
- 70
- Price-to-rent
- 6.3×
Monthly cashflow live
- Estimated rent
- $3,643 high interval (Pro) →
- Mortgage (P&I)
- −$1,437
- Tax est. 1.5%
- −$342 /mo · $4,110/yr
- Insurance
- −$114
- HOA
- −$0
- Vacancy / Maint / Mgmt
- −$765
- Net cashflow
- $985
Break-even live
UW: 25.0% down · 7.5% · 30yr · 1.5% tax · 5.0% vac · 8.0% maint · 8.0% mgmt
Financing live
Cash to close
- Down payment
- $68,500
- Closing costs
- $8,220
- Reserves months
- —
- Total cash needed
- —
Loan-product check · same deal, 3 products live
Conventional
25% down · 7.5% · 30yr
- Down + closing
- —
- Monthly P&I
- —
- Monthly cashflow
- —
- DSCR
- —
- Eligible?
- —
Personal DTI + credit; lowest rate.
DSCR
20% down · 8.5% · 30yr
- Down + closing
- —
- Monthly P&I
- —
- Monthly cashflow
- —
- DSCR
- —
- Eligible?
- —
No personal income docs; deal must DSCR.
Hard money
10% down · 12.0% · 12mo
- Down + closing
- —
- Monthly P&I
- —
- Monthly cashflow
- —
- DSCR
- —
- Eligible?
- —
Short-term bridge; refi at stabilization.
Rent comps 40 comps
| Address | Beds | Baths | Sqft | Rent | $/sqft | DOM | Units | Dist |
|---|---|---|---|---|---|---|---|---|
| 2072 Cherokee Tustin, CA | 3.0 | 2.0 | 1281 | $3,995 | $3.12 | 44d | 1 | 0.29mi |
| 13800 Parkcenter Ln Tustin, CA | 1.0–3.0 | 1.0–2.0 | 908 | $3,845 | $4.23 | 3d | 15 | 0.35mi |
| 1651 Mitchell Ave Apt B1 Tustin, CA | 2.0 | 1.5 | 1120 | $2,900 | $2.59 | 44d | 1 | 0.42mi |
| 1651 Mitchell Ave Tustin, CA | 2.0 | 1.5 | 1120 | $3,000 | $2.68 | 7d | 1 | 0.44mi |
| 13582 Sweetshade Way Tustin, CA | 3.0 | 2.5 | 1610 | $4,250 | $2.64 | 44d | 1 | 0.51mi |
| 13843 E Tustin Dr Tustin, CA | 2.0 | 1.0–2.0 | 810 | $3,141 | $3.88 | 1d | 22 | 0.53mi |
| 1625 Birchfield Dr Tustin, CA | 3.0 | 2.0 | 1810 | $4,495 | $2.48 | 24d | 1 | 0.56mi |
| 2131 Seminole Tustin, CA | 3.0 | 2.5 | 1598 | $4,350 | $2.72 | 7d | 1 | 0.57mi |
| 14382 Red Hill Ave Tustin, CA | 2.0 | 1.5–2.0 | 1175 | $2,645 | $2.25 | 3d | 4 | 0.58mi |
| 1361 El Camino Real Tustin, CA | 3.0–4.0 | 2.5–3.0 | 1582 | $4,260 | $2.69 | 1d | 3 | 0.70mi |
| 1432 San Juan St Unit San Juan A3 Tustin, CA | 2.0 | 2.5 | 1100 | $2,795 | $2.54 | 44d | 1 | 0.71mi |
| 14482 Grassmere Ln Tustin, CA | 4.0 | 2.0 | 1535 | $4,500 | $2.93 | 7d | 1 | 0.74mi |
| 13405 Via Almeria Tustin, CA | 3.0 | 3.0 | 1646 | $4,500 | $2.73 | 44d | 1 | 0.75mi |
| 1322 Walnut Ave Tustin, CA | 1.0–2.0 | 1.0–2.0 | 881 | $3,125 | $3.55 | 4d | 6 | 0.84mi |
| 1201 Walnut Ave Tustin, CA | 2.0 | 1.0–2.0 | 925 | $2,892 | $3.13 | 17d | 2 | 0.91mi |
| 2439 Paseo Circulo Tustin, CA | 3.0 | 2.5 | 1507 | $4,900 | $3.25 | 44d | 1 | 0.91mi |
| 1192 Mitchell Ave Tustin, CA | 2.0 | 2.0 | 974 | $2,800 | $2.87 | 7d | 1 | 0.92mi |
| 13381 Lummis Ct Tustin, CA | 3.0 | 3.0 | 1213 | $5,100 | $4.20 | 44d | 1 | 0.92mi |
| 1220 Bryan Ave Tustin, CA | 1.0–2.0 | 1.0 | 850 | $2,825 | $3.32 | 44d | 1 | 0.97mi |
| 16000 Cambridge St Tustin, CA | 2.0 | 2.0 | 1449 | $4,618 | $3.19 | 3d | 3 | 1.01mi |
| 13408 Heritage Way Tustin, CA | 1.0–2.0 | 1.0–2.5 | 850 | $3,390 | $3.99 | 3d | 17 | 1.03mi |
| 14300 Newport Ave Tustin, CA | 1.0–2.0 | 1.0–1.5 | 943 | $3,130 | $3.32 | 2d | 11 | 1.03mi |
| 13202 Myford Rd Tustin, CA | 2.0–3.0 | 2.0–2.5 | 1152 | $4,235 | $3.67 | 3d | 7 | 1.06mi |
| 13211 Myford Rd Tustin, CA | 1.0–2.0 | 1.0–2.0 | 852 | $3,390 | $3.98 | 3d | 12 | 1.06mi |
| 2480 Irvine Blvd Tustin, CA | 2.0–3.0 | 2.0 | 1199 | $4,435 | $3.70 | 2d | 12 | 1.14mi |
| 3000 Marketplace Irvine, CA | 1.0–3.0 | 1.0–2.0 | 1202 | $7,780 | $6.47 | 1d | 157 | 1.14mi |
| 1120 Sycamore Ave #1 Tustin, CA | 3.0 | 2.0 | 1300 | $3,495 | $2.69 | 24d | 1 | 1.16mi |
| 15722 S B St Tustin, CA | 2.0 | 2.0 | 1200 | $3,050 | $2.54 | 24d | 1 | 1.17mi |
| 15695 S B St Tustin, CA | 2.0 | 1.0 | 1000 | $2,795 | $2.79 | 44d | 1 | 1.20mi |
| 1000 Bryan Ave Irvine, CA | 2.0 | 1.0–2.0 | 675 | $3,720 | $5.51 | 1d | 209 | 1.21mi |
| 17272 Walnut Ave Tustin, CA | 1.0–2.0 | 1.0 | 750 | $2,785 | $3.71 | 3d | 2 | 1.21mi |
| 14841 Dove Tree Ct Tustin, CA | 4.0 | 2.5 | 1553 | $4,300 | $2.77 | 21d | 1 | 1.22mi |
| 14841 Dove Tree Ct Tustin, CA | 4.0 | 2.5 | 1553 | $4,300 | $2.77 | 19d | 1 | 1.22mi |
| 17200 McFadden Ave Unit 06A Tustin, CA | 2.0 | 1.5 | 1230 | $3,195 | $2.60 | 24d | 1 | 1.24mi |
| 1414 Montgomery St Tustin, CA | 3.0 | 3.0 | 1827 | $4,400 | $2.41 | 24d | 1 | 1.25mi |
| 14802 Newport Ave Unit 5A Tustin, CA | 2.0 | 2.0 | 1258 | $3,000 | $2.38 | 3d | 1 | 1.25mi |
| 100 Las Palmas Dr Irvine, CA | 1.0–2.0 | 1.0–2.0 | 745 | $3,345 | $4.49 | 3d | 50 | 1.27mi |
| 2354 Sunningdale Dr Tustin, CA | 3.0 | 2.5 | 1350 | $4,200 | $3.11 | 44d | 1 | 1.29mi |
| 15991 Bliss Ln Tustin, CA | 2.0 | 1.0 | 990 | $2,900 | $2.93 | 22d | 1 | 1.31mi |
| 17062 Altadena Dr., 15991 & 16001 Pasadena AVE Tustin, CA | 2.0 | 1.0 | 990 | $2,900 | $2.93 | 15d | 1 | 1.31mi |
Listing history 20 events
-
2026-06-18days on market $274,000 Active 50 DOM
-
2026-06-17days on market $274,000 Active 49 DOM
-
2026-06-16days on market $274,000 Active 48 DOM
-
2026-06-15days on market $274,000 Active 47 DOM
-
2026-06-13days on market $274,000 Active 45 DOM
-
2026-06-13days on market $274,000 Active 44 DOM
-
2026-06-09days on market $274,000 Active 41 DOM
-
2026-06-08days on market $274,000 Active 40 DOM
-
2026-06-07days on market $274,000 Active 39 DOM
-
2026-06-04days on market $274,000 Active 36 DOM
-
2026-06-03days on market $274,000 Active 35 DOM
-
2026-06-02days on market $274,000 Active 34 DOM
-
2026-06-01days on market $274,000 Active 33 DOM
-
2026-05-31days on market $274,000 Active 32 DOM
-
2026-04-29$274,000 Active 851-char remark
-
2026-04-28historical $274,000 851-char remark
-
2026-01-28historical
-
2025-10-16price $298,000
-
2025-09-12status Active
-
2025-07-30historical
ⓘ Source: listings_history table (triggers on properties + properties_extension) + one-shot
backfill from property_details.listing_events for pre-trigger history.
Climate risk First Street
- Flood 1/10 Low FEMA zone X (unshaded) · 0% chance over 30 yrs
- Wildfire 1/10 Low
- Heat 6/10 Major 6 d/yr ≥90°F today · 18 d/yr by 30 yrs out
- Wind 1/10 Low
- Air quality 4/10 Moderate 3 unhealthy d/yr today · 5 by 30 yrs out
Nearby sold comps map
Loading sold comps map…
Walkable amenities ~0.75 mi
Loading nearby amenities…
Taxation est. · year 1
- Rental income
- $43,722
- − Mortgage interest
- −$15,348
- − Property taxes
- −$4,110
- − Insurance
- −$1,370
- − Repairs & maintenance
- −$3,498
- − Management
- −$3,498
- − Depreciation
- −$7,971
- Taxable income
- $7,927
- Est. tax owed @ 24.0%
- −$1,902
- After-tax cash flow
- $9,915/yr
For passive investors: Depreciation is non-cash, so a rental often shows a tax loss while cash-flowing — sheltering income. Rental losses are passive: they offset passive income freely, and up to $25,000/yr can offset ordinary (W-2) income if you actively participate and your MAGI is under $100k (phasing out to $0 by $150k); unused losses carry forward. On sale, claimed depreciation is recaptured at up to 25%, and gains may owe capital-gains tax (a 1031 exchange can defer both). Figures are a year-1 estimate at your 24.0% rate — not tax advice; consult a CPA.
Schools (NCES district)
- District
- Tustin Unified
- NCES district ID
- 0640150
- Math proficiency
- 46% ▼ -6.00%
- Reading proficiency
- 65% ▲ 4.00%
- Median HH income
- $81,864
- Composite
- 50.32/100
- National rank
- #1880
- State rank
- #91 of 517 in CA
Livability — Tustin
- Score
- 71/100
- State rank
- #215
- US rank
- #6806
Category grades
Schools grade is shown separately in the Schools card above.
Census & demographics
- Census place
- Tustin, CA
- County
- Orange County · 3,096,323 people
- City population
- 84,447
- Metro
- Los Angeles-Long Beach-Anaheim, CA
- Population (ZIP)
- 54,374
- Household income
- $101,017
- Rent vs Own
- Severe rent burden
- 3031.0
Population outlook (Orange County) Hauer SSP2
- Today (2025)
- 3,477,456 people
- By 2030
- 3,613,117 · +3.9%
- By 2040
- 3,835,945 · +10.3%
- By 2050
- 3,968,736 · +14.1%
- By 2075
- 4,097,053 · +17.8%
- By 2100
- 3,903,633 · +12.3%
Race, ethnicity, and origin ACS 2023
- Neighborhood character
- Diverse neighborhood (Simpson 0.64)
- Race & ethnicity
- Hispanic / Latino 52% White 27% Two or more races 16% Asian 14% Black 3%
- Hispanic origin (detail)
- Mexican 43%
- Common ancestry
- Romanian 1% Slovak 1% Italian 1%
- Foreign-born
- 33% · Canada, Vietnam, China
- Languages at home
- 47% English-only · Spanish 40% Other Indo-European 3% Tagalog/Filipino 2%
Political lean MEDSL · Orange
- 2024 margin
- Toss-up / Even · D 49.7% · R 47.1% · Other 3.2%
- 2008→2024 swing
- +5.2pp toward D · 2008: -2.6pp · 2024: 2.6pp
- All cycles
- 2024: D+2.6 2020: D+9.0 2016: D+7.7 2012: R+8.3 2008: R+2.6
Not yet ingested
- Civics
- —
Market trends
- HPI YoY
- ▼ -924.13%
- Current HPI
- 482.9143
- Rent YoY
- ▲ 4.12%
- Metro
- Los Angeles-Long Beach-Anaheim, CA
- State GDP YoY
- ▲ 3.21%
- F500 in state
- 116
Industry mix (Fortune 500 HQ in CA)
| Industry | F500 HQs | Revenue |
|---|---|---|
| Technology | 27 | $1,492B |
|
||
| Financial Services | 3 | $174B |
|
||
| Retail | 3 | $44B |
|
||
| Insurance | 3 | $26B |
|
||
| Media / Entertainment | 2 | $115B |
|
||
| Pharmaceuticals / Biotech | 2 | $62B |
|
||
Price history
-8.1% since first listed6 events — show timeline
- 2026-04-29 Listed $274,000 CRMLS
- 2026-04-28 Coming Soon $274,000 CRMLS
- 2026-01-28 Listing Removed — CRMLS
- 2025-10-16 Price Changed $298,000 CRMLS
- 2025-09-12 Relisted — CRMLS
- 2025-07-30 Coming Soon — CRMLS
Property tax history
-4.4%/yrLatest (2025): $368 · +2.7% YoY. Source: county tax records.
Cash-flow waterfall
monthlySold comps — $/sqft
last 12 mo · ≤1 miLoading sold comps…