 🏗️ New Construction
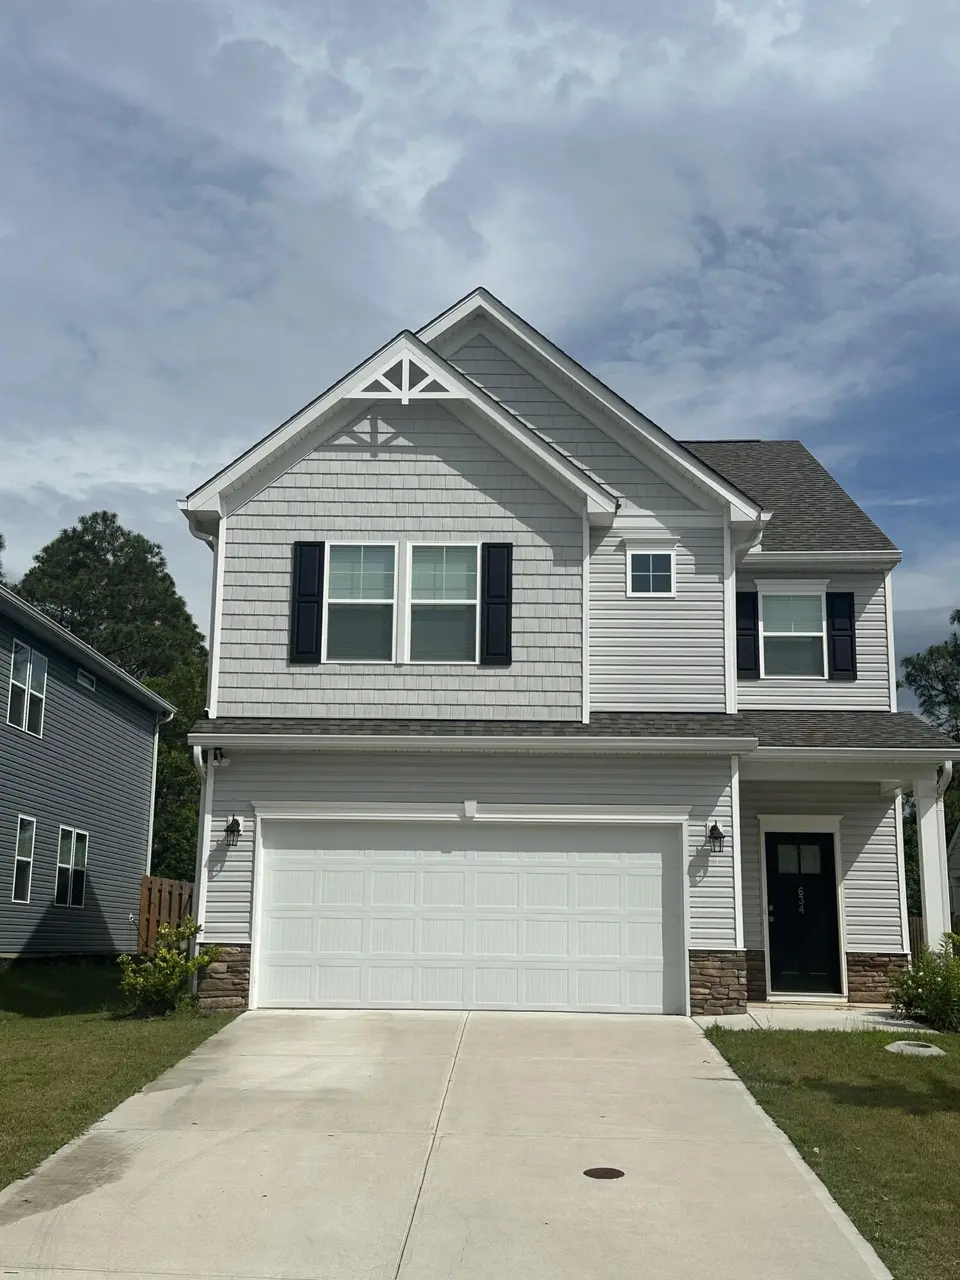
634 Count Fleet Ct · Burnettown, SC
Flood risk 1/10 · Minimal
- FEMA flood zone
- X (unshaded)
- Chance of flooding over 30 yrs
- 0.0%
- Est. flood insurance / yr
- $507 – $1,088
Fire risk 5/10 · Moderate
- Est. fire insurance / yr
- $783 – $1,453
Heat risk 7/10 · Major
- Hot days now (above 109°F)
- 7 days/yr
- Hot days in 30 yrs
- 17 days/yr
Wind risk 6/10 · Moderate
- Chance of severe wind over 30 yrs
- 66.0%
Air-quality risk 3/10 · Minor
- Unhealthy air days now
- 3 days/yr
- Unhealthy air days in 30 yrs
- 4 days/yr
Risk factors via First Street. Map © Google.
Why this score? — see what drove the B- grade
The composite is a weighted blend of 9 inputs, each scored 0–100. Each bar is that input's sub-score; the figure is the points it added to the 100-point composite (weight × sub-score).
- Cash flow +23.6/30.0
- Appreciation +9.2/10.0
- DSCR +7.6/10.0
- ARV discount +7.5/15.0
- 1% rule +5.2/10.0
- Condition / age +4.0/5.0
- Schools +3.2/10.0
- Livability +3.2/5.0
- Rent growth +2.5/5.0
$274,500
🖨 Deal sheet 📄 Offer letter ✓ Due diligence
Listing remarks
* * * OFFERING $5000 CONCESSION * * * For benefit of buyer at closing. Skip the wait for new construction! Built in 2024 by Stanley Martin Homes, this popular Granger floor plan offers approximately 2,246 square feet of thoughtfully designed living space with 4 bedrooms and 2.5 bathrooms in the Clairbourne community of Graniteville. The open-concept main level is ideal for both everyday living and entertaining, featuring a spacious living area that flows seamlessly into the kitchen and dining space. Upstairs, you'll find all four bedrooms, including a generous primary suite complete with a soaking tub, separate shower, and walk-in closet. Enjoy the benefits of newer construction, ener
Key facts
- Soaking tub
- Walk-in closet
- Primary suite
Tags
Property features AI
Finance
- Other: Subdivision: Clairbourne; Directions available
- HOA & community: Homeowners association with annual fee of $400 (about $33.33/month); Community pool
Exterior
- Parking: Attached garage with 2 spaces; Driveway; Garage door opener
- Security: Smoke detector(s)
- Utilities: Public water; Public sewer; Underground utilities; Cable available
- Home design: Single family residence; Two levels; New construction
- Construction: Stone and vinyl siding exterior; Composition roof; Slab foundation; Built as new construction
- Exterior features: Front and rear sprinklers; Porch; Patio; Community pool; Concrete road access
Interior
- Kitchen: Dishwasher; Disposal; Range; Microwave; Tankless water heater
- Bedrooms: Total rooms: 8
- Flooring: Vinyl; Carpet
- Bathrooms: 2 full bathrooms; 1 half bathroom
- Heating & cooling: Forced air heating (natural gas); Central air conditioning
- Interior features: Walk-in closets; Kitchen island; Pantry; High-speed internet; Insulated windows; Smoke detector(s)
- Laundry & utility: Washer hookup; Electric dryer hookup
Neighborhood map
What this means for you Summary
Snapshot
- This is a 4-bed/2.5-bath single-family listed at $274k. Condition is rated good.
Deal economics
- At list price, monthly cash flow is $527 ($6k/yr) — positive.
- The deal already cash-flows at list — no discount required.
- Meets the 1% rule at list price ($3k rent vs $274k).
- Recommended offer: $270k (1.5% below list) — sets the bar for market timing.
- Cap rate 8.6% vs local median 5.5% in Burnettown — top-decile yield for the area; either an underpriced asset or a hidden risk that comps aren't pricing in. Stress-test before assuming the spread holds.
Location & tenants
- Location reads 64/100 on livability (#159 in SC) — a middle-class / working-renter tenant base. Strengths: crime A+, cost of living A+, housing A+; Watch: amenities F, commute F, employment D-.
- Aiken 01 (suburban): math 31% / reading 44% proficiency, ranked #36 of 80 in SC (top 45%) — families likely to look elsewhere, expect single-tenant / working-renter base with shorter leases.
- Zoned schools: Jefferson Elementary (math 34% / reading 34%, grade F, #359 of 597 statewide, top 60%, 557 students, 100% FRL); Midland Valley High (math 31% / reading 83%, grade C, #120 of 196 statewide, top 64%, 1,477 students, 62% FRL) — zoned schools average 81% FRL vs 54% district-wide (27 pts higher); higher-poverty schools than district average — tighter screening recommended.
- Market conditions: 299 active listings in the ZIP; 2 comparable units currently listed for rent nearby; solid renter incomes; 2,500 units permitted in Aiken County in 2024 (1,023 in 5+ unit buildings).
- This rent runs 40% of the median local income ($84k/yr) — at the standard rent-burdened threshold; future hikes will face affordability resistance.
Forward outlook
- In year one you build about $25k of equity ($2k loan paydown + $23k appreciation (8.4% local appreciation)).
- Aiken County population projected at +9% by 2050 — modest demand growth; plan on rents tracking national, not racing it.
- At projected returns (8.4% appreciation + 3.0% rent growth), your $78k cash investment doubles in ~3 years — after that, you're playing with house money.
- By year 2, paydown + projected appreciation supports a ~$40k cash-out refi (75% LTV) — recoverable capital for the next deal without selling this one.
Negotiation context
- It's been on market 18 days — a 2% lower offer ($270k) is reasonable based on typical stale-listing flexibility.
Risks & watch-outs
- Climate carrying-cost: major wind risk, 66% chance of damaging wind over 30y; moderate wildfire risk; extreme-heat days projected 7→17/yr by 2055 (HVAC capex compounding) — expect insurance premiums to compound above CPI over the hold.
Questions for the listing agent
- What does the HOA fee cover, when was the last increase, and are there any pending special assessments or reserve-fund shortfalls?
- Is there a deadline driving the sale (1031 exchange, divorce, estate, relocation)? That informs how much negotiation room exists.
- Schools are D-rated, which usually means shorter tenancies and higher turnover. Who's the typical renter profile here, and what's been the actual vacancy rate?
- What's the average days-on-market for RENTAL listings here right now (not sales)? A rising rental-DOM trend means longer vacancies and softer asking-rent achievability than the comps imply.
- What's the recent tenant-quality profile in this submarket — average credit score on applications, eviction rate, late-payment / NSF rate, and stable-employment percentage? A property-management company in the area should have these aggregated.
- How much new for-sale + rental construction is in the pipeline within 1–3 miles? Heavy new supply typically softens prices + rents 12–24 months out; constrained supply supports both.
Investment metrics
- 1% rule
- 1.02% ✓
- Cap rate
- 8.56%
- Cash-on-cash
- 8.11%
- DSCR
- 1.36
- GRM
- 8.2
CMA / ARV
- ARV (on-the-fly)
- $278,504
- Comps found
- 12
Show comp detail 12 sales within ~0.75 mi
| Address | Dist | Beds/Ba | Sqft | Sold | Price | $/sf | Match |
|---|---|---|---|---|---|---|---|
| 6240 Whirlaway Rd | 0.13mi | 4/2.5 | 2,431 (+8%) | 2mo | $314,400 | $129 | 79 |
| 985 Tess St | 0.23mi | 4/3.5 | 2,386 (+6%) | 2mo | $284,900 | $119 | 73 |
| 945 Tess St | 0.27mi | 4/3.5 | 2,386 (+6%) | 1mo | $279,900 | $117 | 72 |
| 908 Tess St | 0.30mi | 4/3.5 | 2,386 (+6%) | 1mo | $289,900 | $122 | 71 |
| 875 Tess St | 0.32mi | 4/3.5 | 2,386 (+6%) | 1mo | $316,805 | $133 | 70 |
| 902 Tess St | 0.31mi | 4/2.5 | 2,046 (-9%) | 2mo | $275,900 | $135 | 69 |
| 871 Tess St | 0.33mi | 4/2.5 | 2,046 (-9%) | 3mo | $275,900 | $135 | 68 |
| 955 Tess St | 0.26mi | 4/2.5 | 2,505 (+12%) | 2mo | $289,900 | $116 | 67 |
| 915 Tess St | 0.29mi | 4/2.5 | 2,505 (+12%) | 1mo | $304,900 | $122 | 66 |
| 935 Tess St | 0.28mi | 4/2.5 | 2,505 (+12%) | 2mo | $303,795 | $121 | 66 |
| 926 Tess St | 0.28mi | 4/2.5 | 2,505 (+12%) | 3mo | $310,000 | $124 | 66 |
| 893 Tess St | 0.31mi | 4/2.5 | 2,505 (+12%) | 3mo | $320,750 | $128 | 64 |
Match score weights: distance 35% · size 25% · config 20% · recency 20%. Top-matched comps best support the ARV.
Projected returns pro-forma
8.38% appreciation · 3.0% rent growth · sell at horizon
- IRR
- 27.0%
- Equity multiple
- 2.99×
- Total profit
- $155,023
- Equity at exit
- $218,829
- IRR
- 24.1%
- Equity multiple
- 6.45×
- Total profit
- $425,083
- Equity at exit
- $441,468
Cash invested: $77,981 (down + closing). Projections, not guarantees.
Landlord ↔ Tenant lean methodology
- Overall (STATE)
- 90 Strongly Landlord-Friendly
- State South Carolina
- 90 Strongly Landlord-Friendly · R+6
- County
- — inherits STATE
- City
- — inherits STATE
ZIP-level market 29829
- Home prices YoY
- 3.0%
- Active inventory
- 299
- Price-to-rent
- 8.1×
Monthly cashflow live
- Estimated rent
- $2,834 medium interval (Pro) →
- Mortgage (P&I)
- −$1,461
- Tax from tax record
- −$102 /mo · $1,228/yr
- Insurance
- −$116
- HOA
- −$33
- Vacancy / Maint / Mgmt
- −$595
- Net cashflow
- $527
Break-even live
UW: 25.0% down · 7.5% · 30yr · 1.5% tax · 5.0% vac · 8.0% maint · 8.0% mgmt
Financing live
Cash to close
- Down payment
- $69,626
- Closing costs
- $8,355
- Reserves months
- —
- Total cash needed
- —
Loan-product check · same deal, 3 products live
Conventional
25% down · 7.5% · 30yr
- Down + closing
- —
- Monthly P&I
- —
- Monthly cashflow
- —
- DSCR
- —
- Eligible?
- —
Personal DTI + credit; lowest rate.
DSCR
20% down · 8.5% · 30yr
- Down + closing
- —
- Monthly P&I
- —
- Monthly cashflow
- —
- DSCR
- —
- Eligible?
- —
No personal income docs; deal must DSCR.
Hard money
10% down · 12.0% · 12mo
- Down + closing
- —
- Monthly P&I
- —
- Monthly cashflow
- —
- DSCR
- —
- Eligible?
- —
Short-term bridge; refi at stabilization.
Rent comps 2 comps
| Address | Beds | Baths | Sqft | Rent | $/sqft | DOM | Units | Dist |
|---|---|---|---|---|---|---|---|---|
| 618 Count Fleet Ct Graniteville, SC | 4.0 | 2.5 | 2362 | $2,299 | $0.97 | 21d | 1 | 0.04mi |
| 6370 Whirlaway Rd Graniteville, SC | 5.0 | 3.0 | 2830 | $2,755 | $0.97 | 14d | 1 | 0.23mi |
HOA detail
- Monthly dues
- $33 · $396/yr
Listing history 15 events
-
2026-06-18days on market $274,500 Active 18 DOM
-
2026-06-17days on market $274,500 Active 17 DOM
-
2026-06-16days on market $274,500 Active 16 DOM
-
2026-06-15days on market $274,500 Active 15 DOM
-
2026-06-14days on market $274,500 Active 13 DOM
-
2026-06-13days on market $274,500 Active 12 DOM
-
2026-06-10days on market $274,500 Active 10 DOM
-
2026-06-09days on market $274,500 Active 9 DOM
-
2026-06-08days on market $274,500 Active 8 DOM
-
2026-06-07pricedays on market $274,500 Active 7 DOM
-
2026-06-03days on market $286,000 Active 3 DOM
-
2026-06-02days on market $286,000 Active 2 DOM
-
2026-06-01pricedays on market $286,000 Active 1 DOM
-
2026-04-15price $292,000
-
2026-03-29$305,500 Active
ⓘ Source: listings_history table (triggers on properties + properties_extension) + one-shot
backfill from property_details.listing_events for pre-trigger history.
Tax reassessment forecast SC · Resets to sale price
- Current annual tax
- $1,228 · $102/mo
- Projected year-2 tax
- $1,565 · $130/mo
- Expected delta
- +$337/yr (+$28/mo · 27.5%)
ⓘ Screening estimate from a state-policy table — verify with the county assessor before closing.
Climate risk First Street
- Flood 1/10 Low FEMA zone X (unshaded) · 0% chance over 30 yrs
- Wildfire 5/10 Major
- Heat 7/10 Severe 7 d/yr ≥109°F today · 17 d/yr by 30 yrs out
- Wind 6/10 Major 66% chance of damaging wind over 30 yrs
- Air quality 3/10 Moderate 3 unhealthy d/yr today · 4 by 30 yrs out
Nearby sold comps map
Loading sold comps map…
Walkable amenities ~0.75 mi
Loading nearby amenities…
Taxation est. · year 1
- Rental income
- $34,010
- − Mortgage interest
- −$15,601
- − Property taxes
- −$1,228
- − Insurance
- −$1,393
- − Repairs & maintenance
- −$2,721
- − Management
- −$2,721
- − HOA
- −$396
- − Depreciation
- −$8,102
- Taxable income
- $1,850
- Est. tax owed @ 24.0%
- −$444
- After-tax cash flow
- $5,882/yr
For passive investors: Depreciation is non-cash, so a rental often shows a tax loss while cash-flowing — sheltering income. Rental losses are passive: they offset passive income freely, and up to $25,000/yr can offset ordinary (W-2) income if you actively participate and your MAGI is under $100k (phasing out to $0 by $150k); unused losses carry forward. On sale, claimed depreciation is recaptured at up to 25%, and gains may owe capital-gains tax (a 1031 exchange can defer both). Figures are a year-1 estimate at your 24.0% rate — not tax advice; consult a CPA.
Condition & rehab AI · 1 photo
This 2024-built single-family home in Burnettown SC is in excellent condition with no visible repairs needed. It offers a good return on investment with updates like landscaping and interior paint to enhance its resale and rental value.
Value-add opportunities
- Both Landscaping — Enhances curb appeal and adds value
- Both Interior paint — Fresh paint can make the home more appealing
- Both Lighting — Improved lighting can make the home more inviting
Renovation cost estimate screening
Value-add ROI direction
- Both Landscaping — Enhances curb appeal and adds value ↑
- Both Interior paint — Fresh paint can make the home more appealing ↑
- Both Lighting — Improved lighting can make the home more inviting ↑
ⓘ Cost ranges are severity-bucket heuristics (US national rule-of-thumb). Get contractor quotes + a written scope before underwriting a rehab budget.
Schools (NCES district)
- District
- Aiken 01
- NCES district ID
- 4500720
- Math proficiency
- 31% ▼ -11.00%
- Reading proficiency
- 44% ▼ -1.00%
- Median HH income
- $45,081
- Composite
- 31.91/100
- National rank
- #5857
- State rank
- #36 of 80 in SC
Livability — Burnettown
- Score
- 64/100
- State rank
- #159
- US rank
- #14711
Category grades
Schools grade is shown separately in the Schools card above.
Census & demographics
- County
- Aiken County · 116,534 people
- City population
- 931
- Metro
- Augusta-Richmond County, GA-SC
- Population (ZIP)
- 12,385
- Household income
- $84,228
- Rent vs Own
- Severe rent burden
- 213.0
Population outlook (Aiken County) Hauer SSP2
- Today (2025)
- 178,003 people
- By 2030
- 182,876 · +2.7%
- By 2040
- 189,970 · +6.7%
- By 2050
- 193,840 · +8.9%
- By 2075
- 199,453 · +12.1%
- By 2100
- 192,403 · +8.1%
Race, ethnicity, and origin ACS 2023
- Neighborhood character
- Diverse neighborhood (Simpson 0.58)
- Race & ethnicity
- White 59% Black 26% Hispanic / Latino 12% Two or more races 9% Asian 1%
- Hispanic origin (detail)
- Mexican 8% Puerto Rican 1%
- Common ancestry
- Italian 2% Swedish 2% Slovak 1%
- Foreign-born
- 6% · Canada
- Languages at home
- 89% English-only · Spanish 10% Other Indo-European 1%
Political lean MEDSL · Aiken
- 2024 margin
- Strong R (+25.9) · D 36.4% · R 62.2% · Other 1.4%
- 2008→2024 swing
- -1.9pp toward R · 2008: -24.0pp · 2024: -25.9pp
- All cycles
- 2024: R+25.9 2020: R+22.7 2016: R+27.5 2012: R+26.0 2008: R+24.0
Not yet ingested
- Civics
- —
Market trends
- HPI YoY
- ▲ 8.38%
- Current HPI
- 286.4155
- Rent YoY
- —
- Metro
- Augusta-Richmond County, GA-SC
- State GDP YoY
- ▲ 4.51%
- F500 in state
- 2
Industry mix (Fortune 500 HQ in SC)
| Industry | F500 HQs | Revenue |
|---|---|---|
| Packaging | 1 | $7B |
|
||
Price history
-4.4% since first listed2 events — show timeline
- 2026-04-15 Price Changed $292,000 AMLS
- 2026-03-29 Listed $305,500 AMLS
Property tax history
+142.5%/yrLatest (2025): $1,228 · +142.5% YoY. Source: county tax records.
Cash-flow waterfall
monthlySold comps — $/sqft
last 12 mo · ≤1 miLoading sold comps…